Cross-Market Analytics
1. Raw Sector correlation context
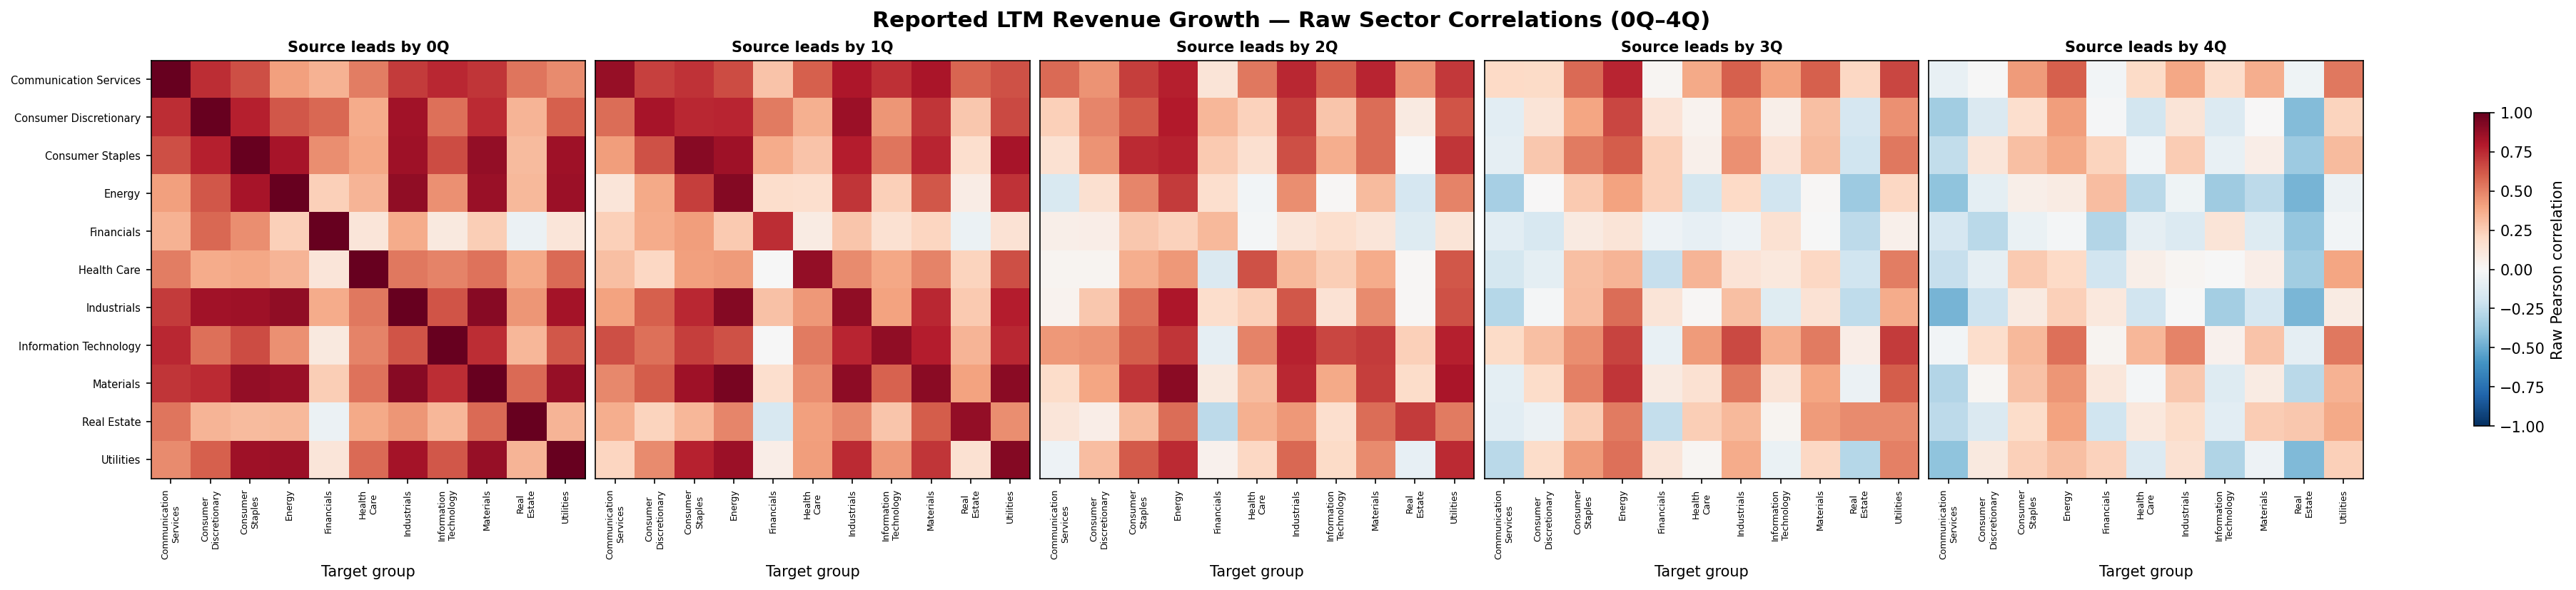
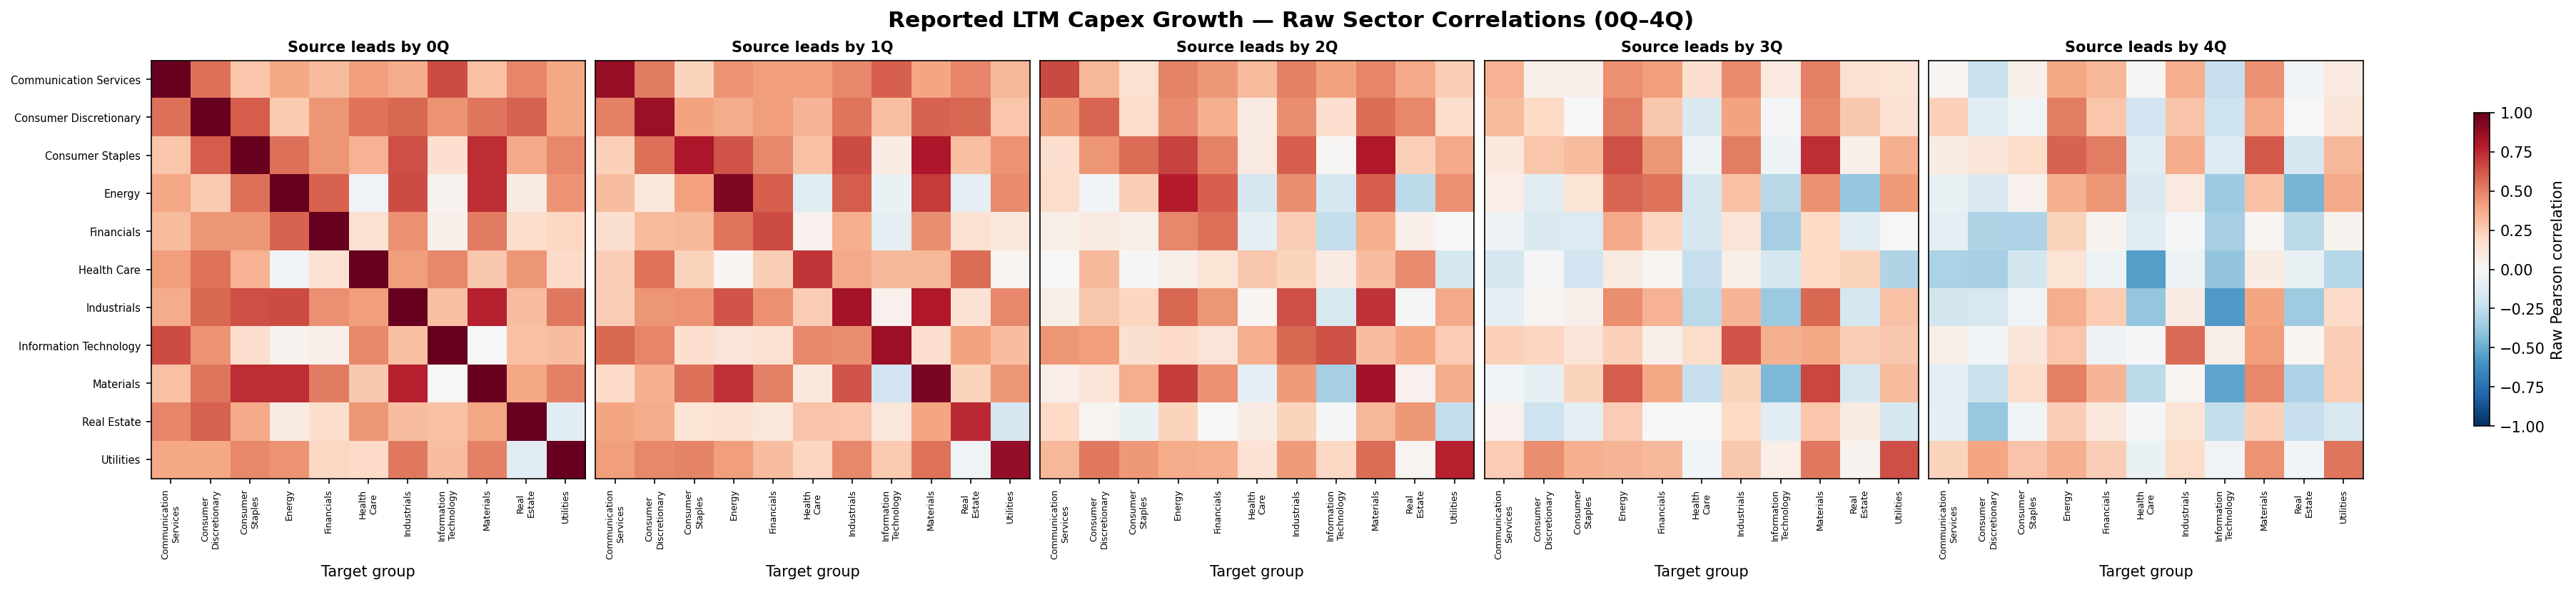
Association only. These heatmaps compare reported LTM YoY growth at t with the same metric at t+lag. They include the common economic cycle and are context—not proof of forecasting power.
 Back to top ↑
2. Near-Term Industry and Sub-Industry Relationships — 1Q–4Q
This section excludes same-group persistence and contemporaneous 0Q relationships. It shows one strongest 1Q–4Q lag per ordered pair, requires at least 36 quarterly observations, and distinguishes Revenue → Revenue, Revenue → CapEx, CapEx → Revenue and CapEx → CapEx. Economic distance measures novelty, not confidence. Economic priors are horizon-specific; relationships outside a prior's expected lag range remain unreviewed in this section.
| Relationship | Source | Lead | Target | r | Lead advantage | Cycle-adjusted r | Obs. | Evidence | Economic prior | Novelty | Assessment | Rationale |
|---|
Click any table row to open its lead-aligned time series. Full outputs: correlations/lead_lag_discovery_near_term.csv, correlations/lead_lag_discovery.csv and correlations/raw_lagged_correlations.csv.
3. Long-Cycle Industry and Sub-Industry Relationships — 5Q–8Q
This section excludes same-group persistence and contemporaneous 0Q relationships. It shows one strongest 5Q–8Q lag per ordered pair, requires at least 36 quarterly observations, and distinguishes Revenue → Revenue, Revenue → CapEx, CapEx → Revenue and CapEx → CapEx. Economic distance measures novelty, not confidence. Economic priors are horizon-specific; relationships outside a prior's expected lag range remain unreviewed in this section.
| Relationship | Source | Lead | Target | r | Lead advantage | Cycle-adjusted r | Obs. | Evidence | Economic prior | Novelty | Assessment | Rationale |
|---|
Click any table row to open its lead-aligned time series. Full outputs: correlations/lead_lag_discovery_long_cycle.csv, correlations/lead_lag_discovery.csv and correlations/raw_lagged_correlations.csv.
4. Relationship-prior audit
The prior is an editable, analyst-defined economic map recorded independently of the observed correlations. “Expected + observed” confirms a known transmission; weak or mismatched results flag a possible change; strong unknown relationships become research candidates. Each prior is assessed against the discovery horizon overlapping its expected lag range.
| Level | Metrics | Ordered pair | Relationship type | Expected sign / lag | Observed horizon | Prior confidence | Observed r | Assessment |
|---|---|---|---|---|---|---|---|---|
| Industry | CapEx → Revenue | Oil, Gas & Consumable Fuels → Energy Equipment & Services | CapEx customer | +; 1Q–4Q | Near-Term Relationships | High | 0.79 | Expected but non-directional |
| Industry | CapEx → Revenue | Electric Utilities → Electrical Equipment | Infrastructure demand | +; 1Q–4Q | Near-Term Relationships | High | 0.56 | Expected but non-directional |
| Industry | Revenue → Revenue | Household Durables → Building Products | Customer demand | +; 1Q–2Q | Near-Term Relationships | High | 0.79 | Expected but non-directional |
| Industry | Revenue → Revenue | Construction Materials → Construction & Engineering | Upstream supplier | +; 1Q–3Q | Near-Term Relationships | Medium | 0.57 | Expected but non-directional |
| Industry | Revenue → Revenue | Automobiles → Automobile Components | Customer to supplier | +; 1Q–2Q | Near-Term Relationships | High | 0.71 | Expected but non-directional |
| Industry | Revenue → Revenue | Passenger Airlines → Aerospace & Defense | CapEx customer | +; 2Q–4Q | Near-Term Relationships | Low | 0.51 | Prior mismatch |
| Industry | Revenue → Revenue | Hotels, Restaurants & Leisure → Passenger Airlines | Shared end demand | +; 1Q–2Q | Near-Term Relationships | Medium | 0.92 | Expected but non-directional |
| Industry | CapEx → Revenue | Metals & Mining → Machinery | CapEx customer | +; 1Q–4Q | Near-Term Relationships | Medium | 0.44 | Expected but non-directional |
| Industry | Revenue → Revenue | Chemicals → Containers & Packaging | Input supplier | +; 1Q–3Q | Near-Term Relationships | Medium | 0.58 | Expected but non-directional |
| Industry | Revenue → Revenue | Technology Hardware, Storage & Peripherals → Electronic Equipment, Instruments & Components | Customer demand | +; 1Q–3Q | Near-Term Relationships | Medium | 0.84 | Expected but non-directional |
| Sub Industry | CapEx → Revenue | Semiconductors → Semiconductor Materials & Equipment | CapEx customer | +; 1Q–4Q | Near-Term Relationships | High | 0.53 | Expected but non-directional |
| Sub Industry | Revenue → Revenue | Semiconductors → Semiconductor Materials & Equipment | Customer demand | +; 1Q–4Q | Near-Term Relationships | High | 0.73 | Confirmed prior |
| Sub Industry | Revenue → Revenue | Copper → Electrical Components & Equipment | Input supplier | +; 1Q–3Q | Near-Term Relationships | Medium | 0.73 | Expected but weak |
| Sub Industry | Revenue → Revenue | Homebuilding → Building Products | Customer demand | +; 1Q–2Q | Near-Term Relationships | High | 0.55 | Expected but non-directional |
| Sub Industry | CapEx → Revenue | Oil & Gas Exploration & Production → Oil & Gas Equipment & Services | CapEx customer | +; 1Q–4Q | Near-Term Relationships | High | 0.82 | Expected but non-directional |
| Sub Industry | CapEx → Revenue | Electric Utilities → Heavy Electrical Equipment | Infrastructure demand | +; 1Q–4Q | Near-Term Relationships | High | 0.37 | Expected but non-directional |
| Sub Industry | CapEx → Revenue | Data Center REITs → Electrical Components & Equipment | Infrastructure demand | +; 1Q–4Q | — | High | — | Insufficient eligible history |
| Sub Industry | Revenue → Revenue | Passenger Airlines → Airport Services | Customer demand | +; 1Q–2Q | Near-Term Relationships | High | 0.95 | Expected but weak |
| Sub Industry | Revenue → Revenue | Commodity Chemicals → Paper & Plastic Packaging Products & Materials | Input supplier | +; 1Q–3Q | Near-Term Relationships | Medium | 0.44 | Expected but weak |
| Sub Industry | Revenue → Revenue | Steel → Construction Machinery & Heavy Transportation Equipment | Shared industrial demand | +; 1Q–3Q | Near-Term Relationships | Low | 0.51 | Expected but non-directional |
| Sub Industry | Revenue → Revenue | Electronic Components → Electronic Manufacturing Services | Upstream supplier | +; 1Q–2Q | — | High | — | Insufficient eligible history |
| Sub Industry | Revenue → Revenue | Broadline Retail → Air Freight & Logistics | Customer demand | +; 1Q–2Q | Near-Term Relationships | Medium | 0.83 | Confirmed prior |
| Sub Industry | Revenue → Revenue | Homebuilding → Home Improvement Retail | Shared housing demand | +; 1Q–2Q | — | Medium | — | Insufficient eligible history |
| Sub Industry | Revenue → Revenue | Oil & Gas Exploration & Production → Oil & Gas Drilling | Customer demand | +; 1Q–3Q | — | High | — | Insufficient eligible history |
| Sub Industry | CapEx → Revenue | Renewable Electricity → Heavy Electrical Equipment | Infrastructure demand | +; 1Q–4Q | Near-Term Relationships | High | -0.43 | Prior mismatch |
| Sub Industry | Revenue → Revenue | Semiconductors → Electronic Manufacturing Services | Customer demand | +; 1Q–3Q | — | Medium | — | Insufficient eligible history |
The versioned input and complete audit are copied to correlations/relationship_priors.csv and correlations/relationship_prior_audit.csv.
5. Revision-cycle positioning
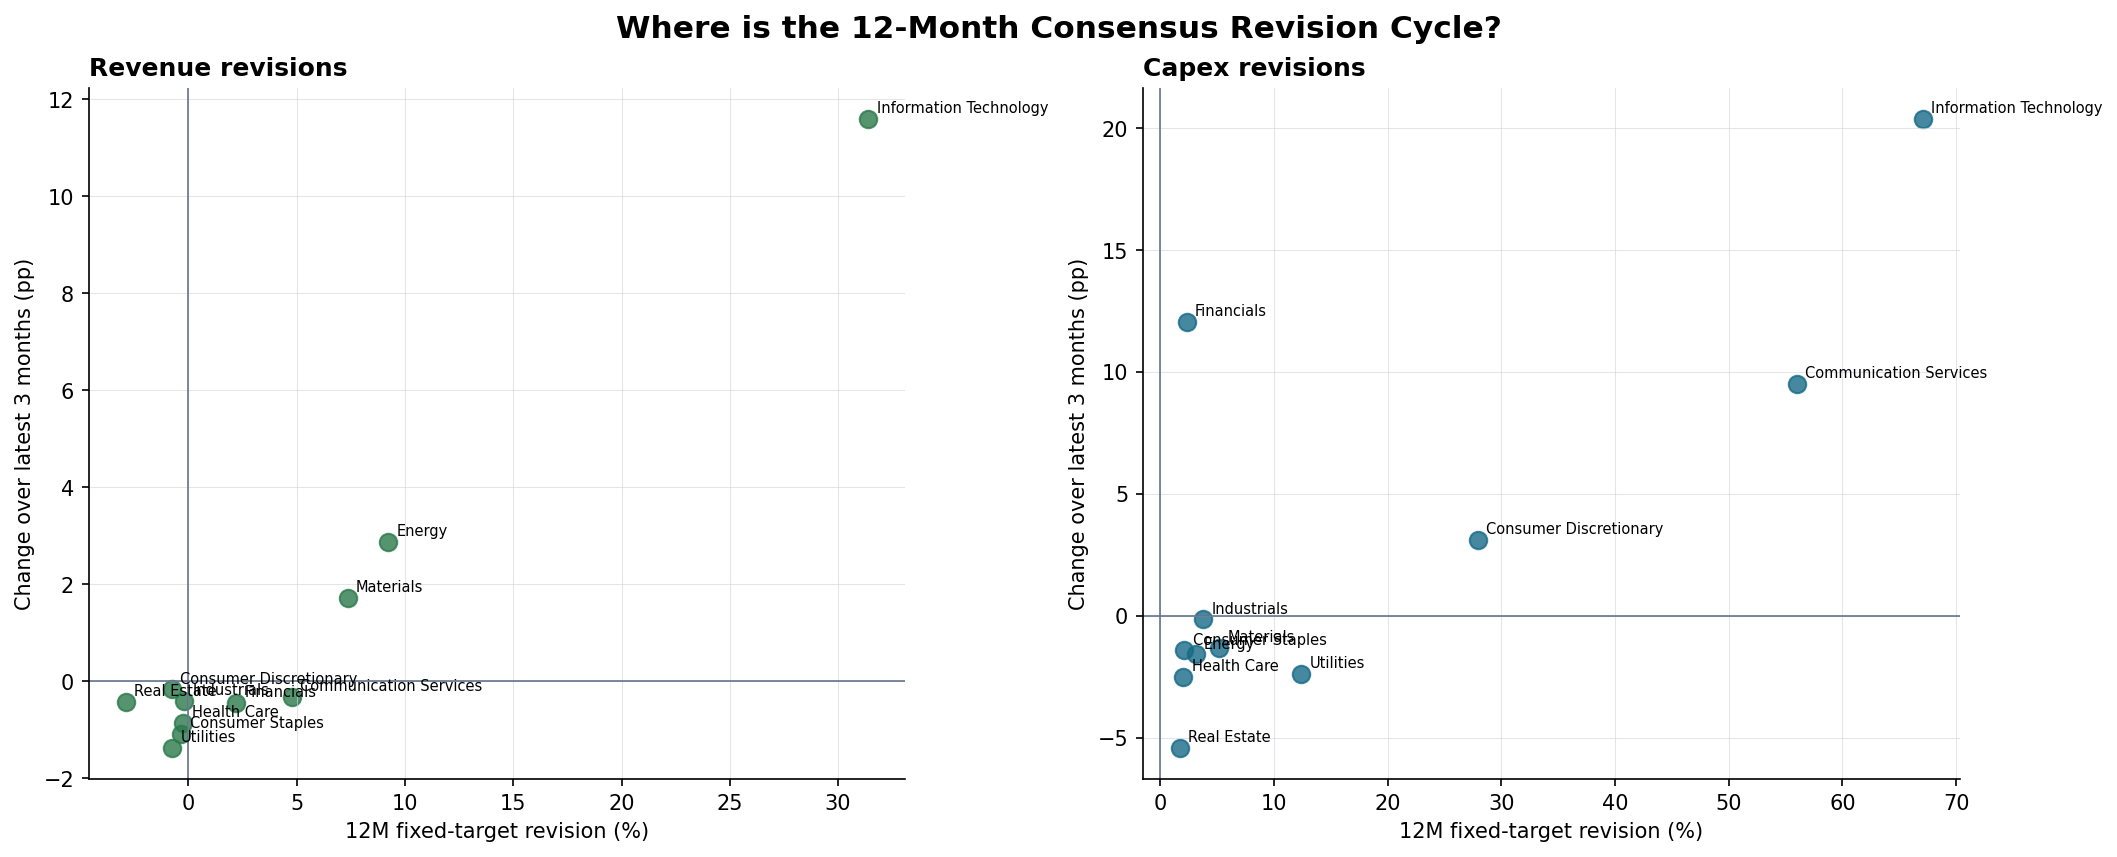
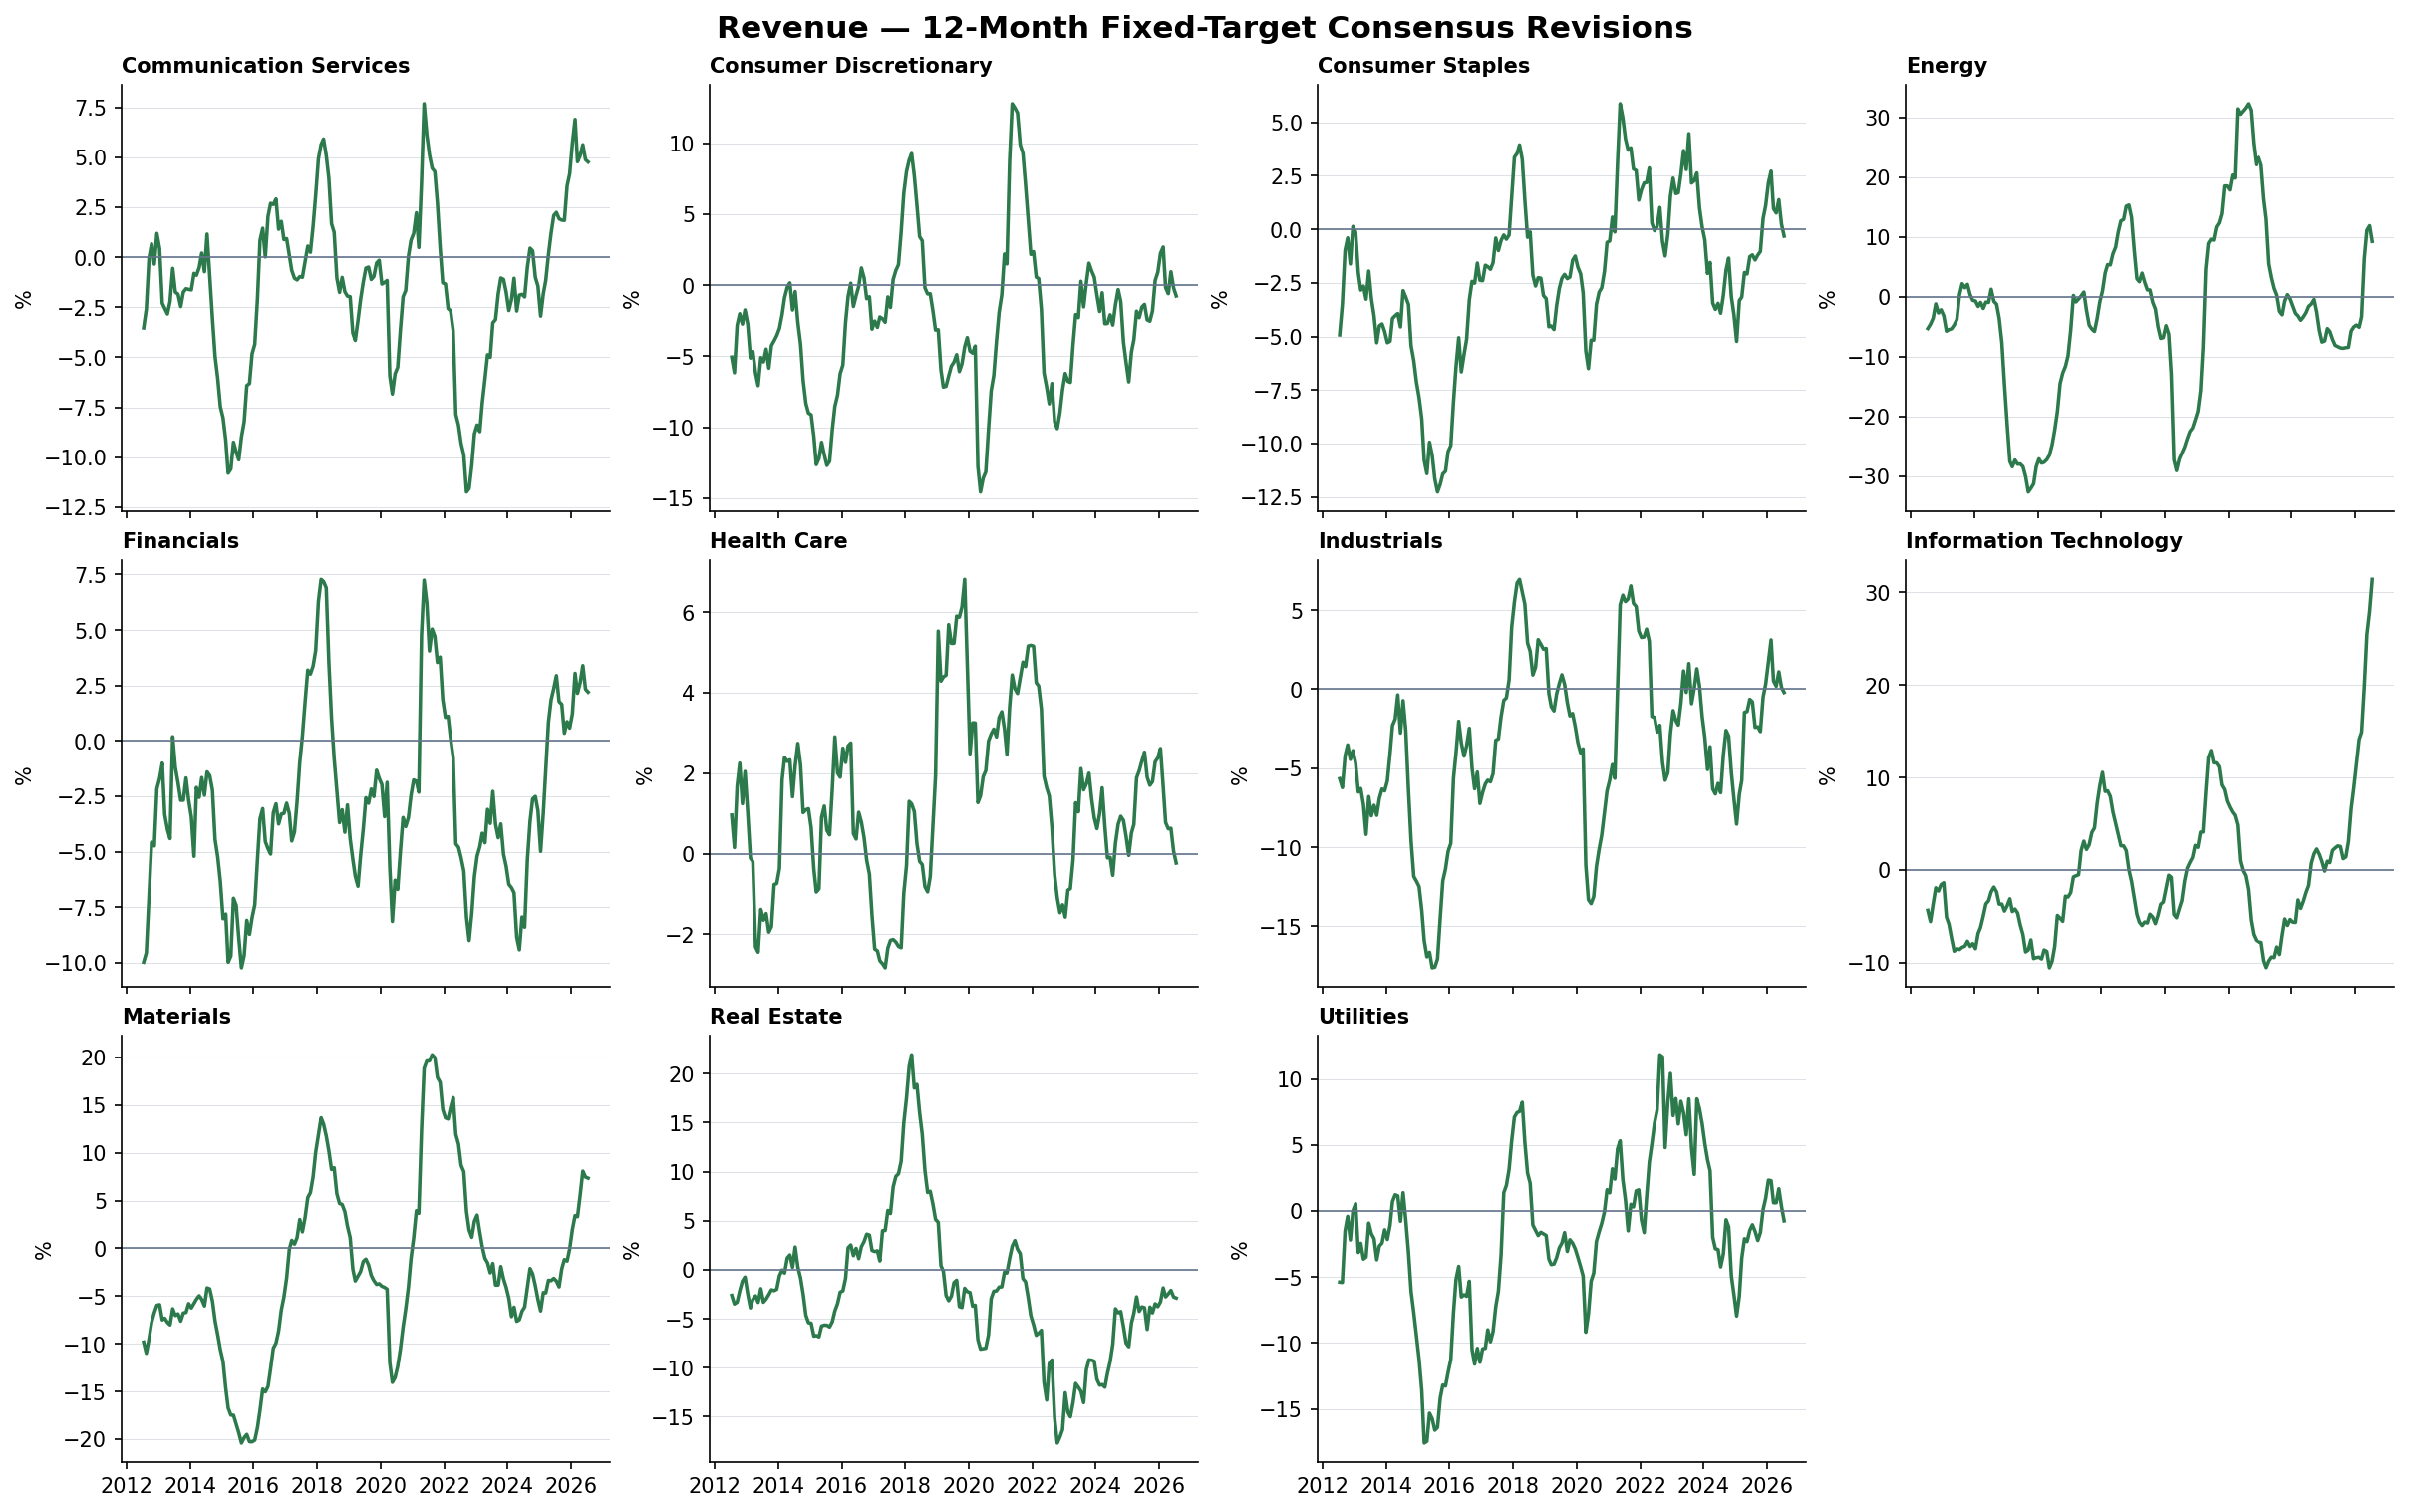
The horizontal coordinate is the current 12-month fixed-target consensus revision. The vertical coordinate is how that 12-month revision signal has changed over the latest three months. Phase labels are a transparent sign-and-slope heuristic, not a forecast.
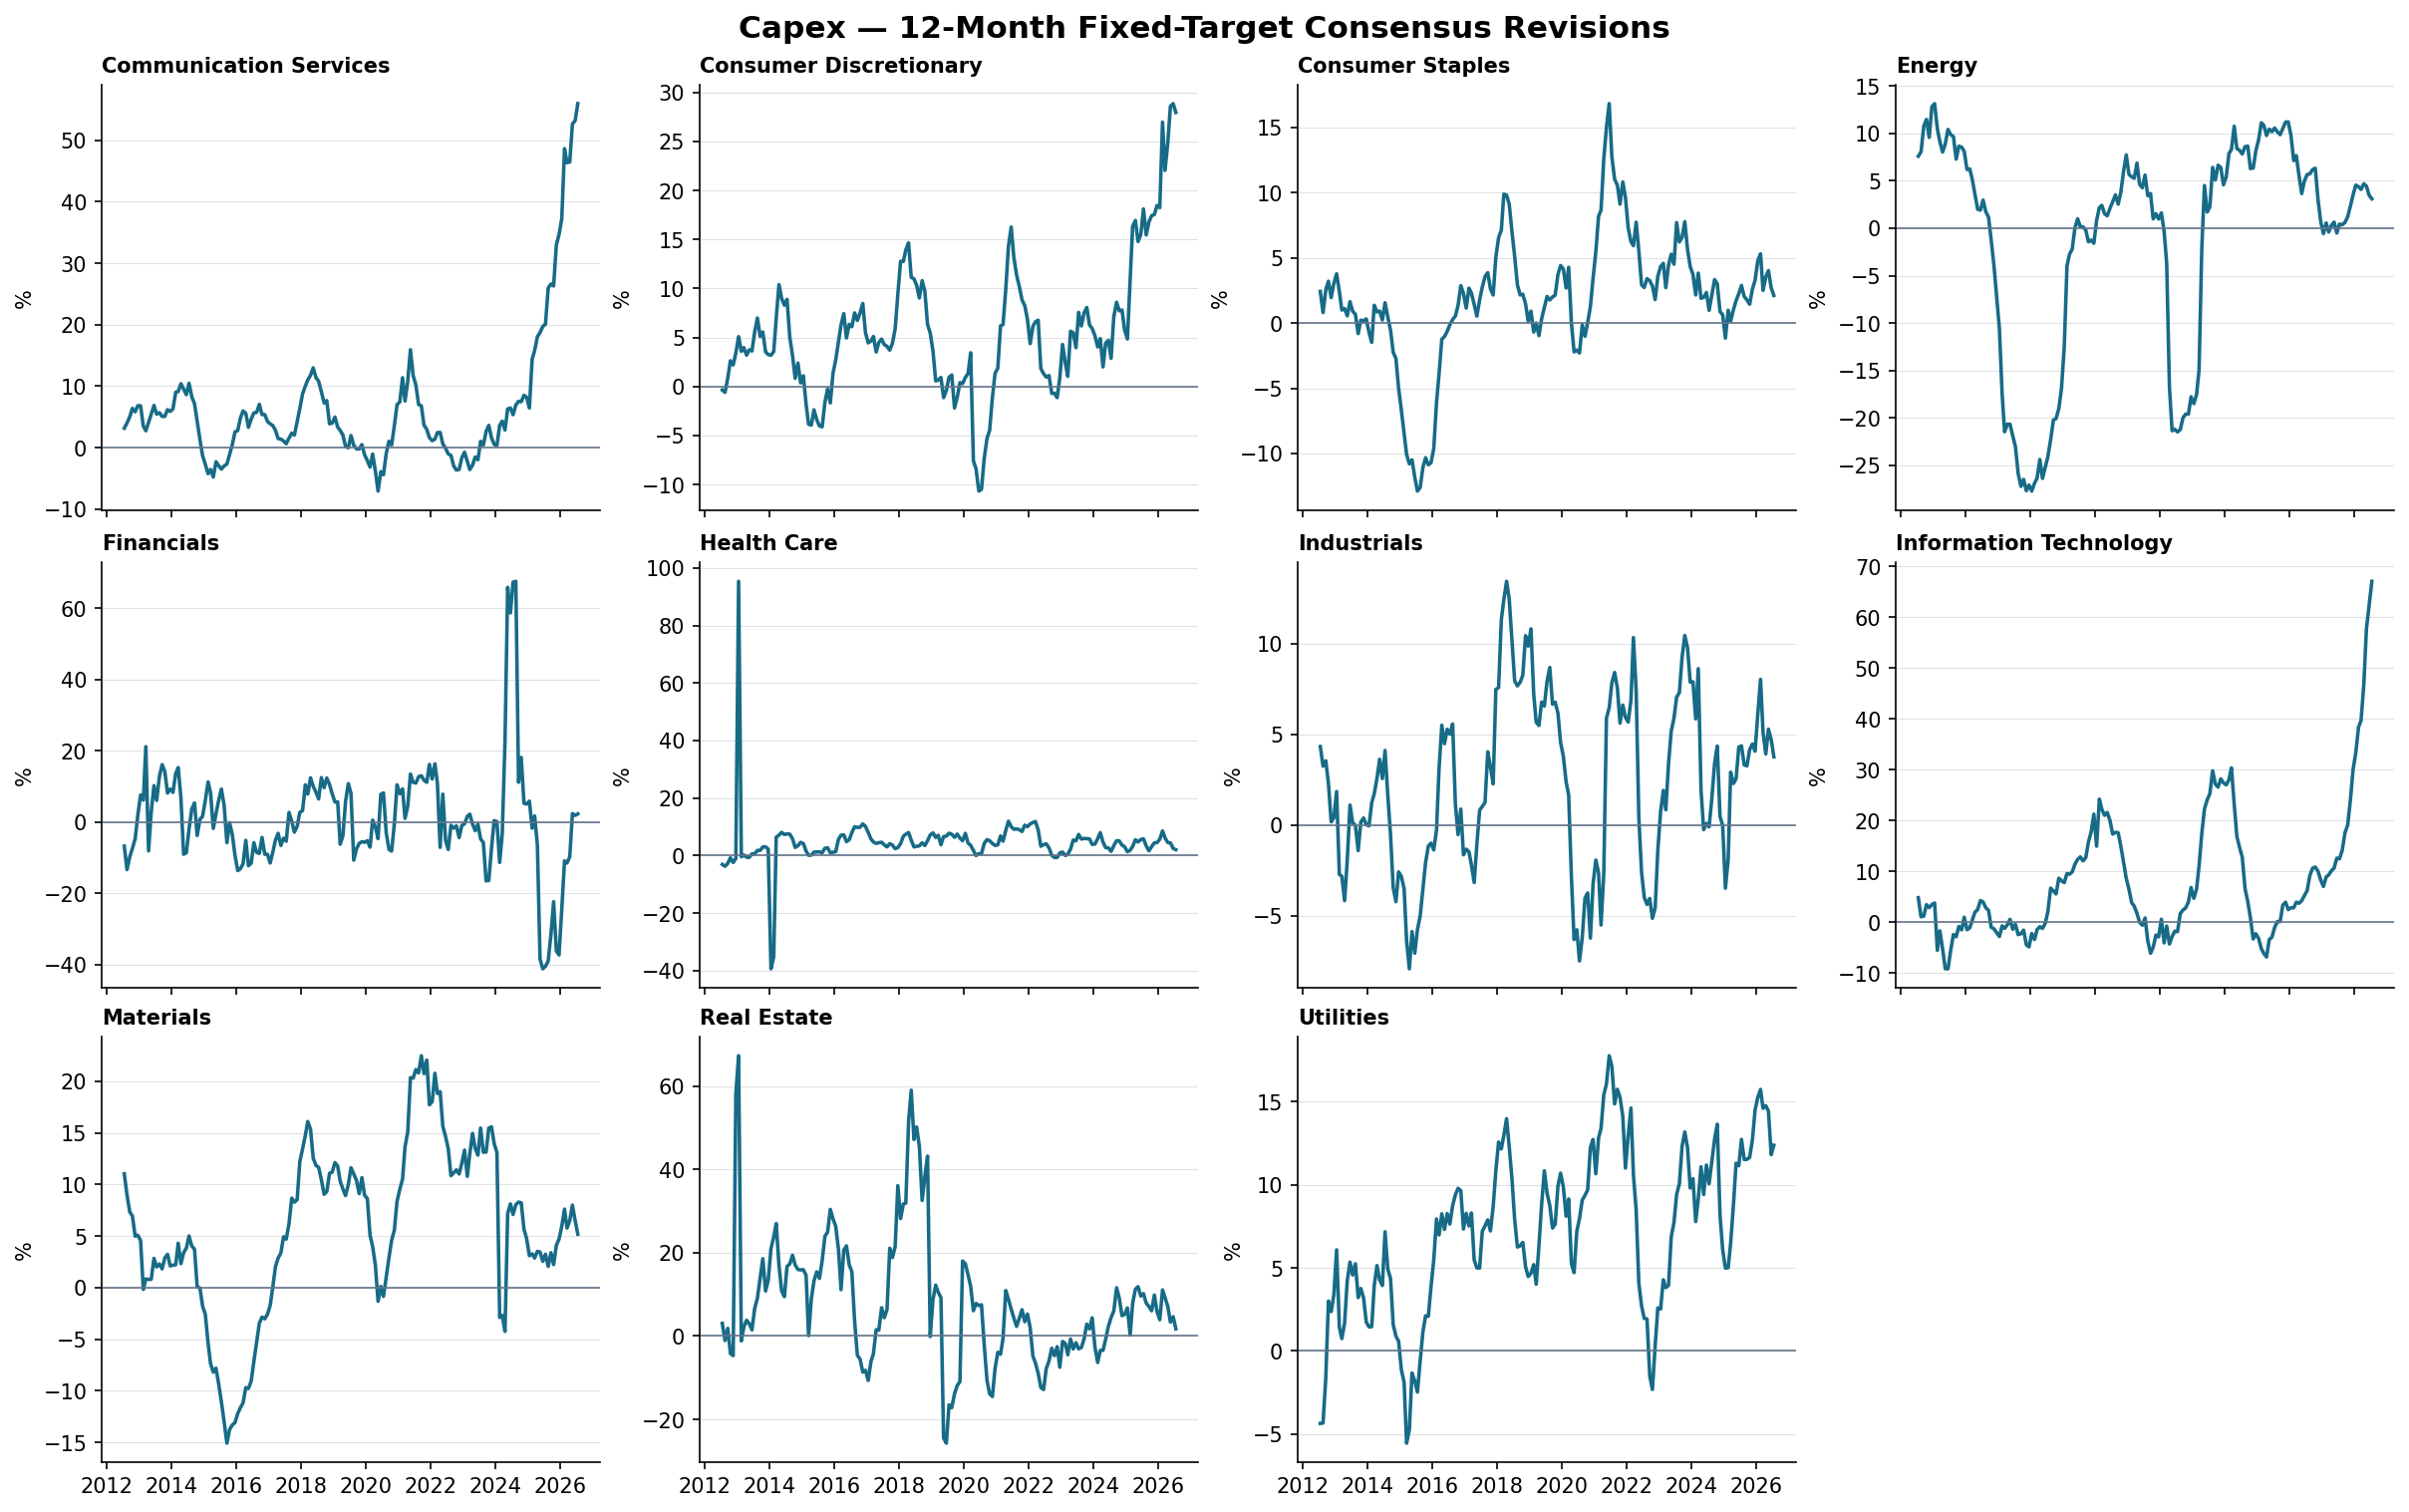
| Metric | Sector | 12M revision | 3M change | Phase | Matched companies |
|---|---|---|---|---|---|
| Capex | Communication Services | 56.0% | +9.5pp | Uptrend — building | 104 |
| Capex | Consumer Discretionary | 28.0% | +3.1pp | Uptrend — building | 193 |
| Capex | Consumer Staples | 2.1% | -1.4pp | Uptrend — maturing | 151 |
| Capex | Energy | 3.1% | -1.6pp | Uptrend — maturing | 85 |
| Capex | Financials | 2.3% | +12.1pp | Upturn — early | 108 |
| Capex | Health Care | 2.0% | -2.5pp | Uptrend — maturing | 162 |
| Capex | Industrials | 3.8% | -0.2pp | Positive — stable | 349 |
| Capex | Information Technology | 67.0% | +20.4pp | Uptrend — building | 245 |
| Capex | Materials | 5.2% | -1.3pp | Uptrend — maturing | 179 |
| Capex | Real Estate | 1.7% | -5.4pp | Uptrend — maturing | 85 |
| Capex | Utilities | 12.4% | -2.4pp | Uptrend — maturing | 125 |
| Revenue | Communication Services | 4.8% | -0.3pp | Uptrend — maturing | 105 |
| Revenue | Consumer Discretionary | -0.8% | -0.2pp | Negative — stable | 193 |
| Revenue | Consumer Staples | -0.3% | -1.1pp | Downturn — early | 154 |
| Revenue | Energy | 9.2% | +2.9pp | Uptrend — building | 88 |
| Revenue | Financials | 2.2% | -0.4pp | Uptrend — maturing | 391 |
| Revenue | Health Care | -0.2% | -0.9pp | Downturn — early | 165 |
| Revenue | Industrials | -0.2% | -0.4pp | Downturn — early | 357 |
| Revenue | Information Technology | 31.4% | +11.6pp | Uptrend — building | 249 |
| Revenue | Materials | 7.3% | +1.7pp | Uptrend — building | 186 |
| Revenue | Real Estate | -2.9% | -0.4pp | Downtrend — deepening | 87 |
| Revenue | Utilities | -0.8% | -1.4pp | Downturn — early | 126 |
6. Reported nowcast vs. consensus forecast
Reported nowcast is endpoint-aligned same-company aggregate LTM growth. The forecast is the same companies' consensus 2-Year Forward CAGR, (24M / 0M)^(1/2) − 1. ACWI coverage uses the full point-in-time member-company denominator; reported-subset coverage is shown separately.
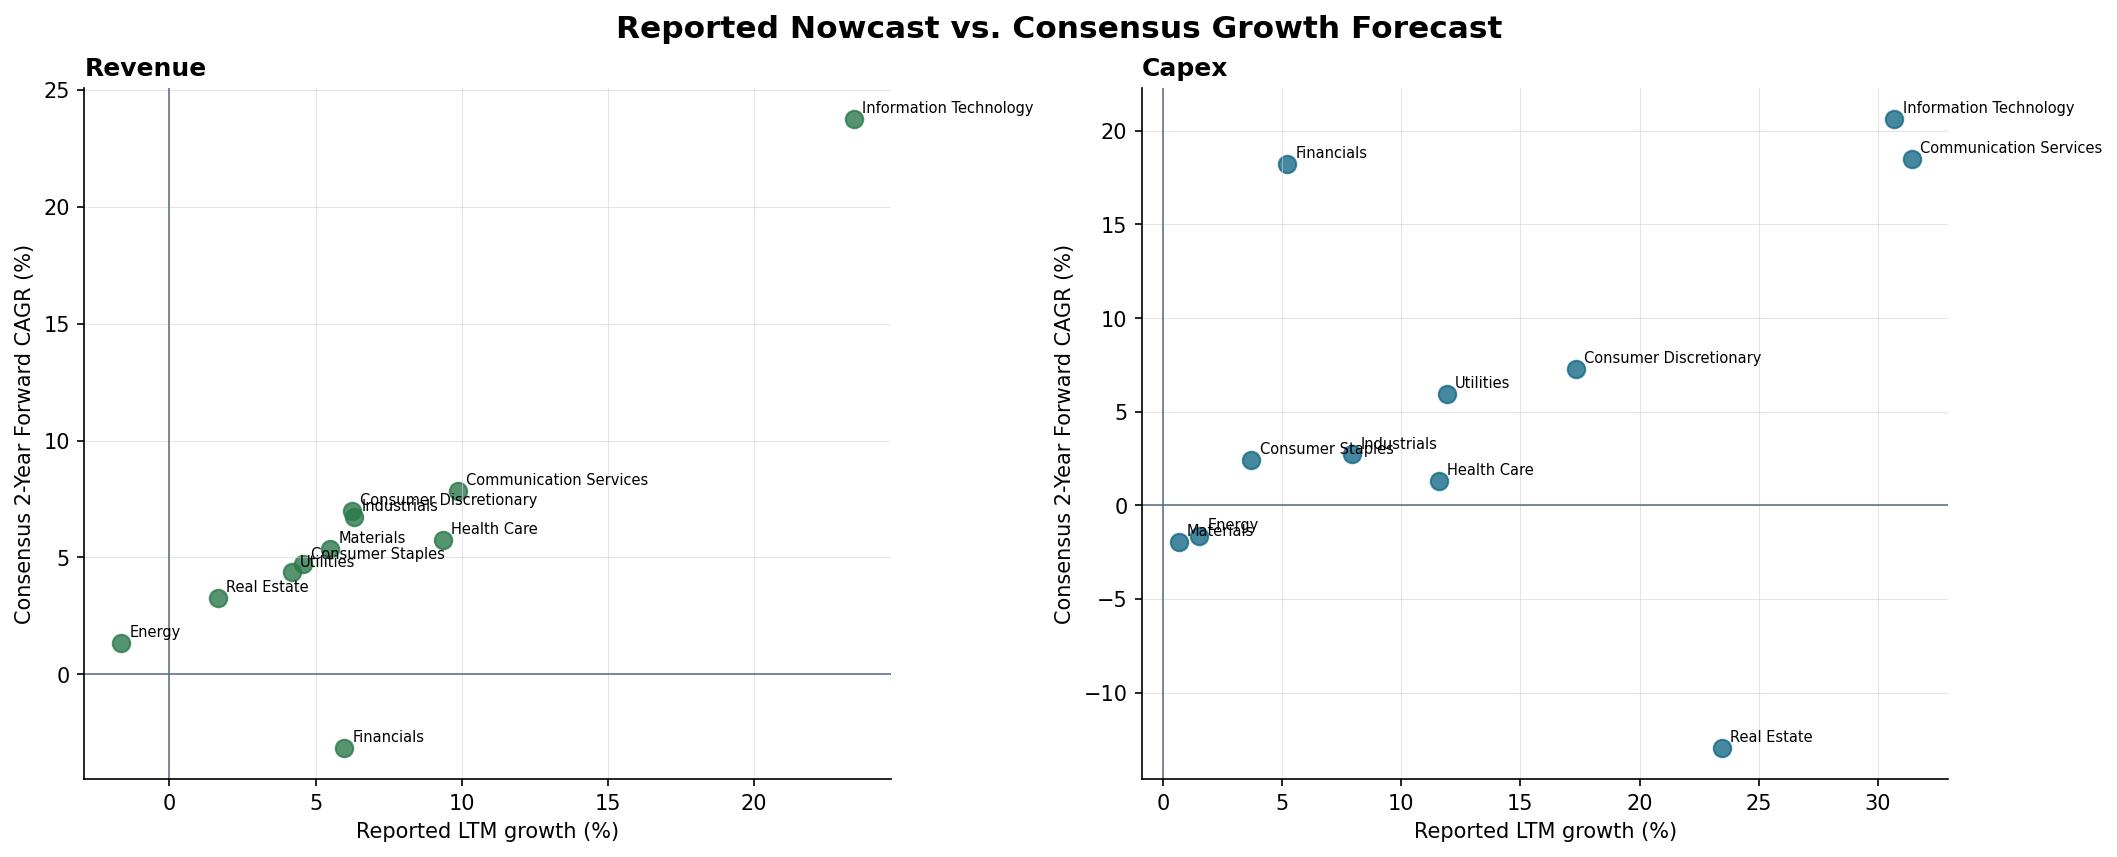
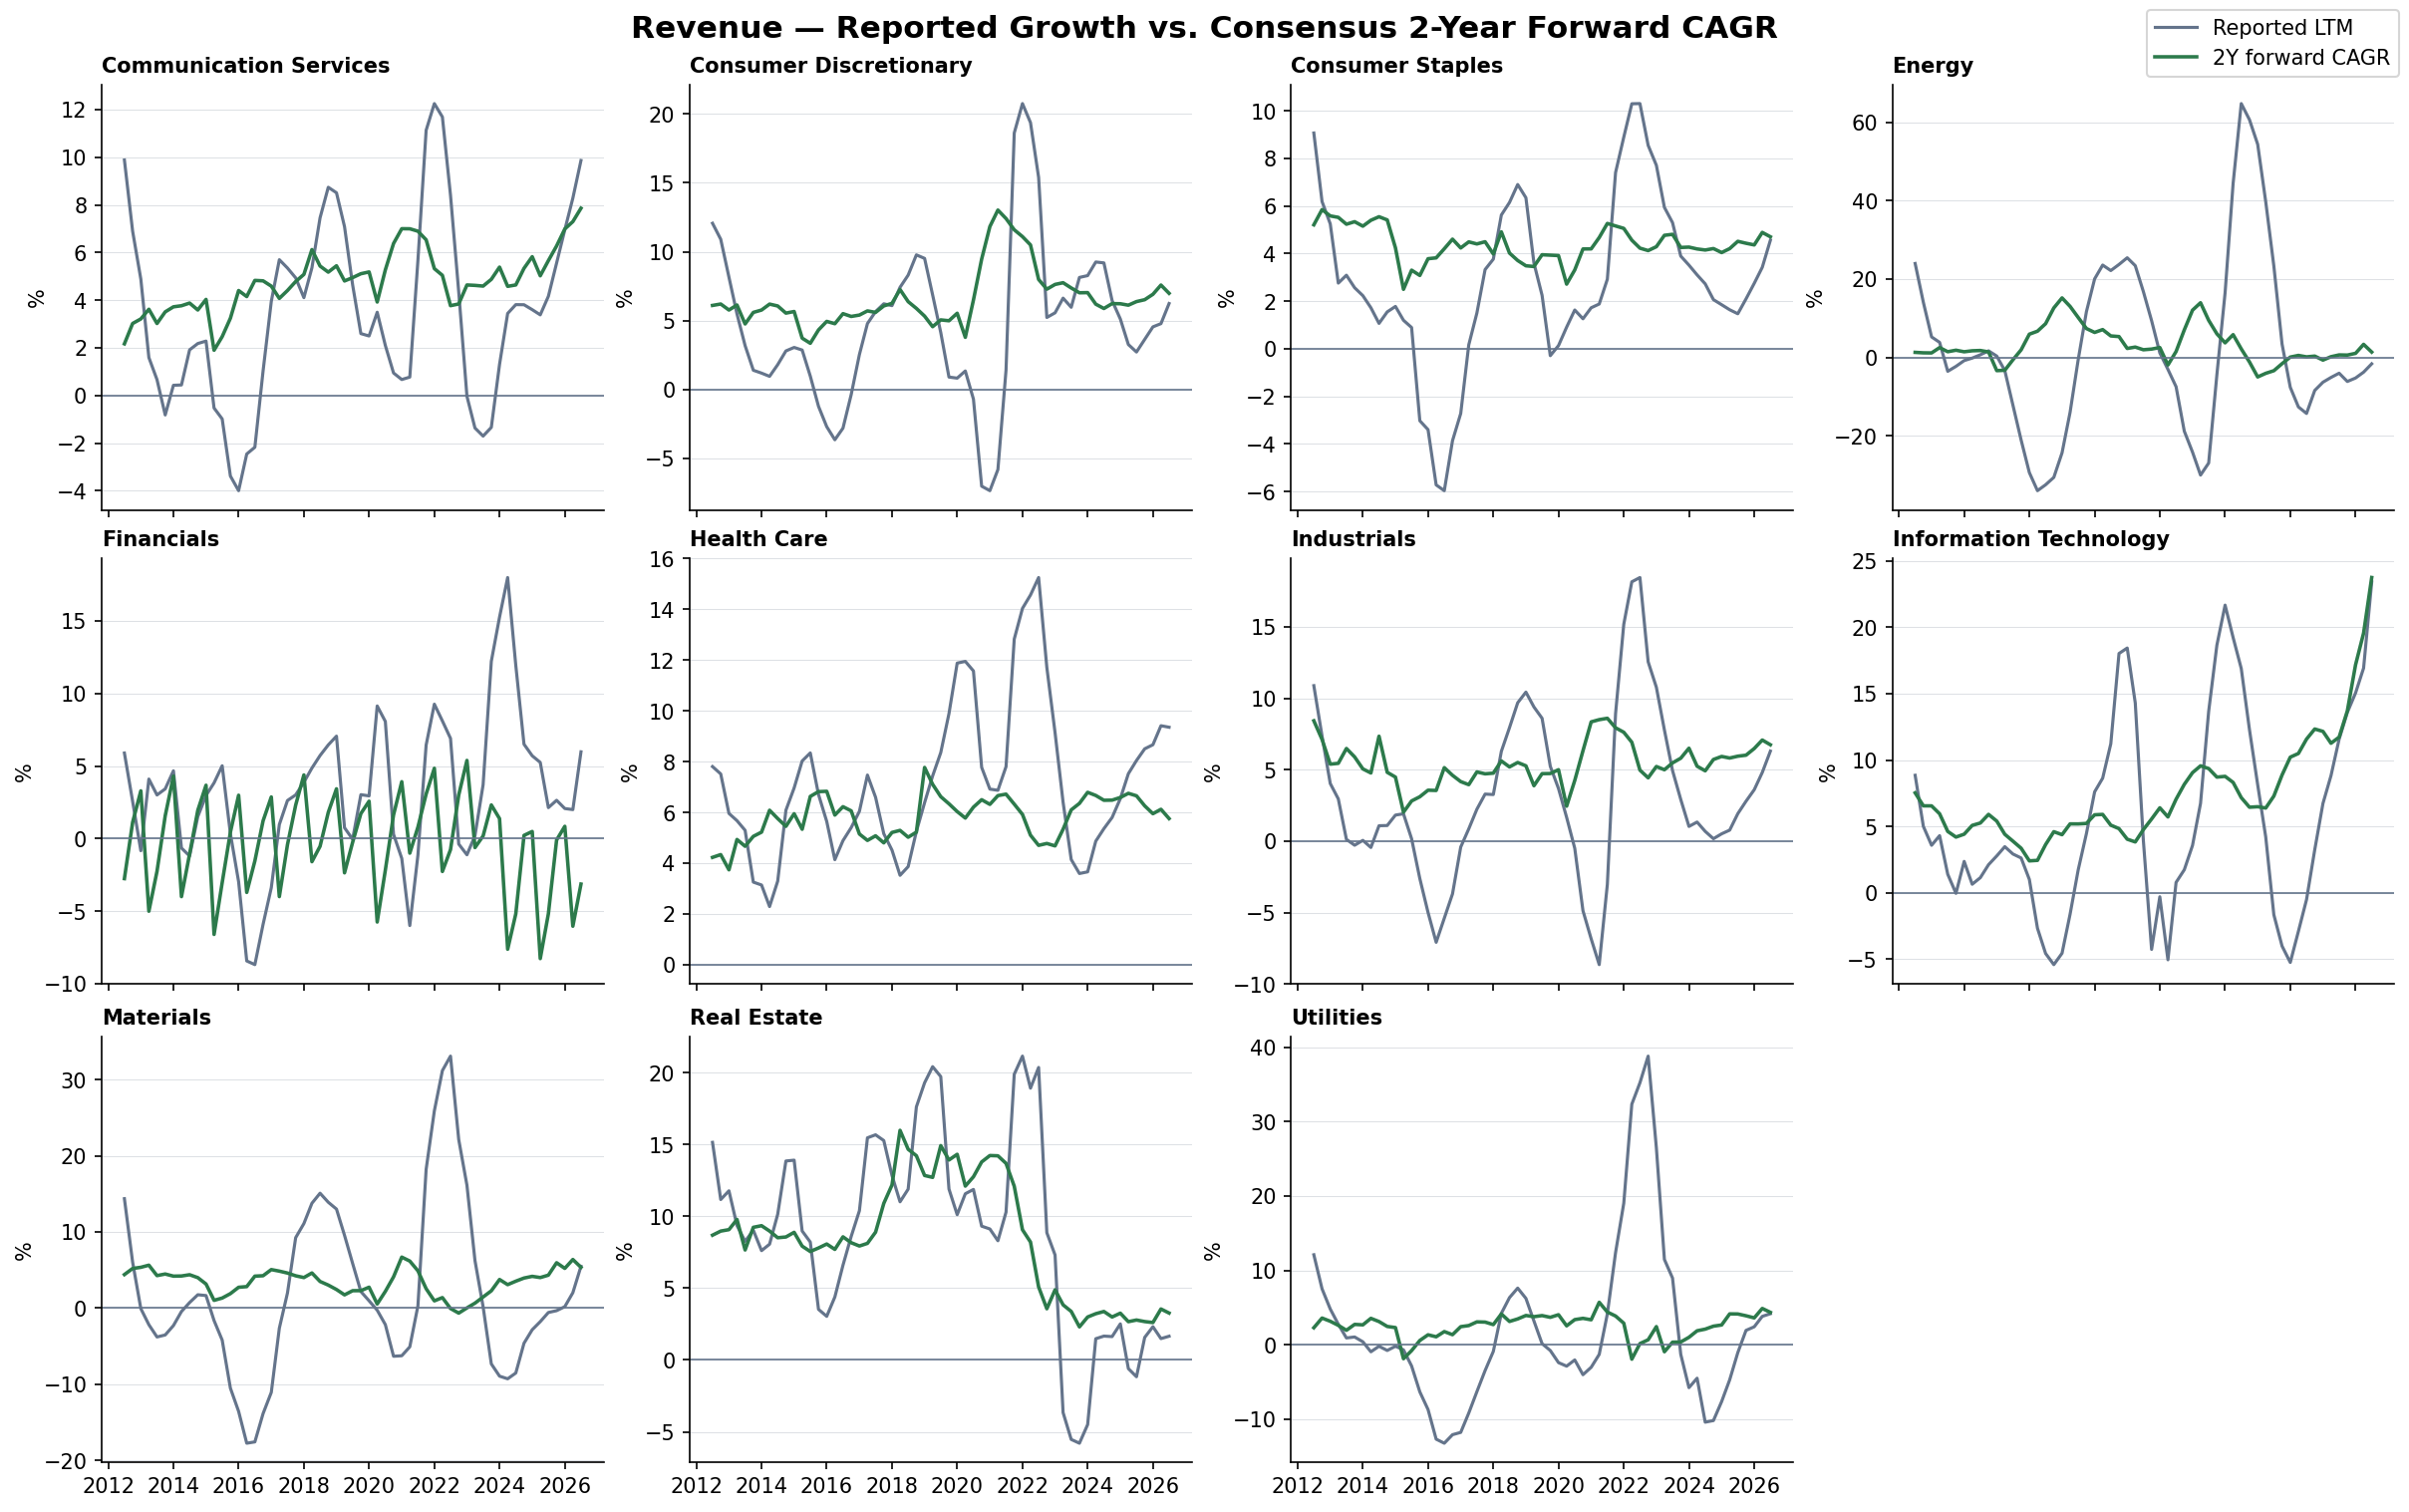
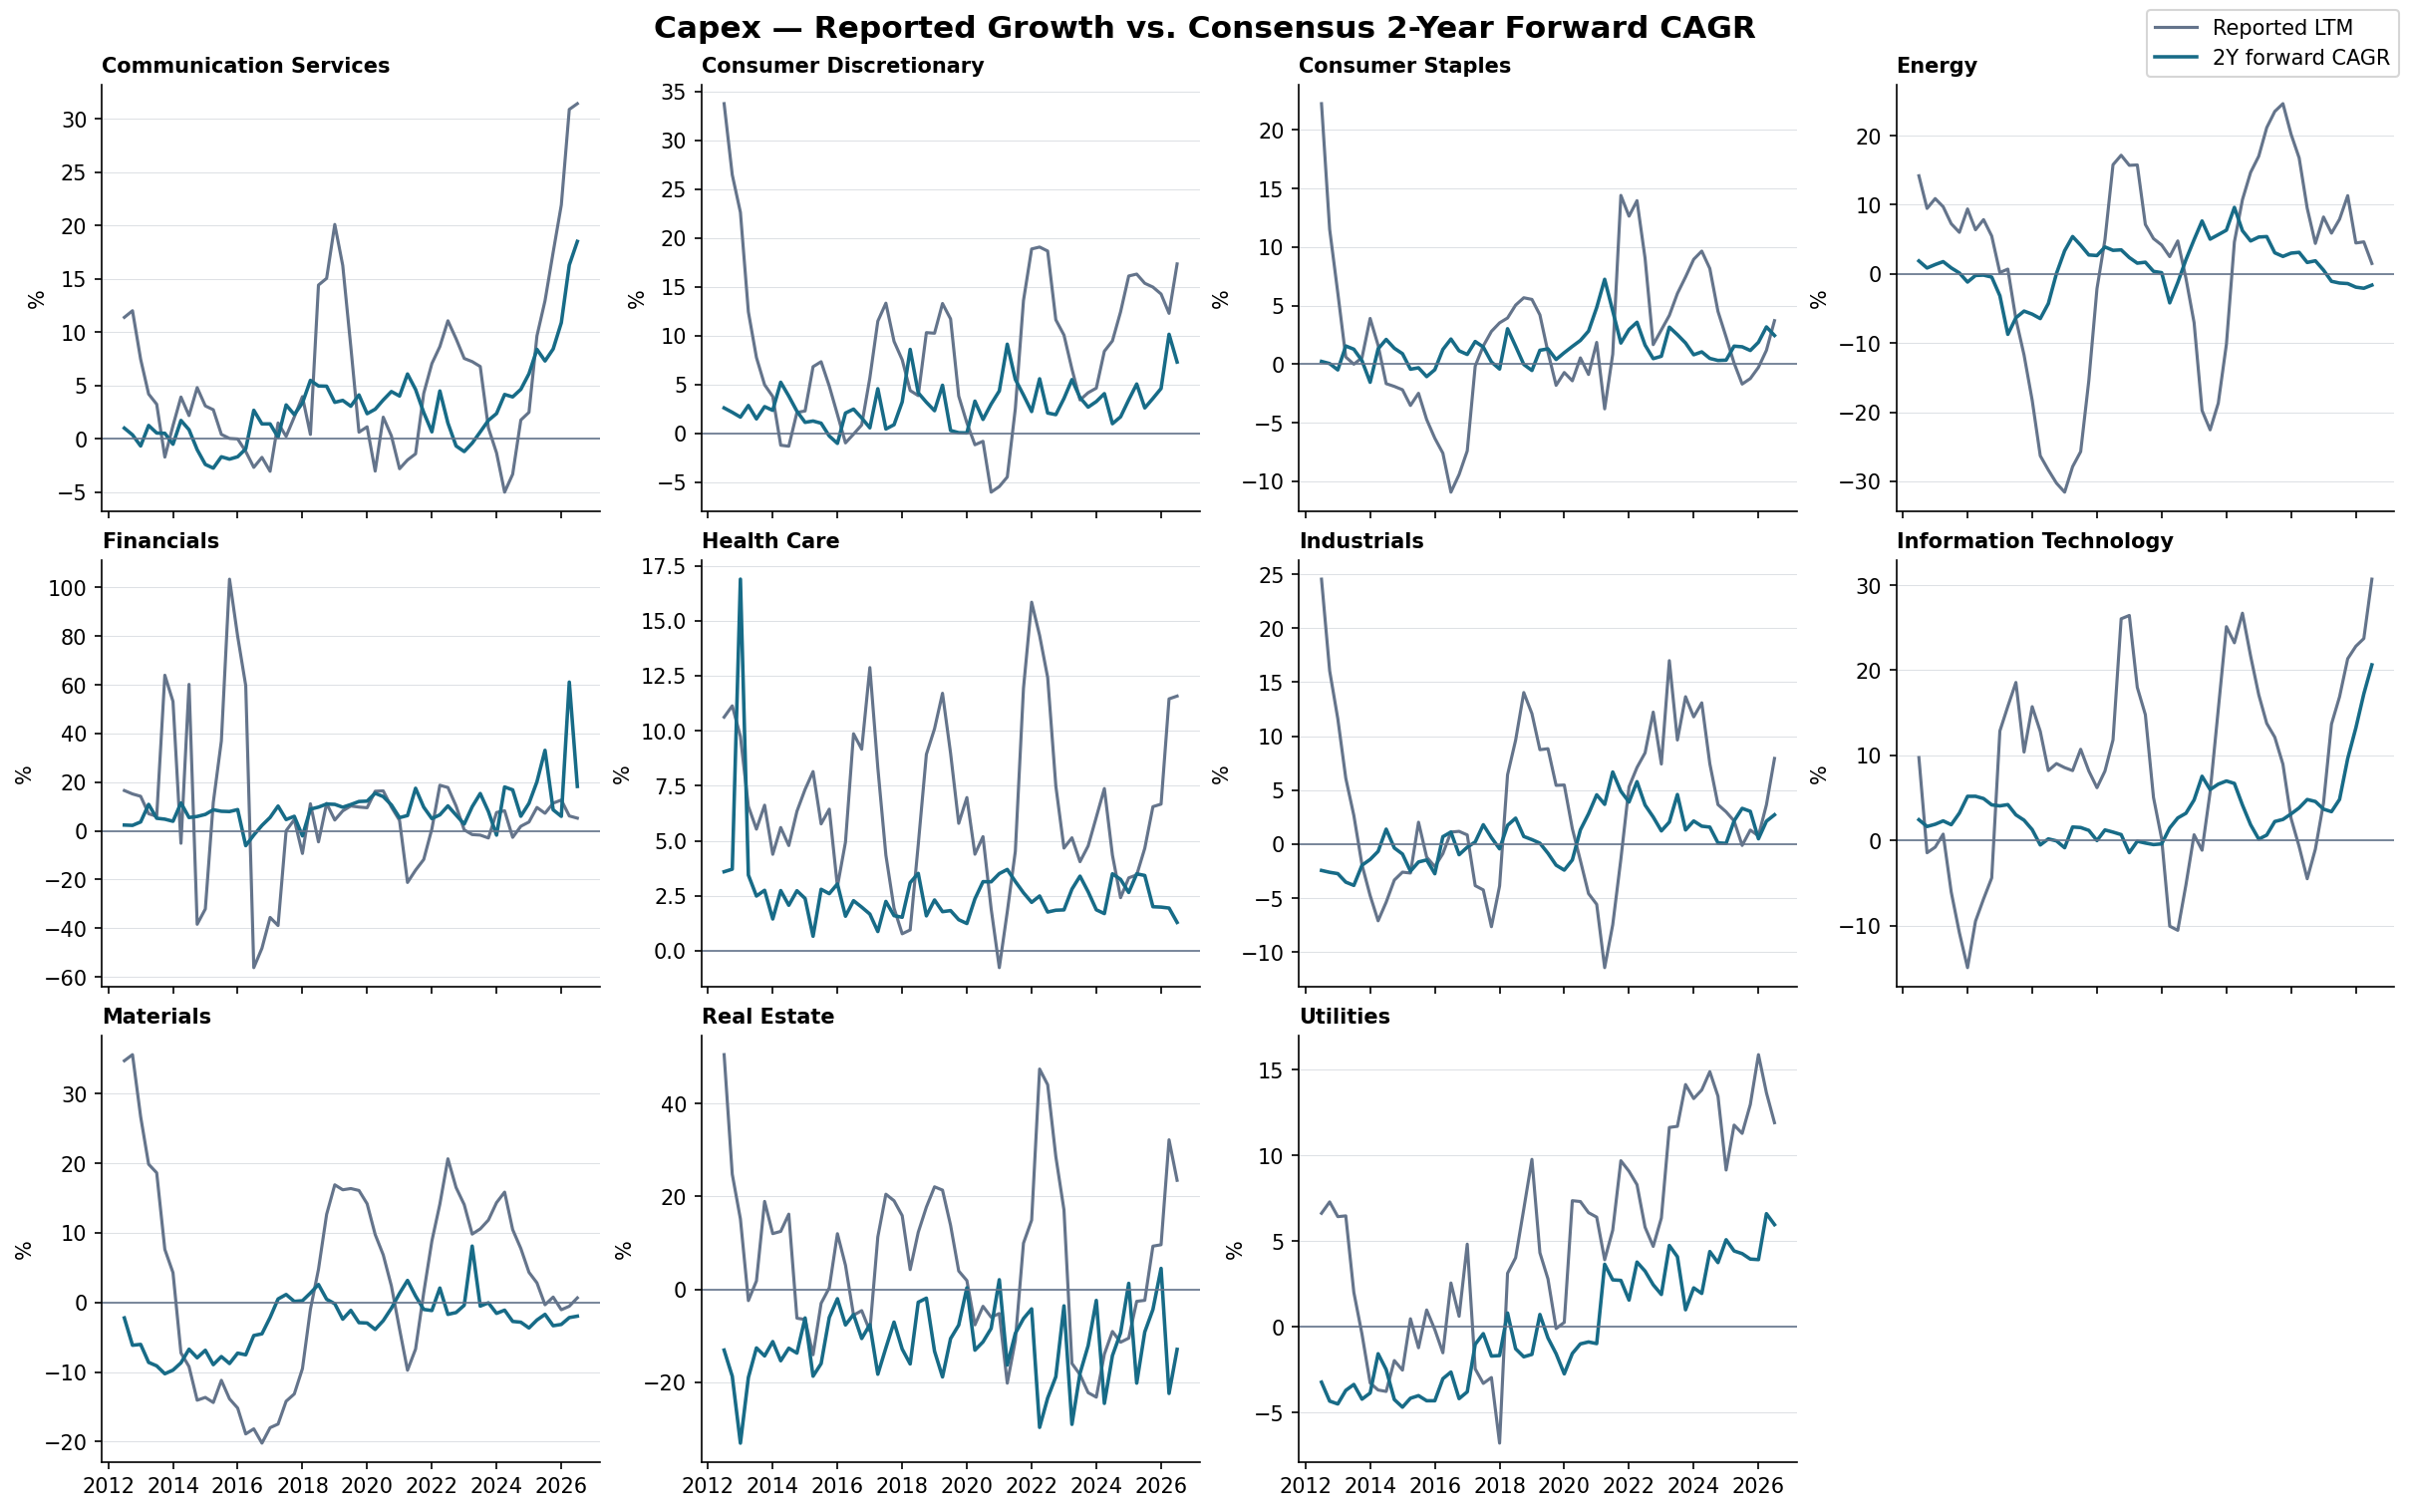
| Metric | Sector | Reported LTM | 2Y forward CAGR | Forward minus reported | Common companies | ACWI coverage | Reported-subset coverage |
|---|---|---|---|---|---|---|---|
| Capex | Communication Services | 31.4% | 18.5% | -12.9pp | 88 | 76% | 99% |
| Capex | Consumer Discretionary | 17.3% | 7.3% | -10.0pp | 174 | 81% | 94% |
| Capex | Consumer Staples | 3.7% | 2.4% | -1.3pp | 143 | 90% | 98% |
| Capex | Energy | 1.5% | -1.6% | -3.1pp | 82 | 89% | 98% |
| Capex | Financials | 5.2% | 18.2% | +13.0pp | 86 | 19% | 28% |
| Capex | Health Care | 11.6% | 1.3% | -10.3pp | 156 | 85% | 98% |
| Capex | Industrials | 7.9% | 2.7% | -5.2pp | 333 | 81% | 96% |
| Capex | Information Technology | 30.7% | 20.6% | -10.1pp | 239 | 74% | 96% |
| Capex | Materials | 0.7% | -2.0% | -2.6pp | 178 | 81% | 98% |
| Capex | Real Estate | 23.5% | -12.9% | -36.4pp | 78 | 86% | 94% |
| Capex | Utilities | 11.9% | 6.0% | -5.9pp | 122 | 93% | 98% |
| Revenue | Communication Services | 9.9% | 7.9% | -2.0pp | 102 | 88% | 99% |
| Revenue | Consumer Discretionary | 6.2% | 7.0% | +0.7pp | 194 | 91% | 97% |
| Revenue | Consumer Staples | 4.6% | 4.7% | +0.1pp | 146 | 92% | 99% |
| Revenue | Energy | -1.7% | 1.3% | +3.0pp | 85 | 92% | 99% |
| Revenue | Financials | 6.0% | -3.1% | -9.1pp | 372 | 82% | 94% |
| Revenue | Health Care | 9.4% | 5.8% | -3.6pp | 161 | 88% | 98% |
| Revenue | Industrials | 6.3% | 6.7% | +0.4pp | 352 | 86% | 98% |
| Revenue | Information Technology | 23.4% | 23.8% | +0.3pp | 248 | 77% | 98% |
| Revenue | Materials | 5.5% | 5.4% | -0.1pp | 180 | 82% | 99% |
| Revenue | Real Estate | 1.7% | 3.3% | +1.6pp | 88 | 97% | 98% |
| Revenue | Utilities | 4.2% | 4.4% | +0.2pp | 125 | 95% | 99% |
Methodology
Correlation inputs are quarterly reported LTM YoY growth from Layer 0, calculated from endpoint-aligned aggregate USD dollars. The raw matrix covers 0Q–8Q and all four Revenue/CapEx source-target combinations. Discovery suppresses same-group pairs and 0Q, requires 36 observations and retains one strongest absolute correlation per ordered pair separately within 1Q–4Q and 5Q–8Q. Keeping the windows separate limits horizon mixing and avoids selecting a single winner from an unnecessarily broad 1Q–8Q search. Lead advantage is |forward r| − max(|0Q r|, |reverse-direction r|). Evidence grades add one point each for sample eligibility, |r| ≥ 0.50, lead advantage ≥ 0.05, split-sample stability and persistence after removing static exposure to the matching ACWI ex-Financials cycle. Structural GICS distance is displayed as novelty and never raises the evidence grade. Relationship priors specify type, sign, lag and confidence independently of the statistics. Lead-aligned charts display source at t against target at t+lag shifted back to t; standardization is visual only and does not alter the reported correlations. None of these diagnostics establishes causality.
Revision cycles use exact-company fixed-target 12-month revisions. Reported-versus-forward comparisons join actual and consensus panels by stable Bloomberg company ID and observation month. Built 2026-07-17T09:07:53+00:00.