Company Applications
1. Translate disclosed end markets into market baskets
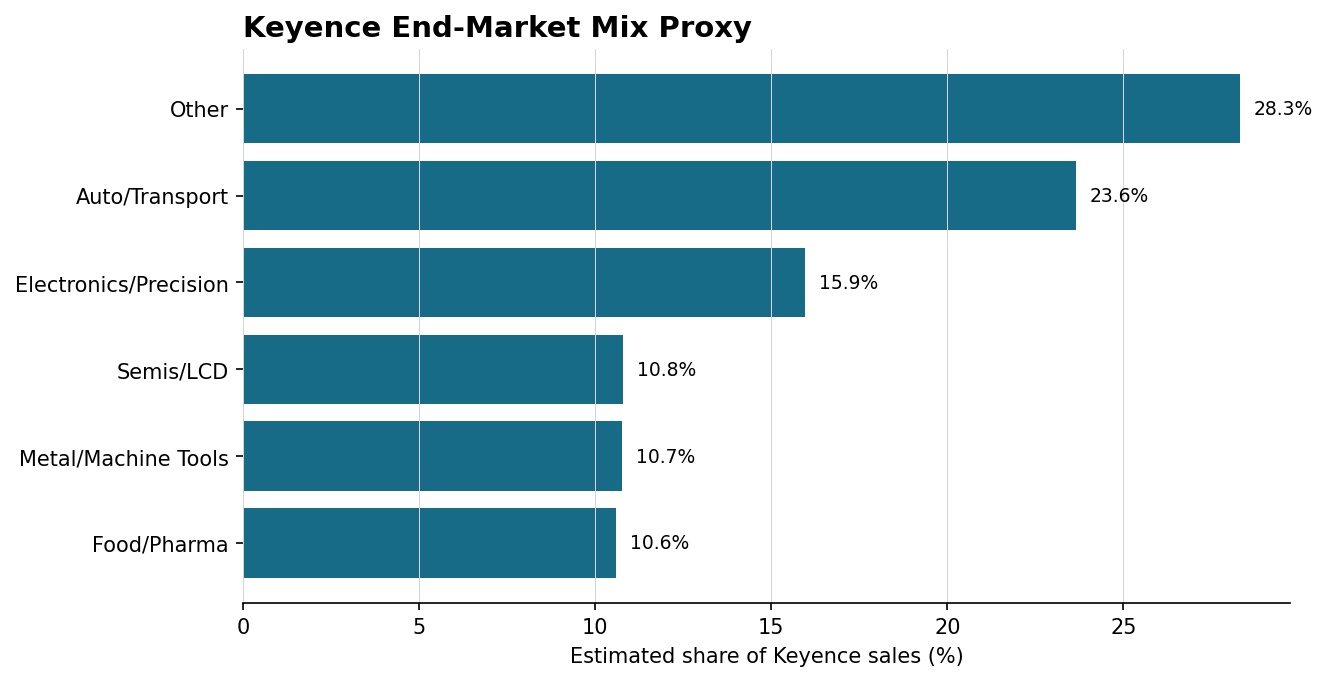
| End market | Estimated weight | GICS level | Proxy group | Composite weight | Method |
|---|---|---|---|---|---|
| Semis/LCD | 10.8% | Industry | Semiconductors & Semiconductor Equipment | 10.8% | Direct GICS Industry proxy |
| Electronics/Precision | 15.9% | Industry | Electronic Equipment, Instruments & Components | 15.9% | Direct GICS Industry proxy |
| Auto/Transport | 23.6% | Industry | Automobiles | 23.6% | Direct GICS Industry proxy |
| Metal/Machine Tools | 10.7% | Industry | Machinery | 10.7% | Direct GICS Industry proxy |
| Food/Pharma | 10.6% | Industry | Food Products | 5.3% | Neutral split because Keyence discloses Food and Pharma together |
| Food/Pharma | 10.6% | Industry | Pharmaceuticals | 5.3% | Neutral split because Keyence discloses Food and Pharma together |
| Other | 28.3% | Total Ex Financials | Global ex Financials | 28.3% | Broad manufacturing fallback for undisclosed Other mix |
Food/Pharma is split 50/50 because Keyence reports it as one bucket. “Other” uses Global ex Financials so the disclosed 28.3% is not silently discarded.
Back to top ↑2. Compare Keyence with its weighted end-demand signal
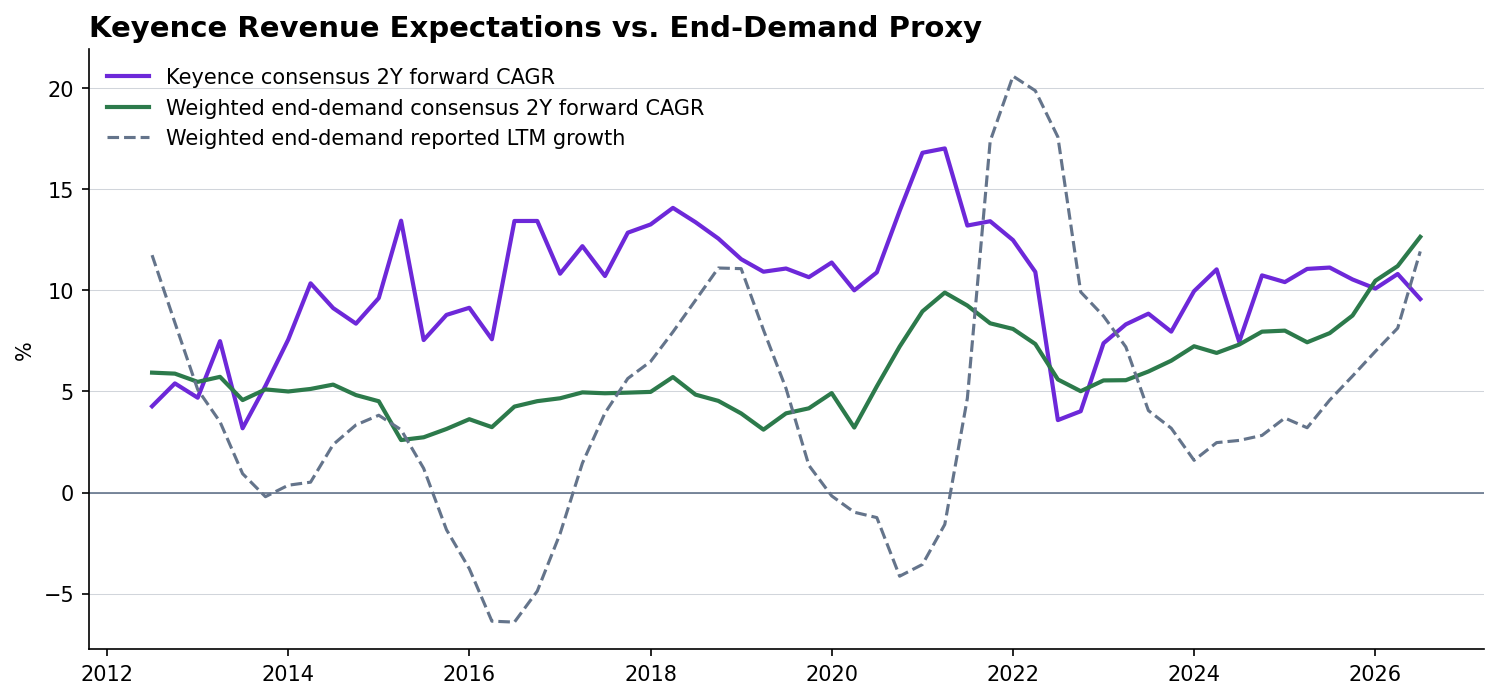
Keyence and the end-demand proxy are separate signals. The proxy is a current-mix weighted average of exact-company Industry growth series; it is not a claim that Industry sales translate one-for-one into Keyence revenue.
Back to top ↑3. Compare customer-industry investment with Keyence's own investment plan
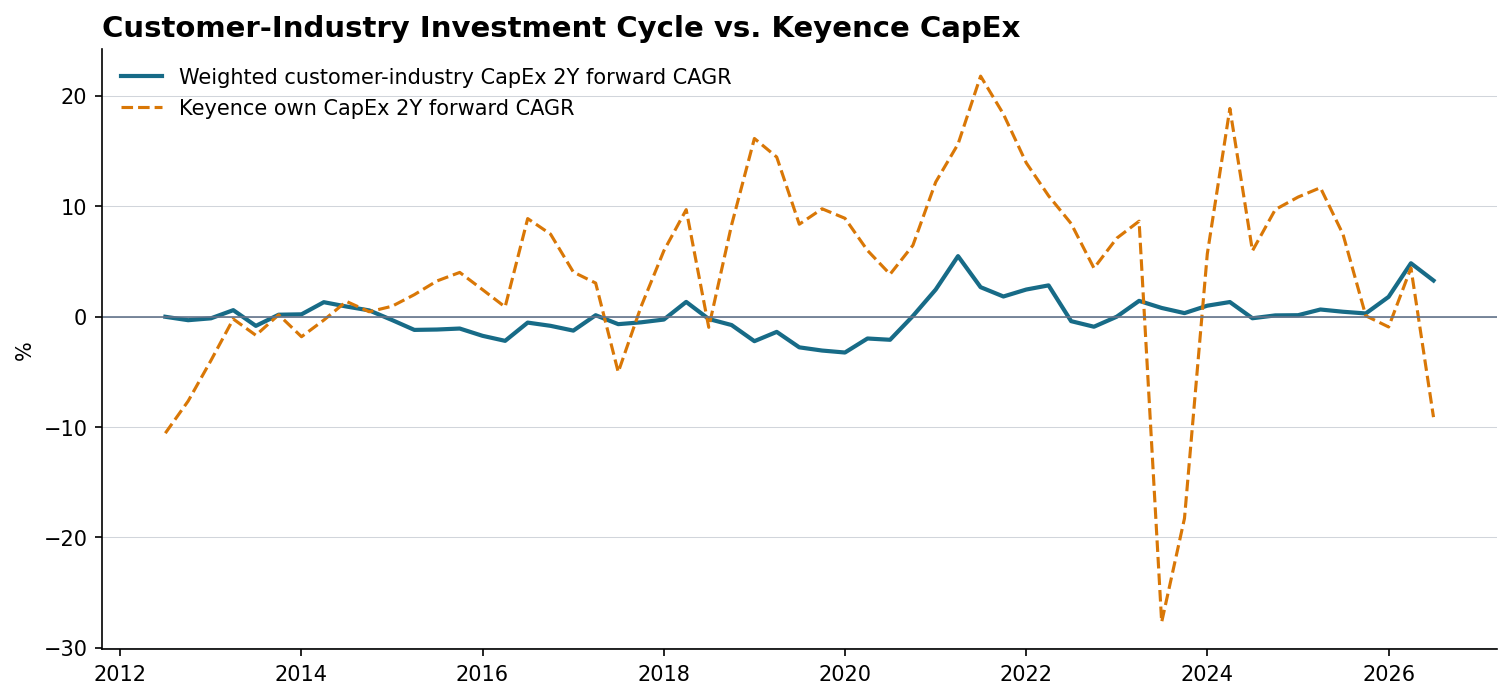
Customer-industry CapEx is the economically relevant demand-cycle proxy. Keyence's own CapEx is shown only as a company diagnostic and can be lumpy for an asset-light business.
Back to top ↑Methodology and limitations
The FY3/26 Keyence Q4 geography mix is combined with its H2 FY3/26 end-market-by-region mix. Resulting end-market weights are mapped to GICS Industries, then applied to Layer 3 reported and consensus growth histories. Keyence's own consensus series uses Bloomberg company ID 113952. All consensus forward growth is (24M / 0M)^(1/2) − 1.
The AS data layer supplies the current company-reported mix and source notes. A true historical mix series is unavailable because this end-market disclosure is new; future reports can be appended prospectively. Built 2026-07-17T07:10:49+00:00.