Methodology At A Glance
Canonical QV ranks companies on a 50% Quality Composite and 50% Value Composite. Quality rewards strong forward FY2 ROE versus the benchmark and sector peers, plus positive own-history ROE momentum. Value rewards cheaper relative P/E and EV/EBIT versus the index and sector.
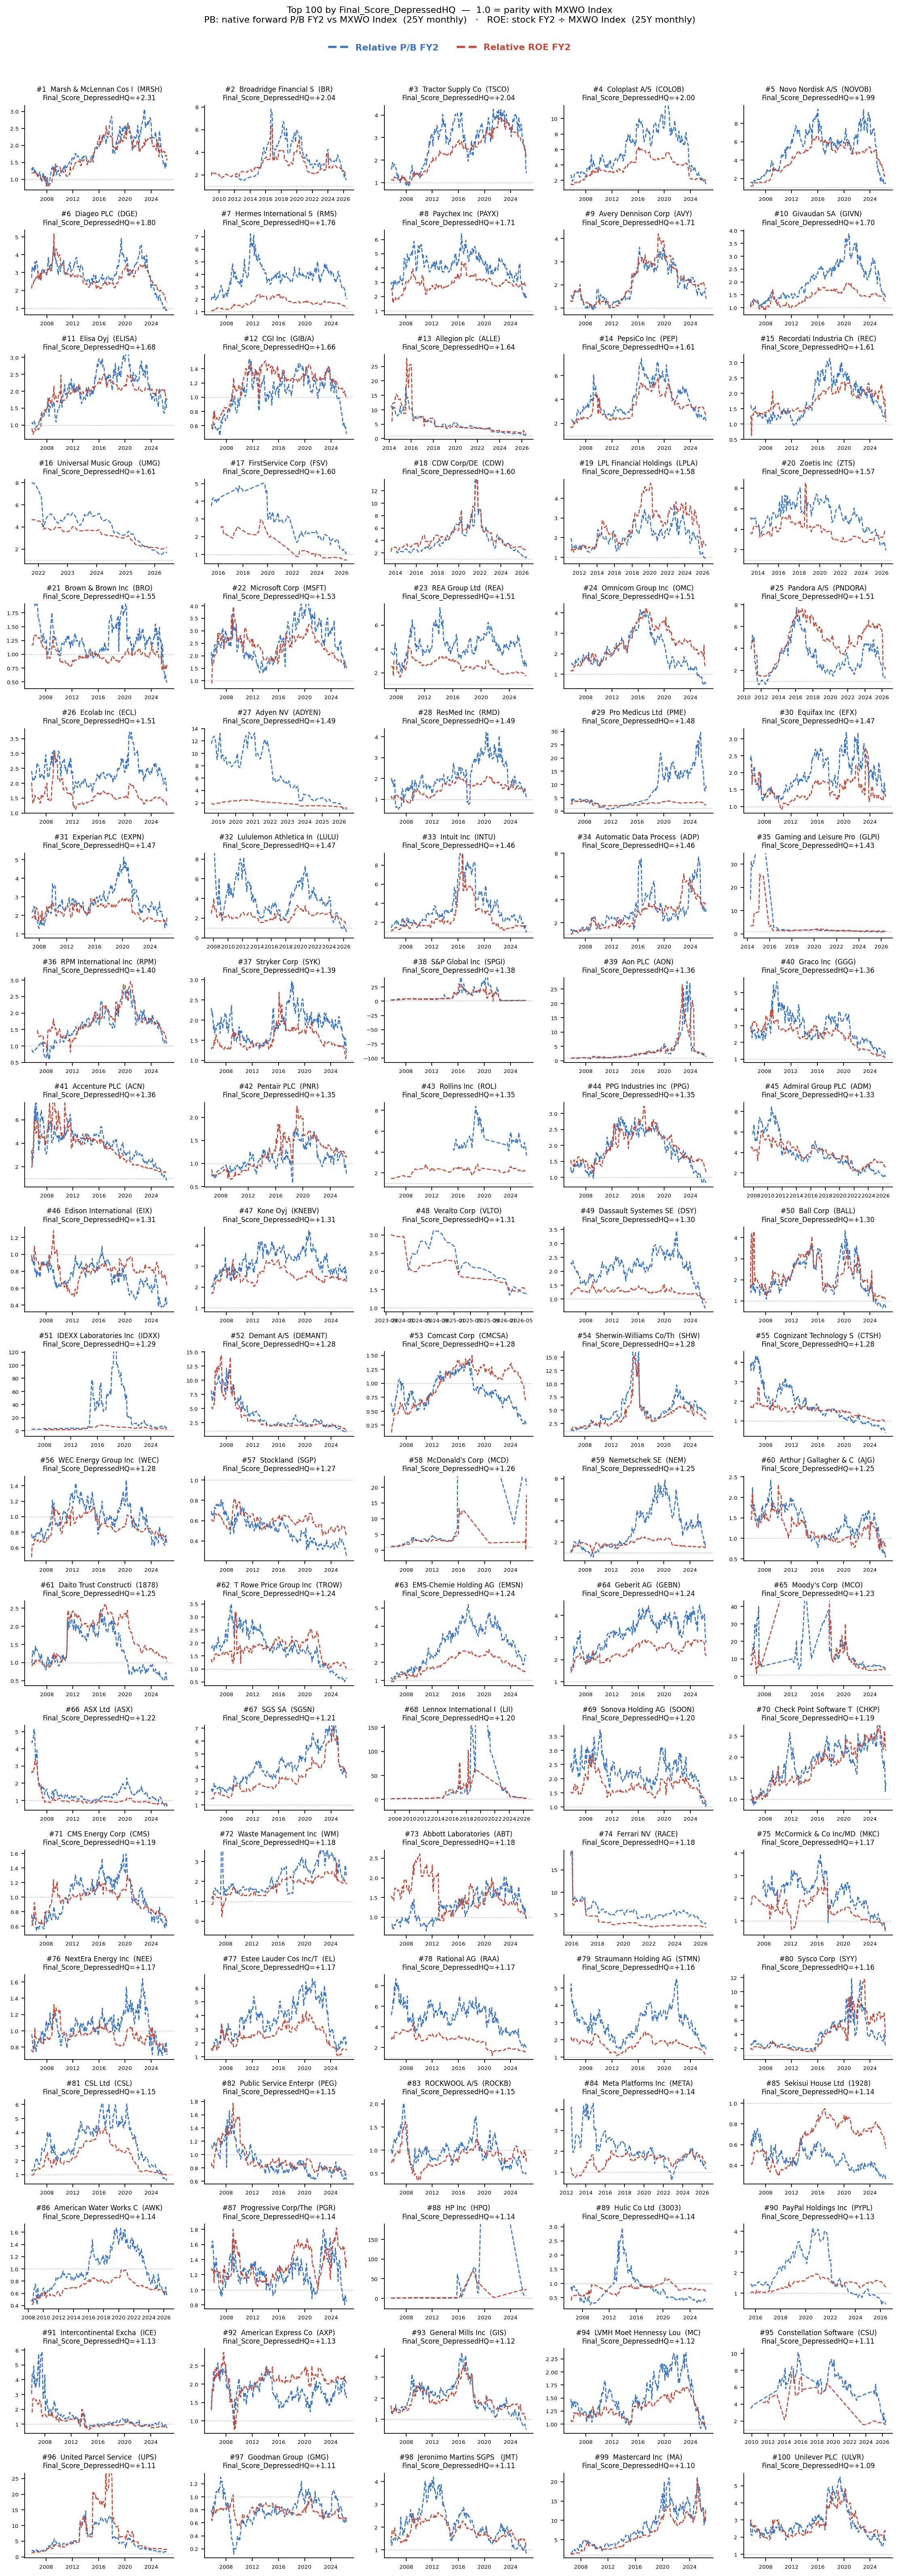
Depressed HQ uses the same Value Composite, but replaces the quality momentum lens with a contrarian one: high-quality companies whose relative ROE is below their own 10-year norm. It is intended to surface cheap quality names with potential for recovery.
Top 100 Sector Mix
Canonical QV
Depressed HQ
Top 100 Country Mix
Canonical QV
Depressed HQ
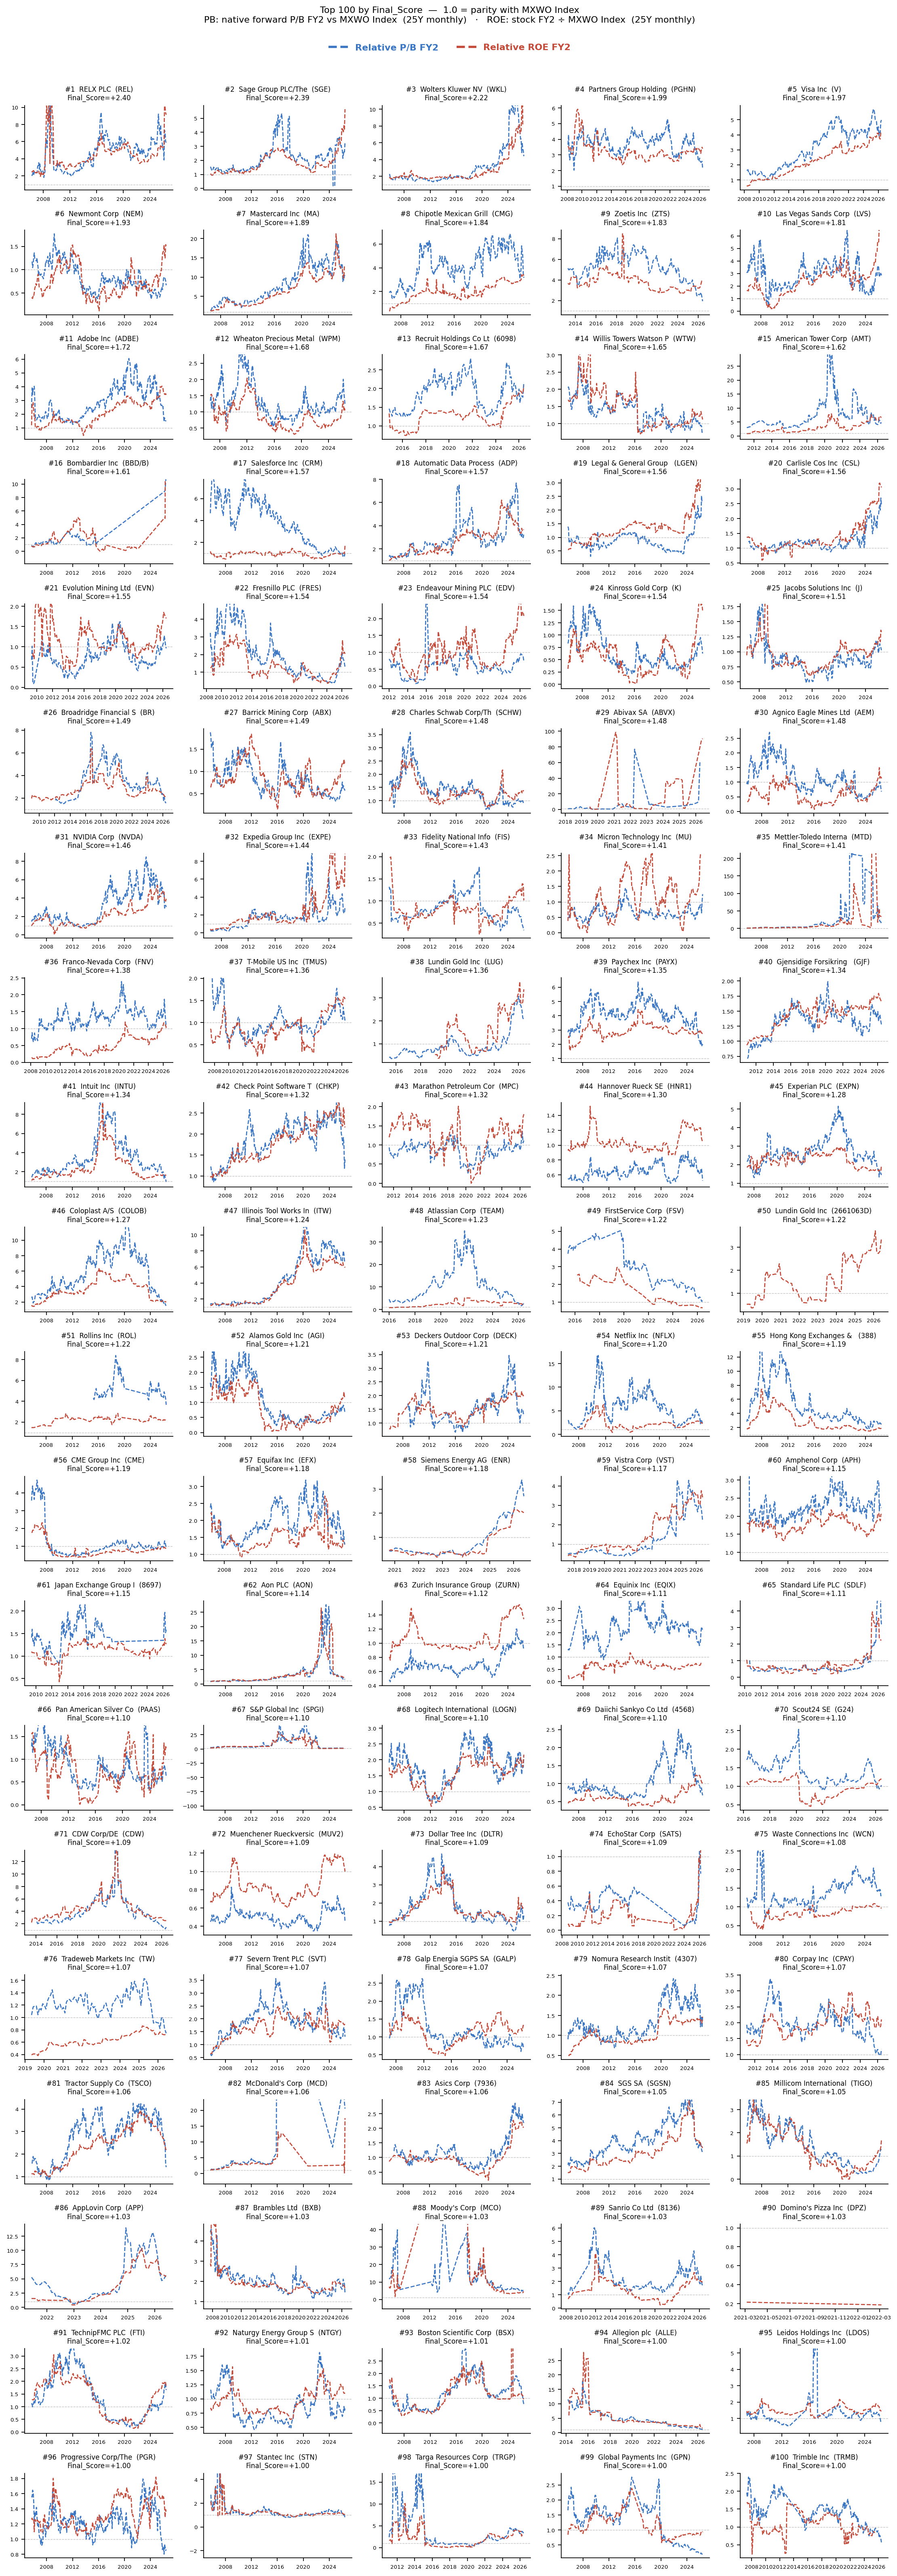
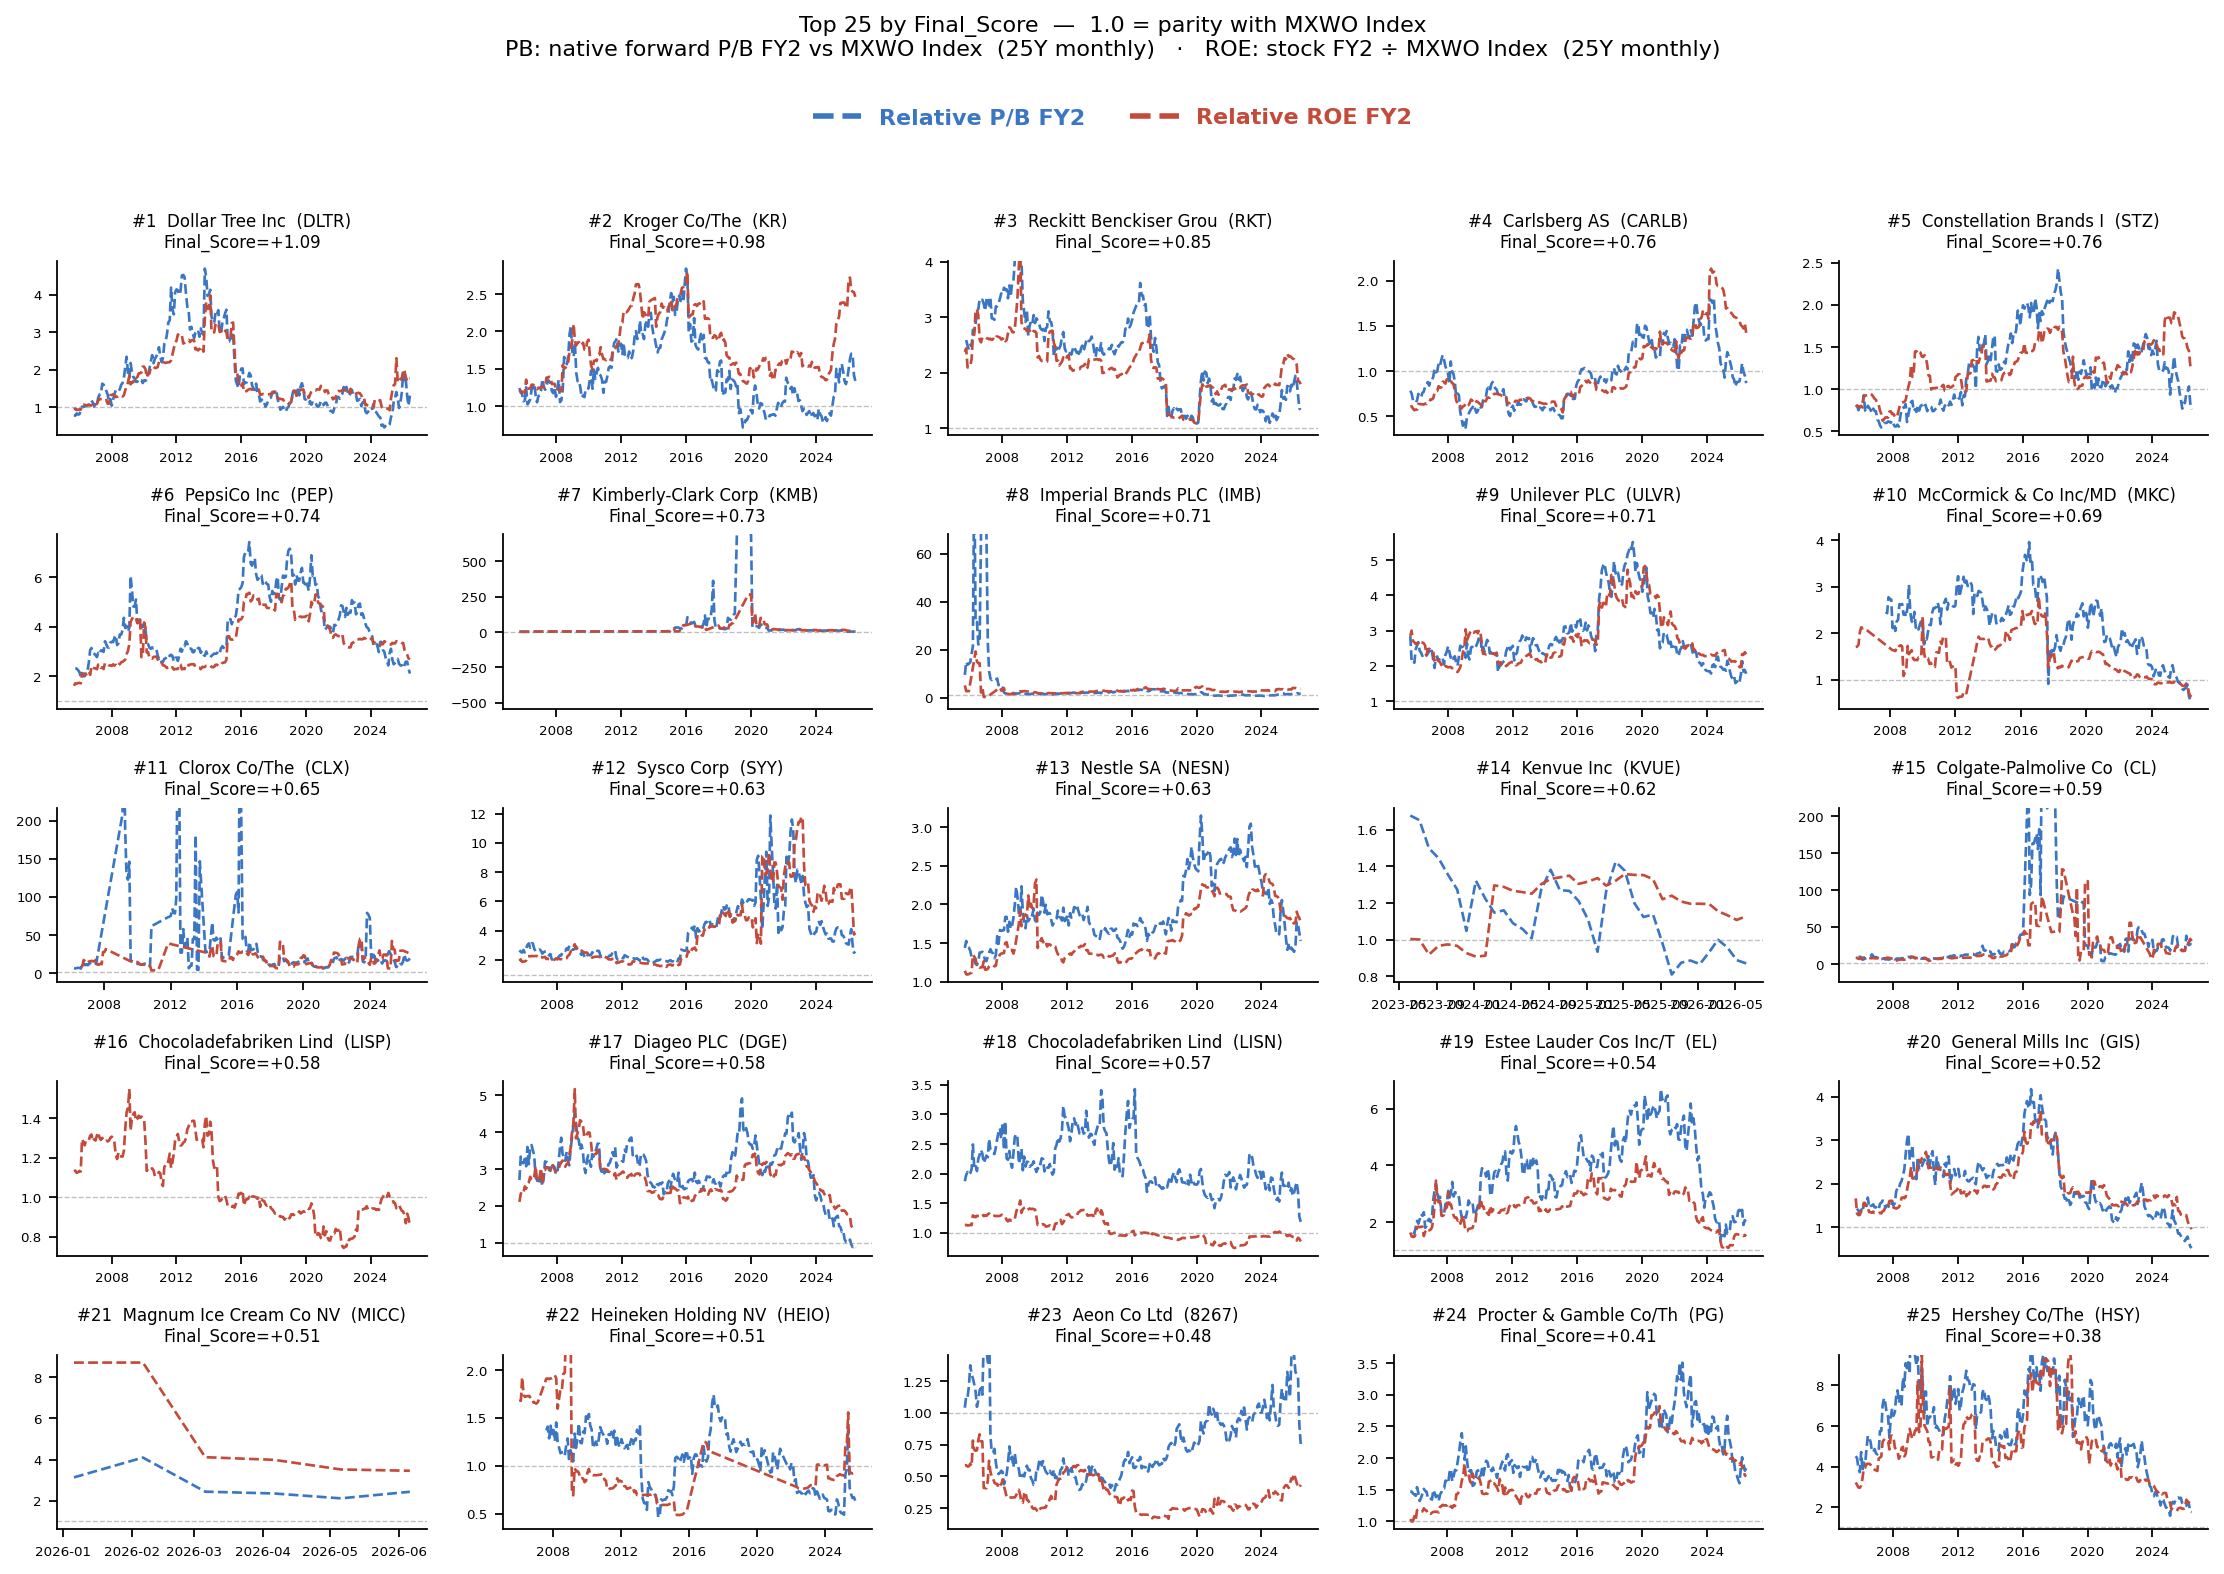
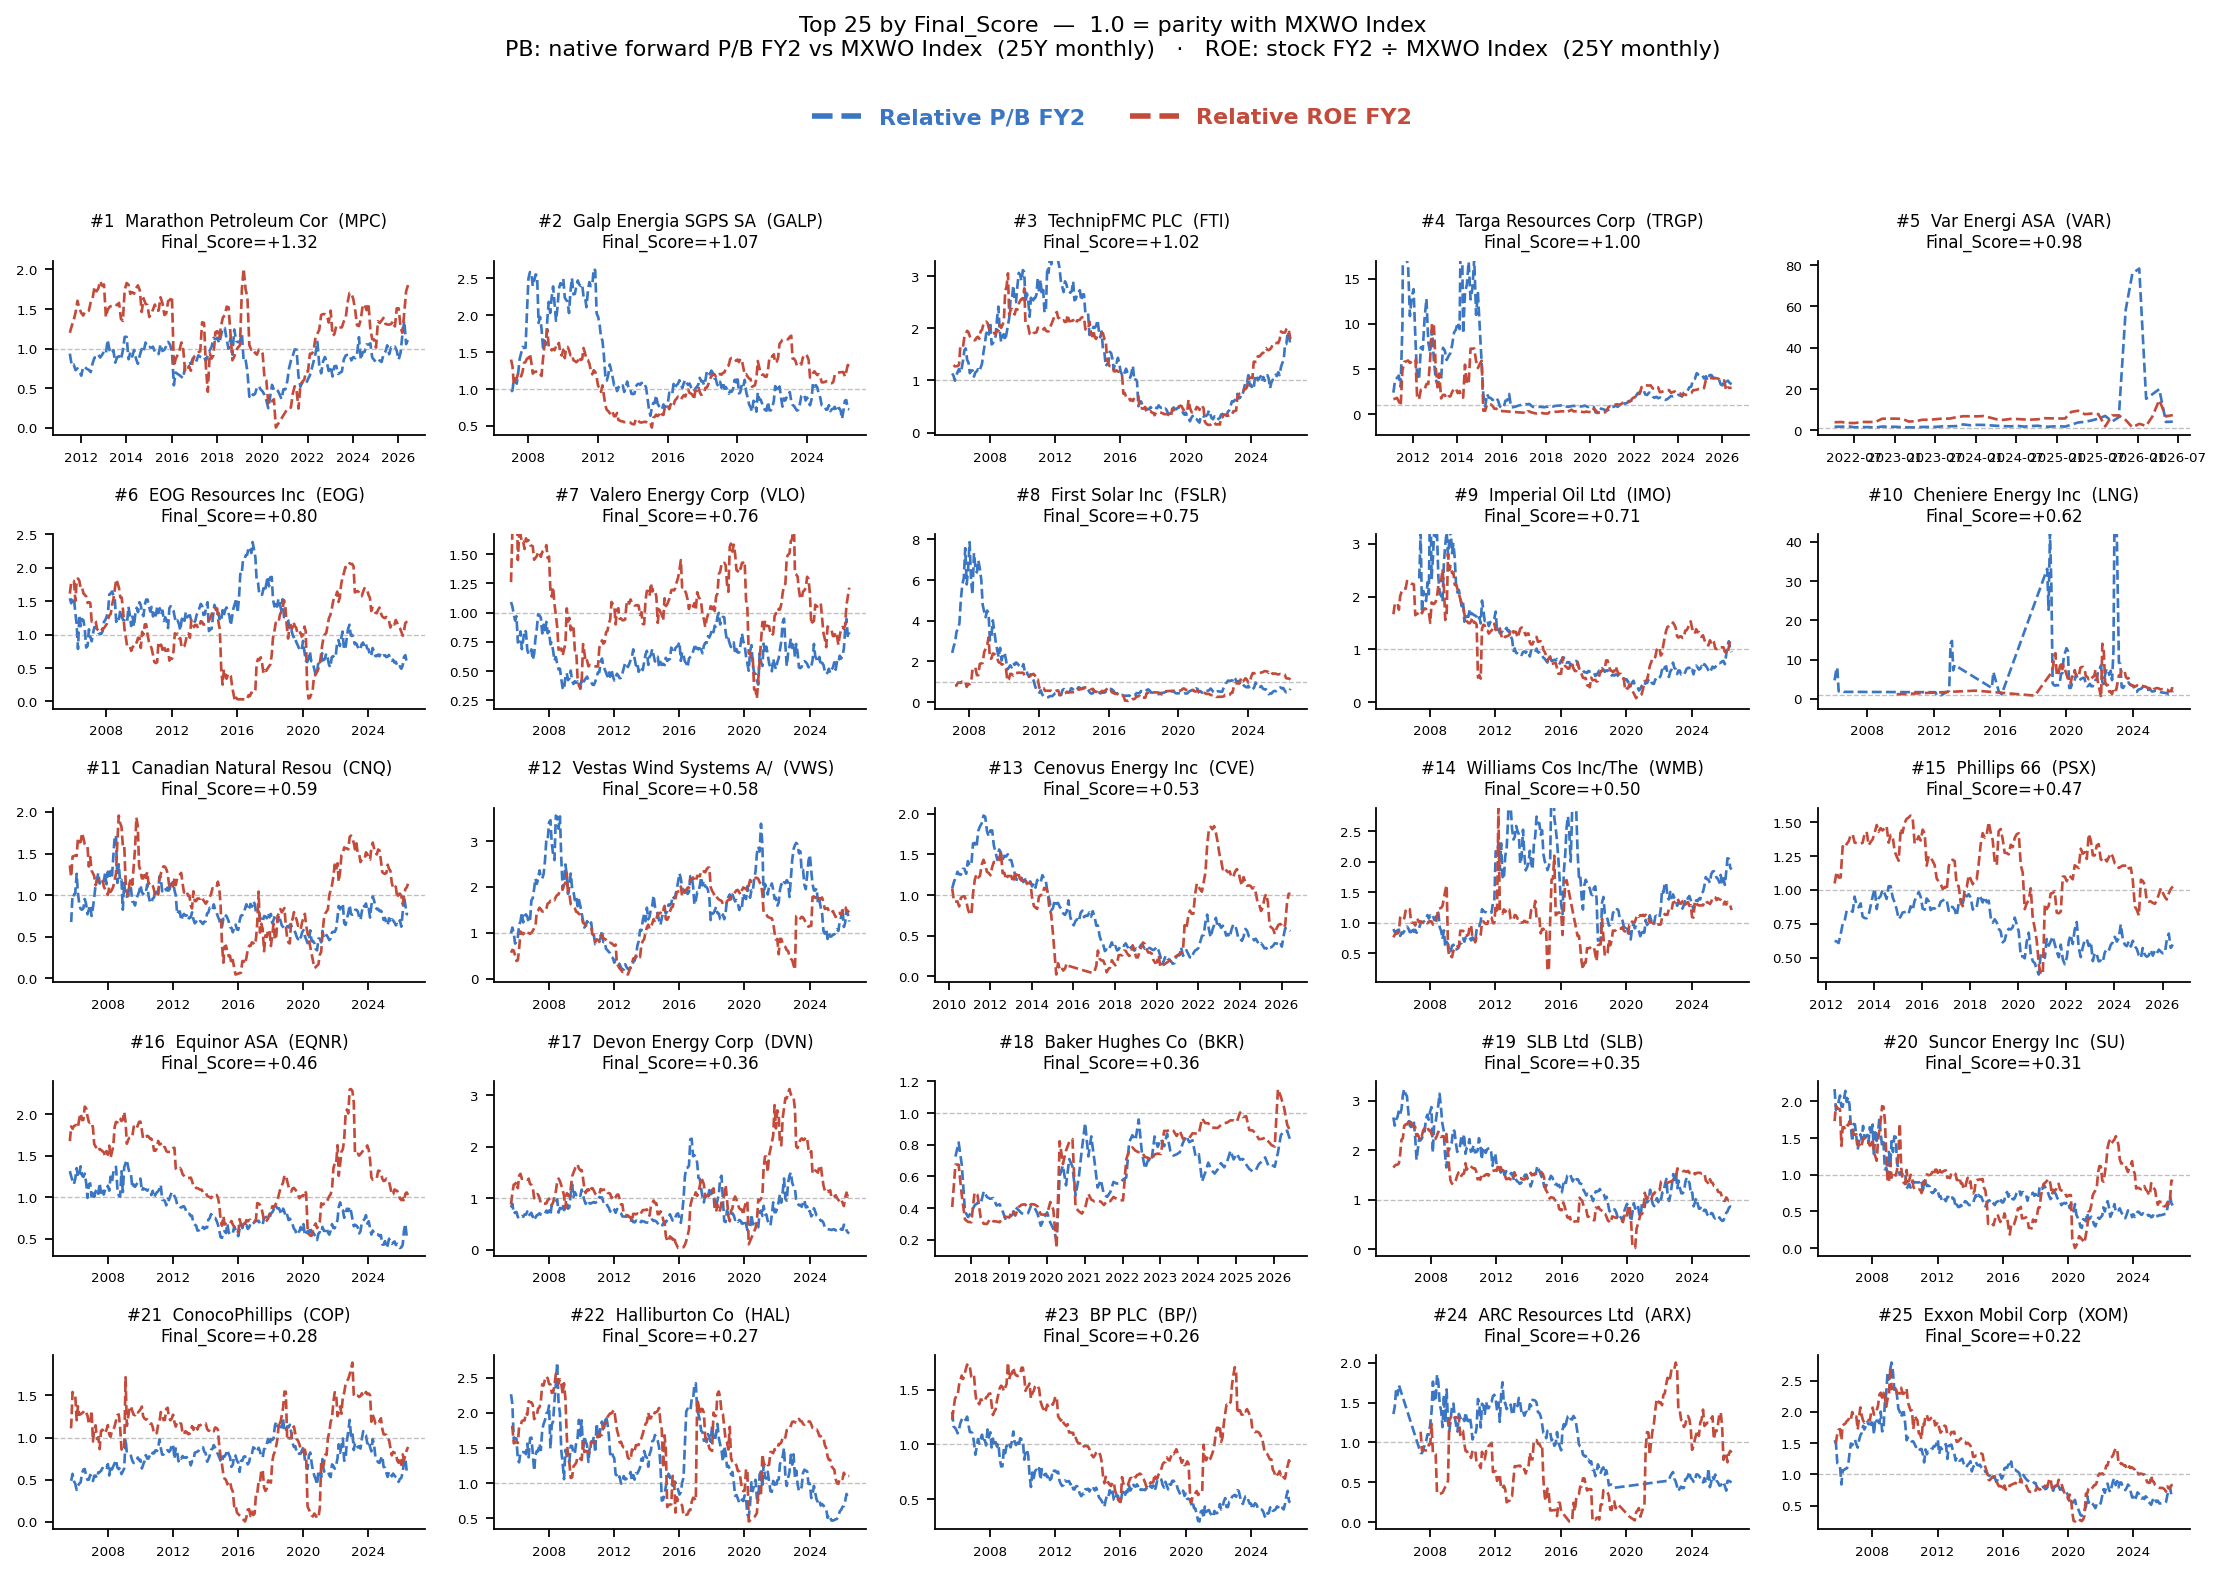
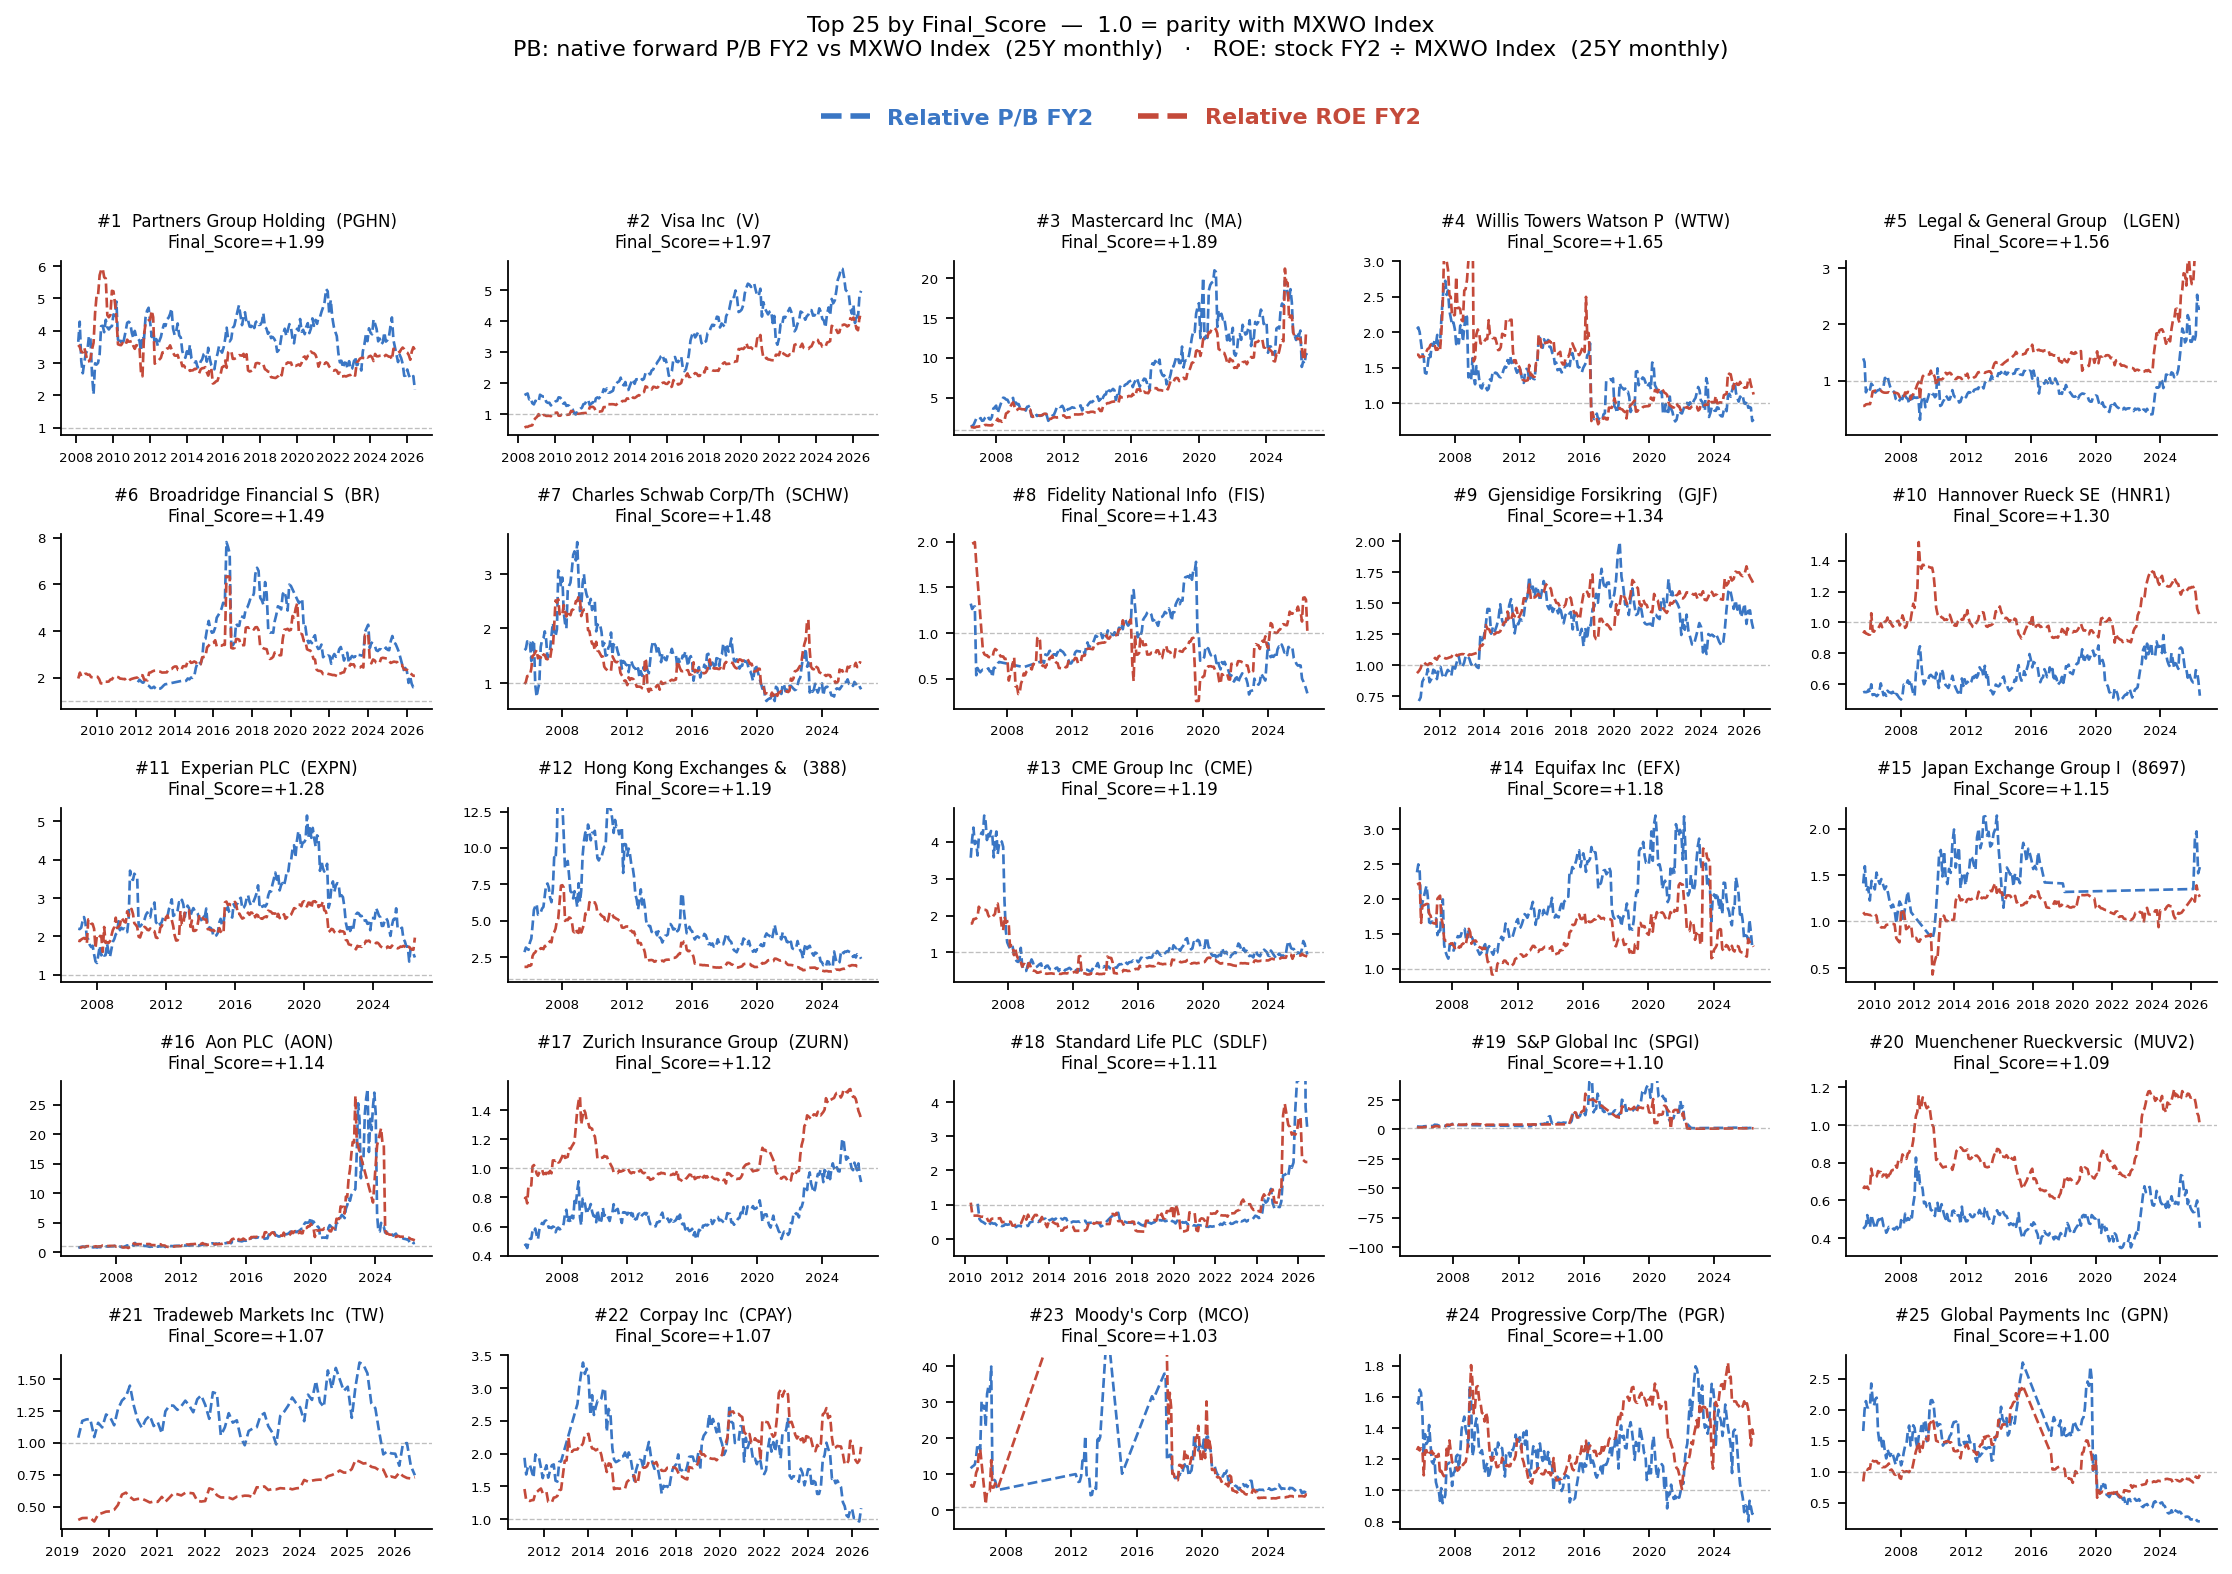
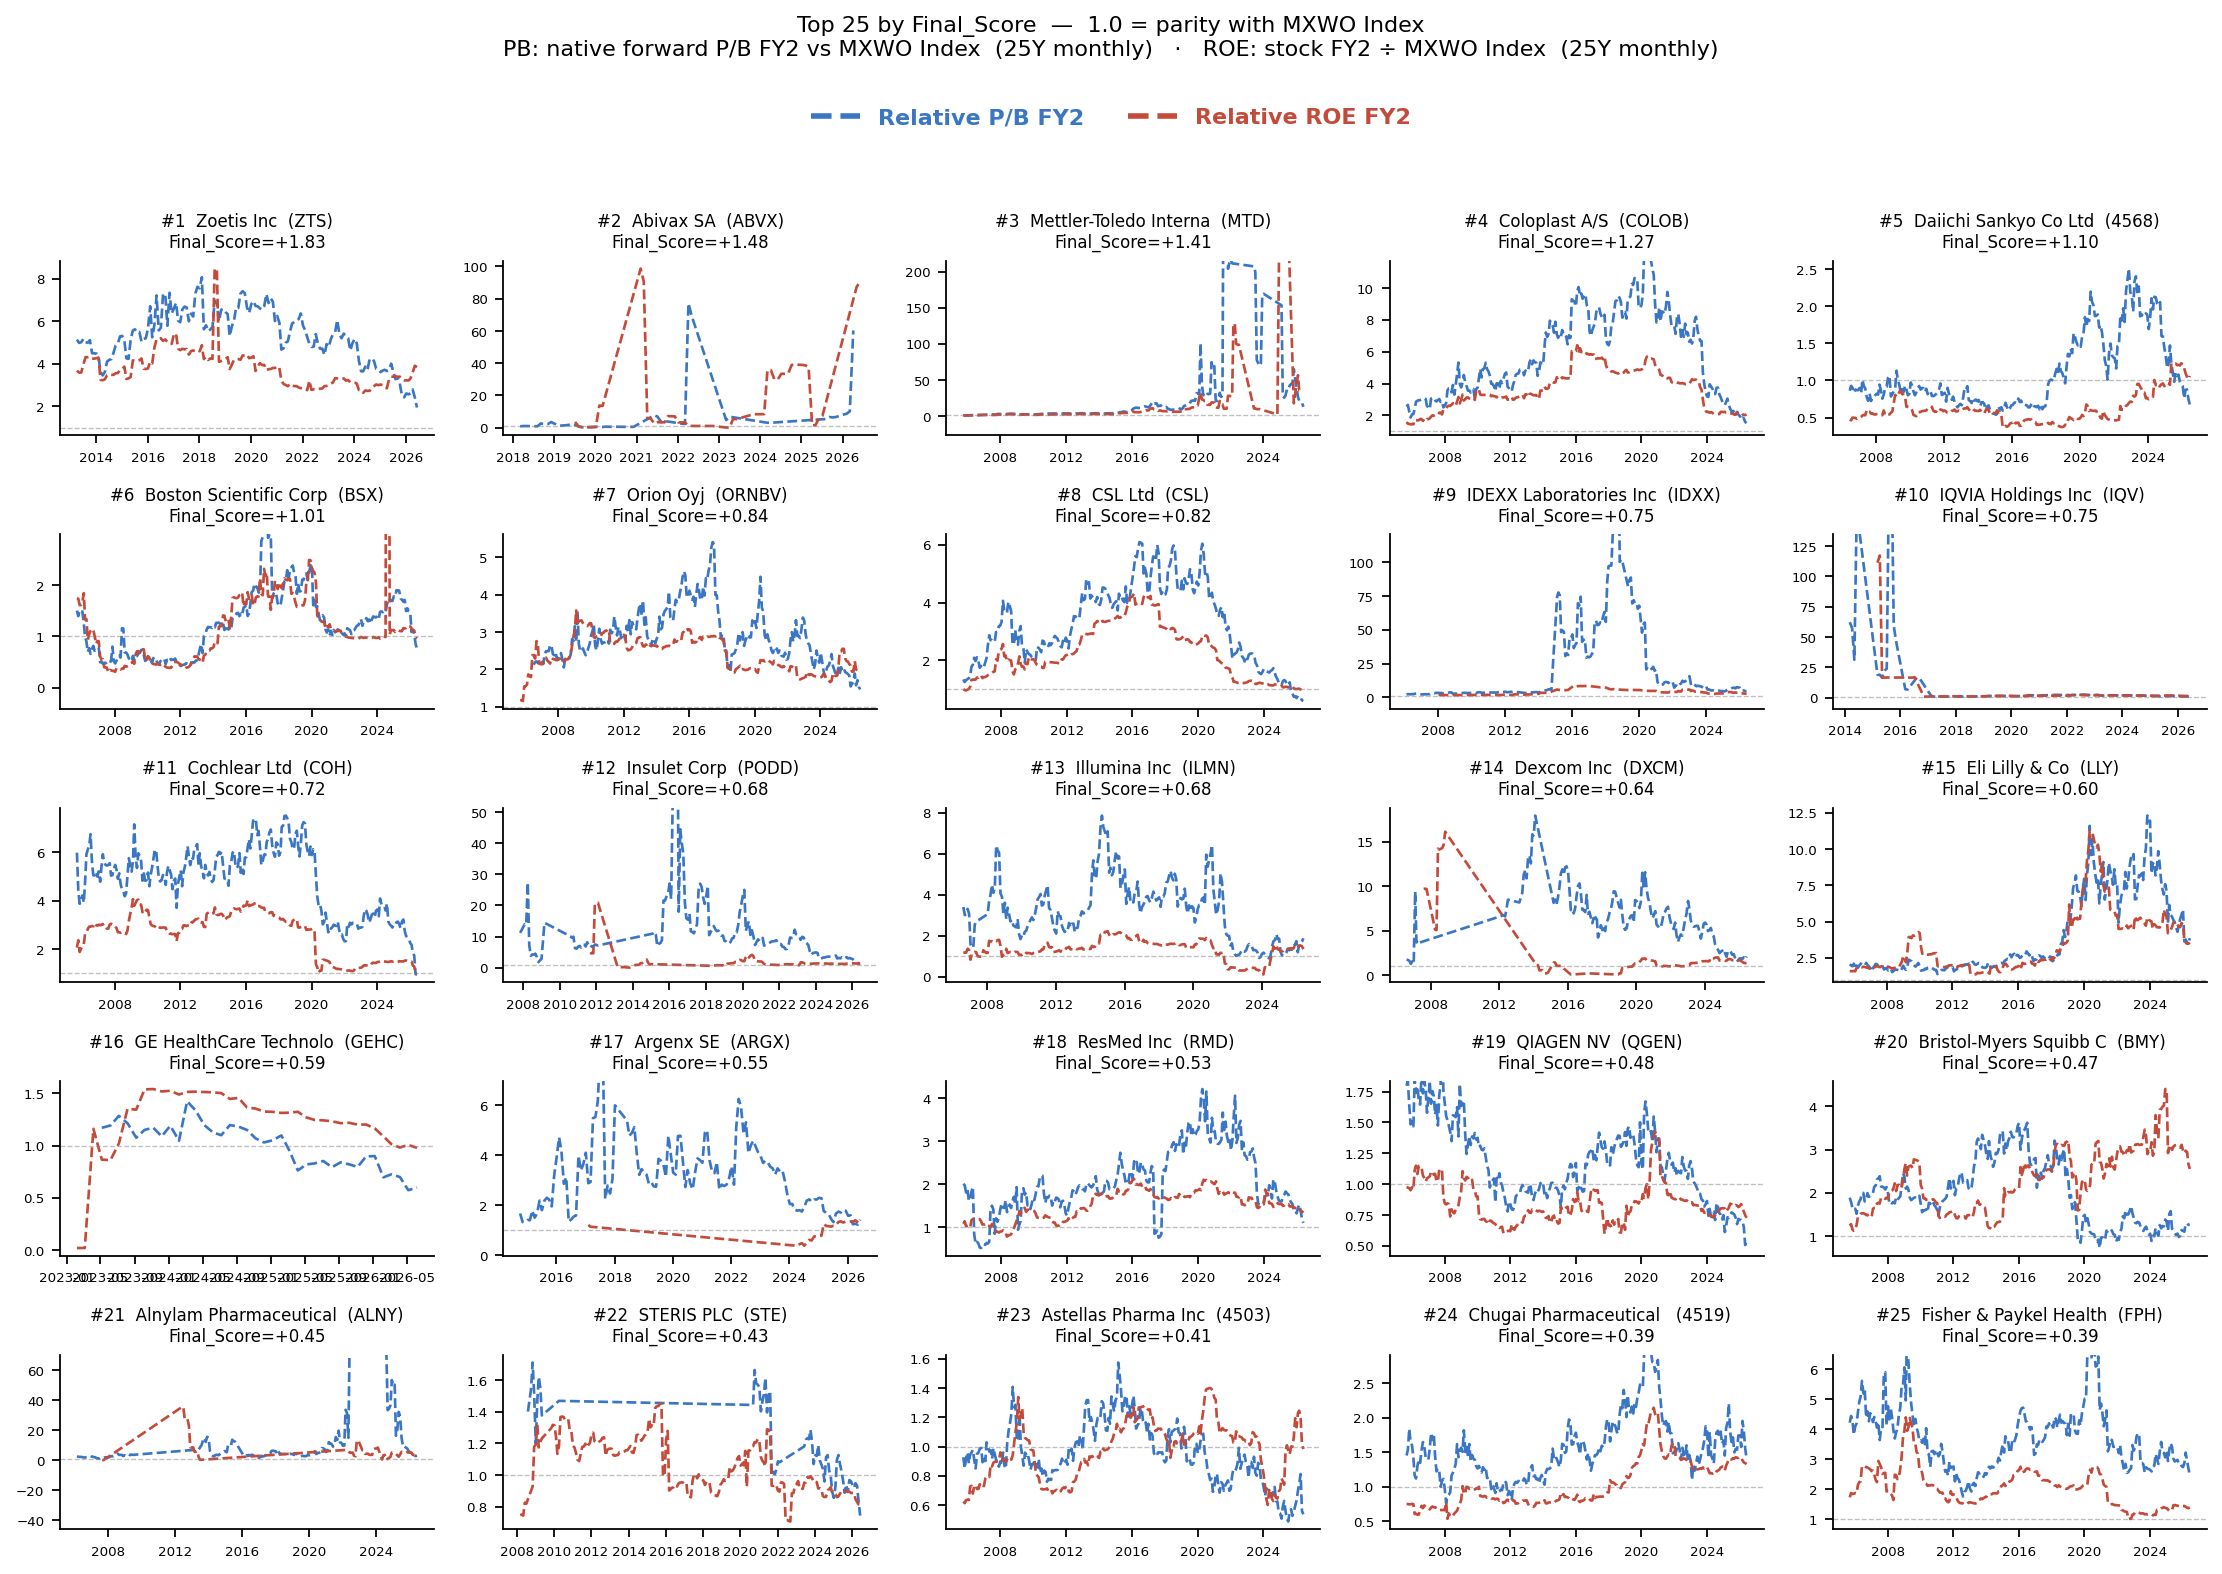
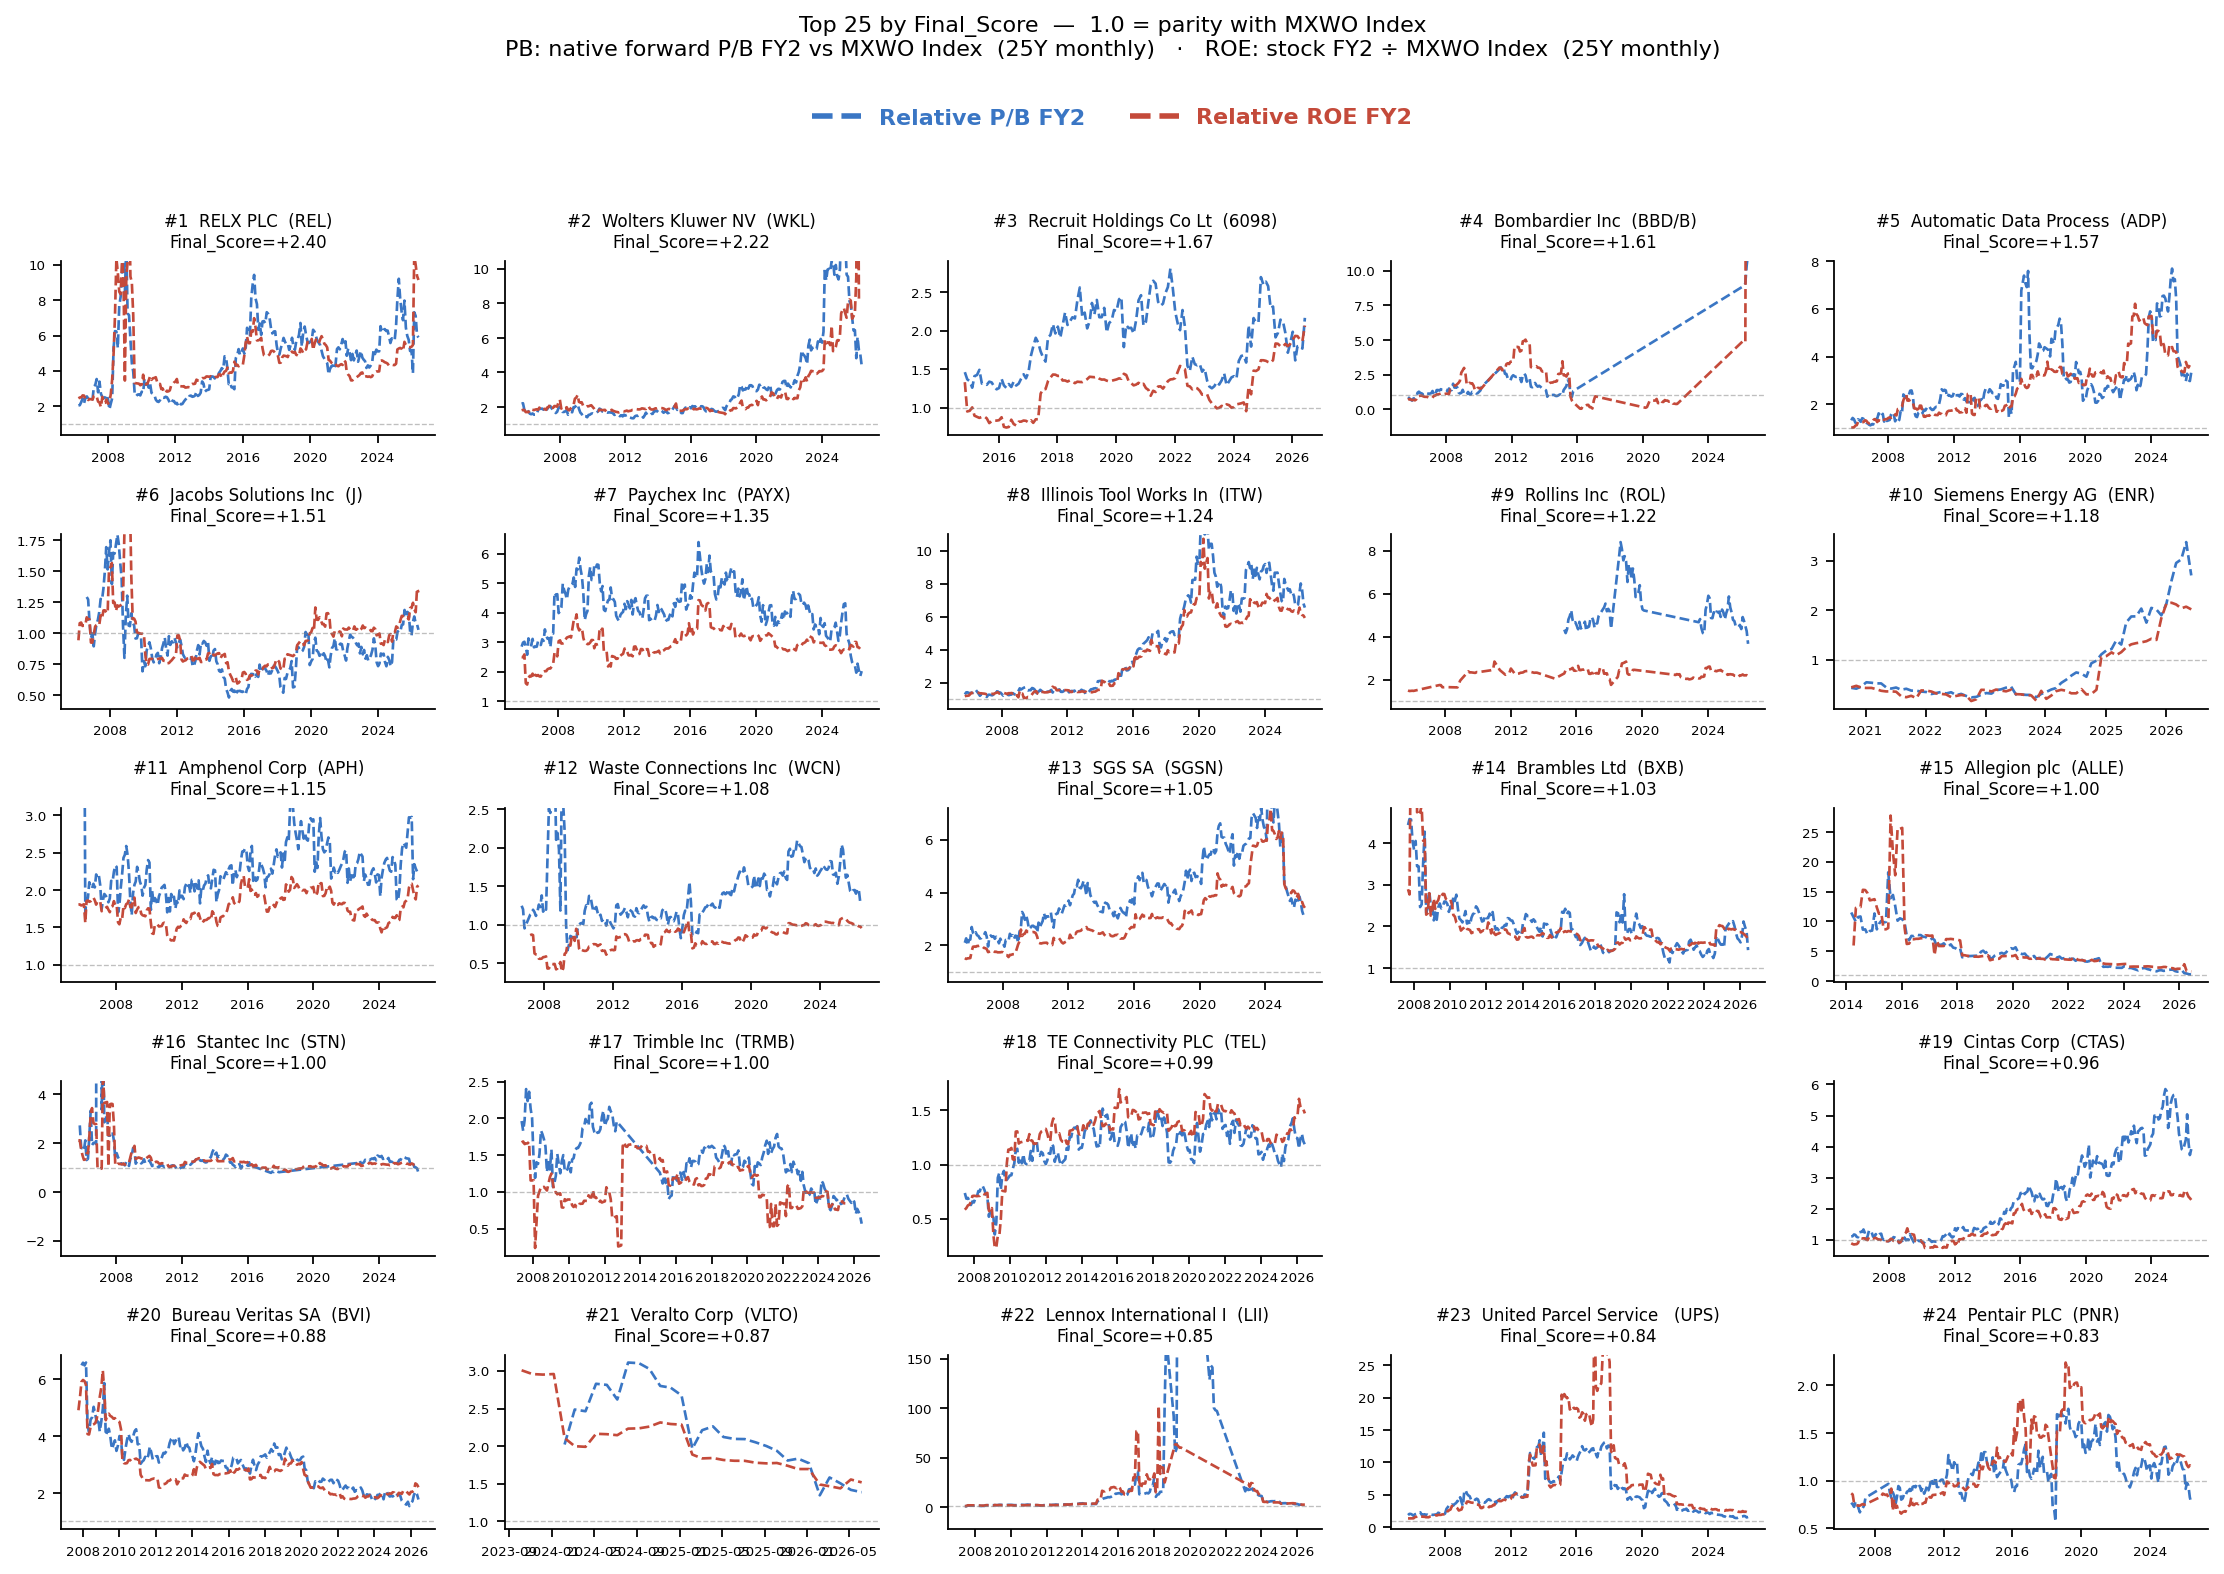
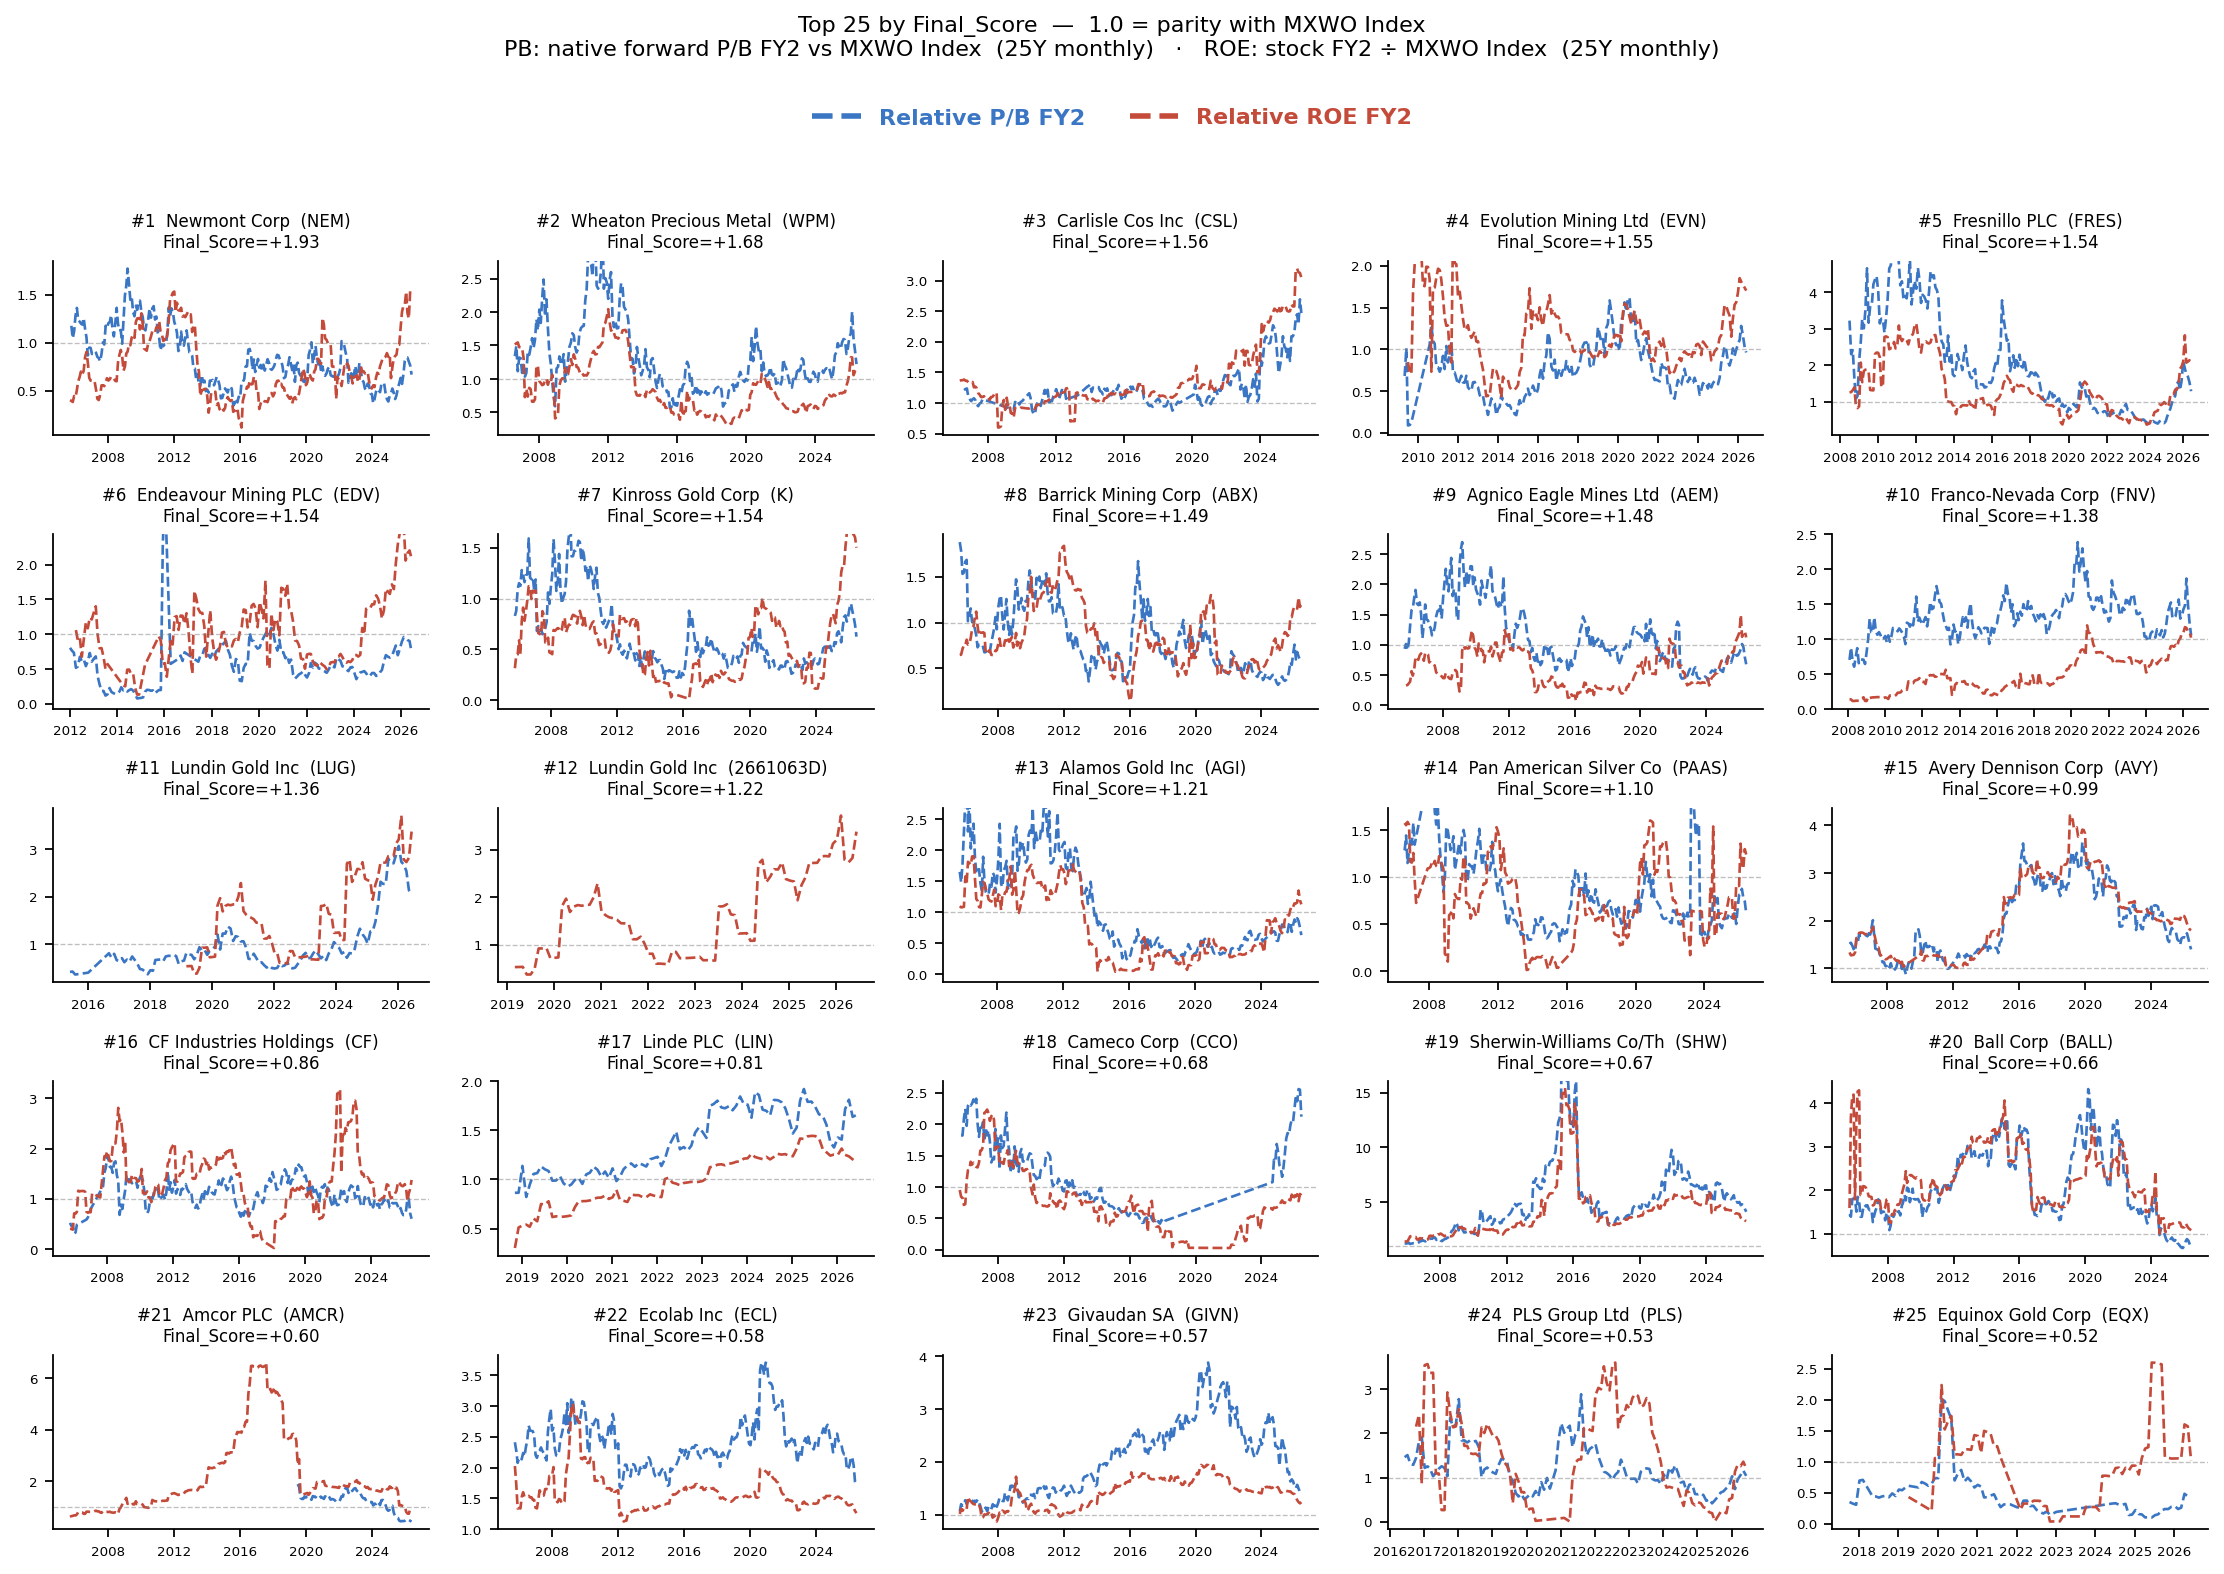
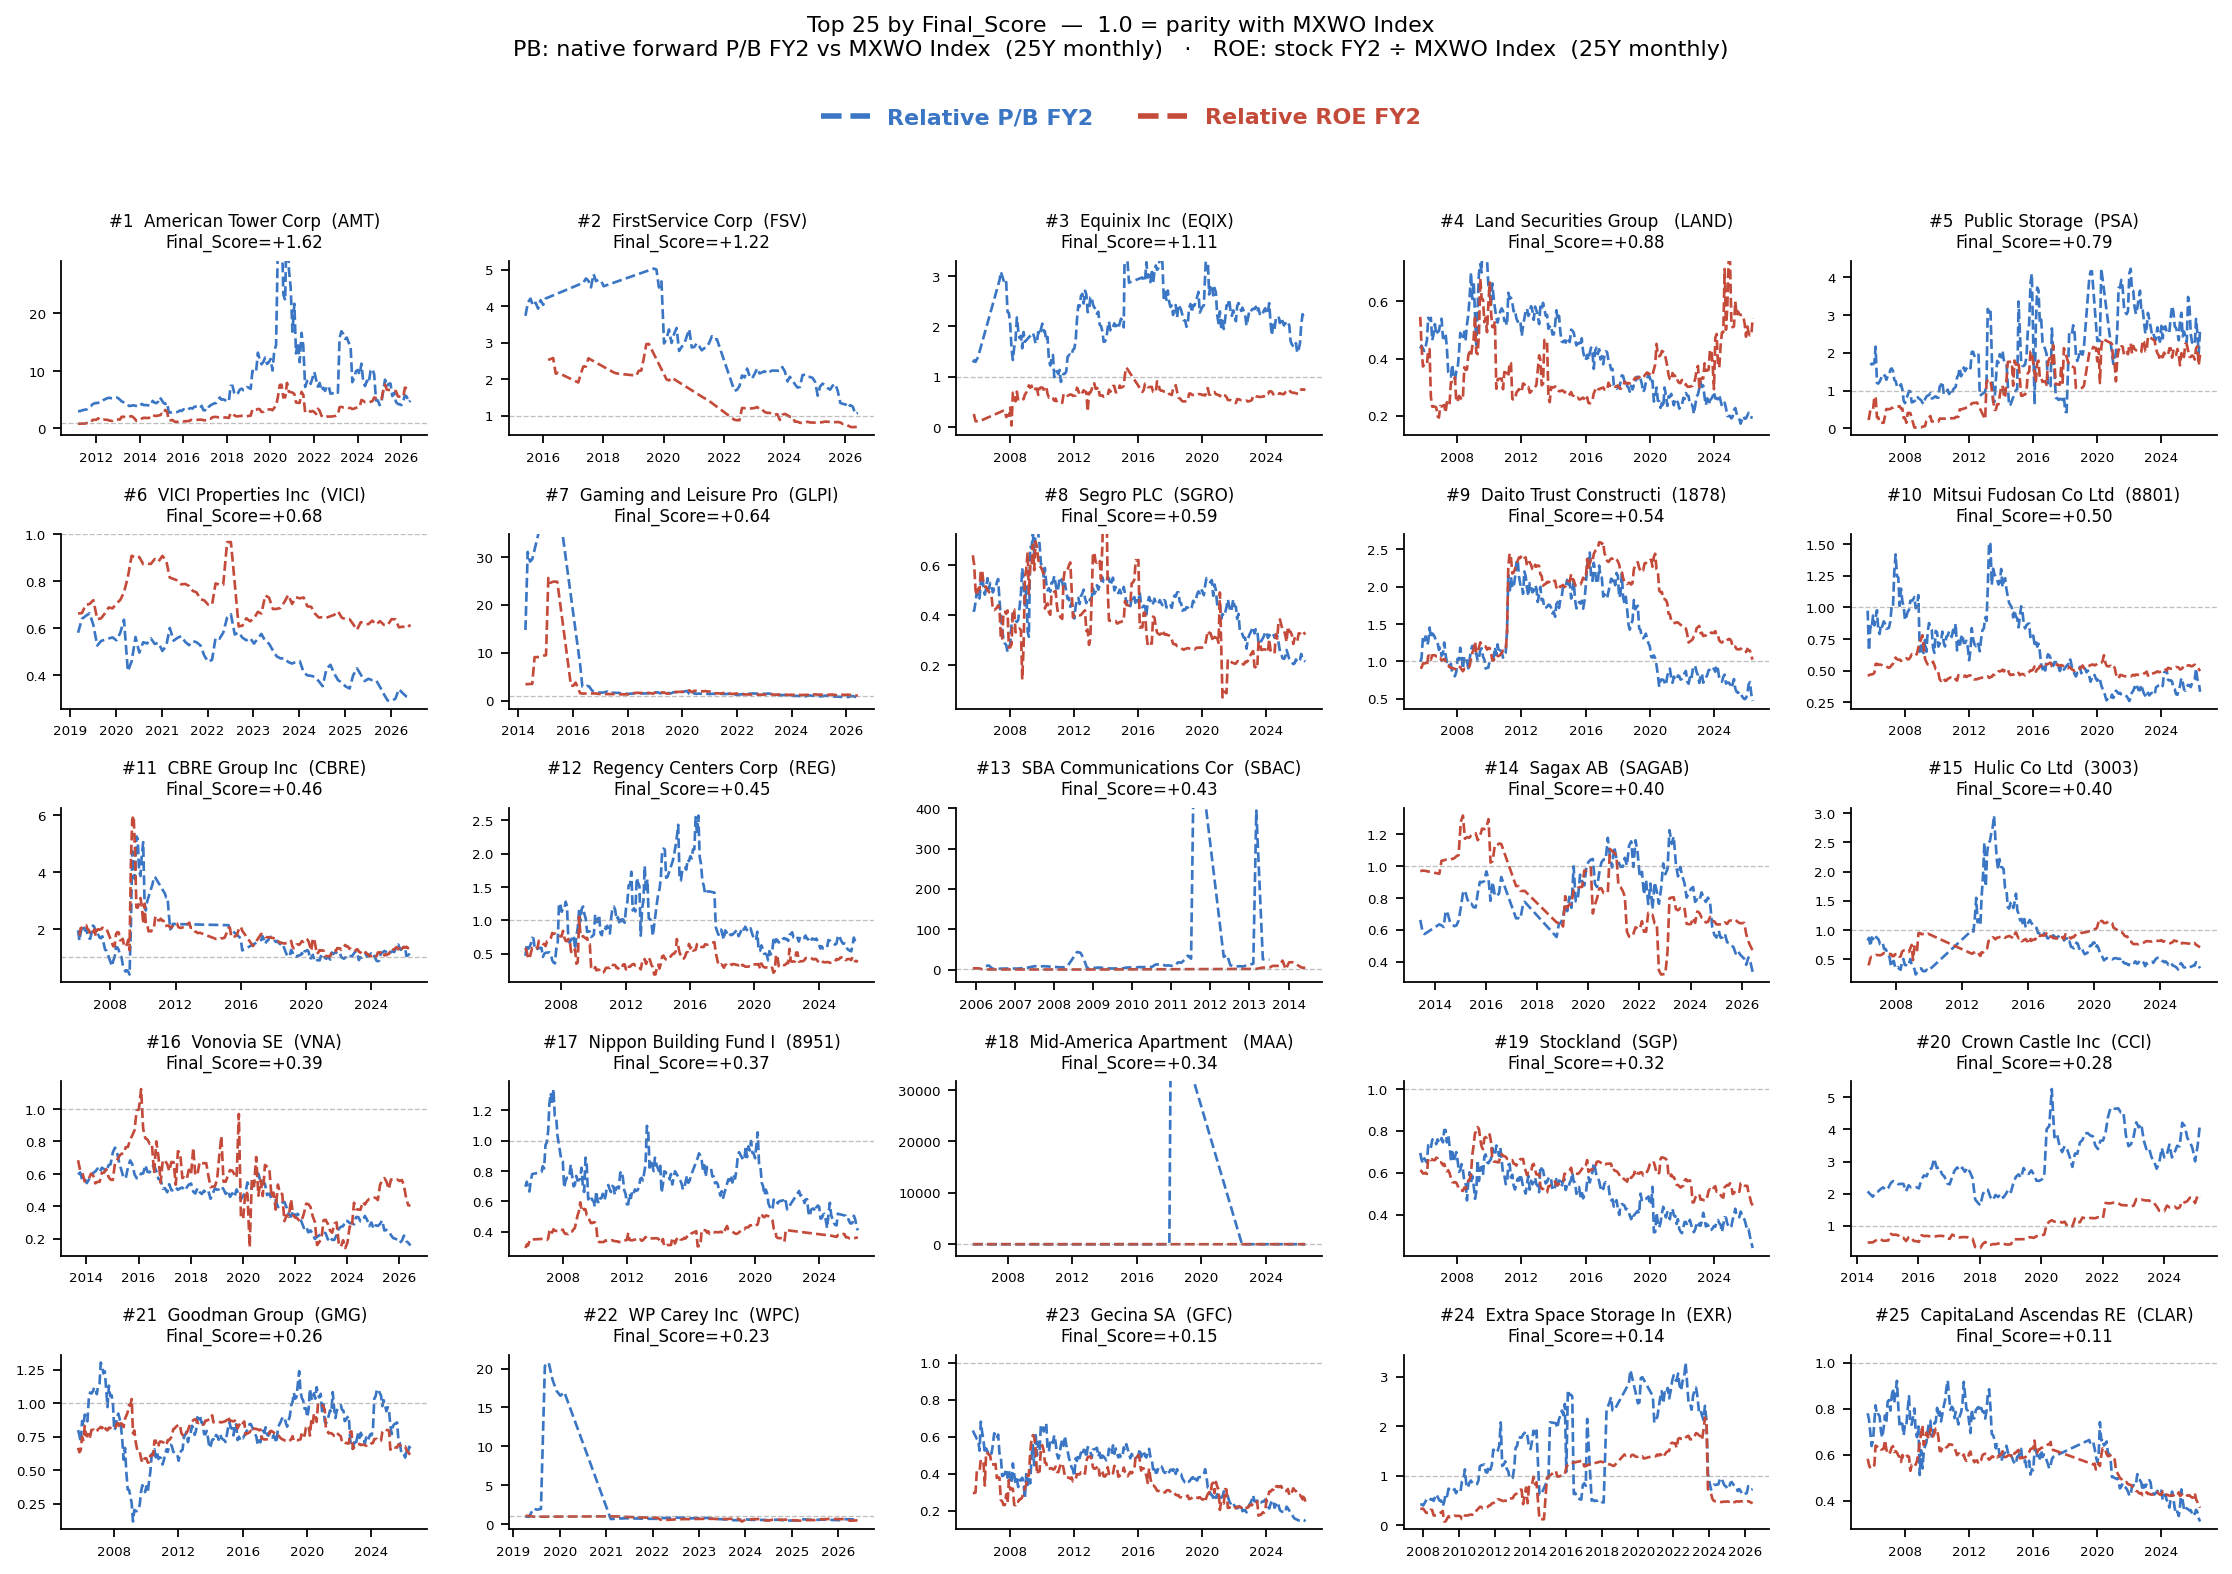
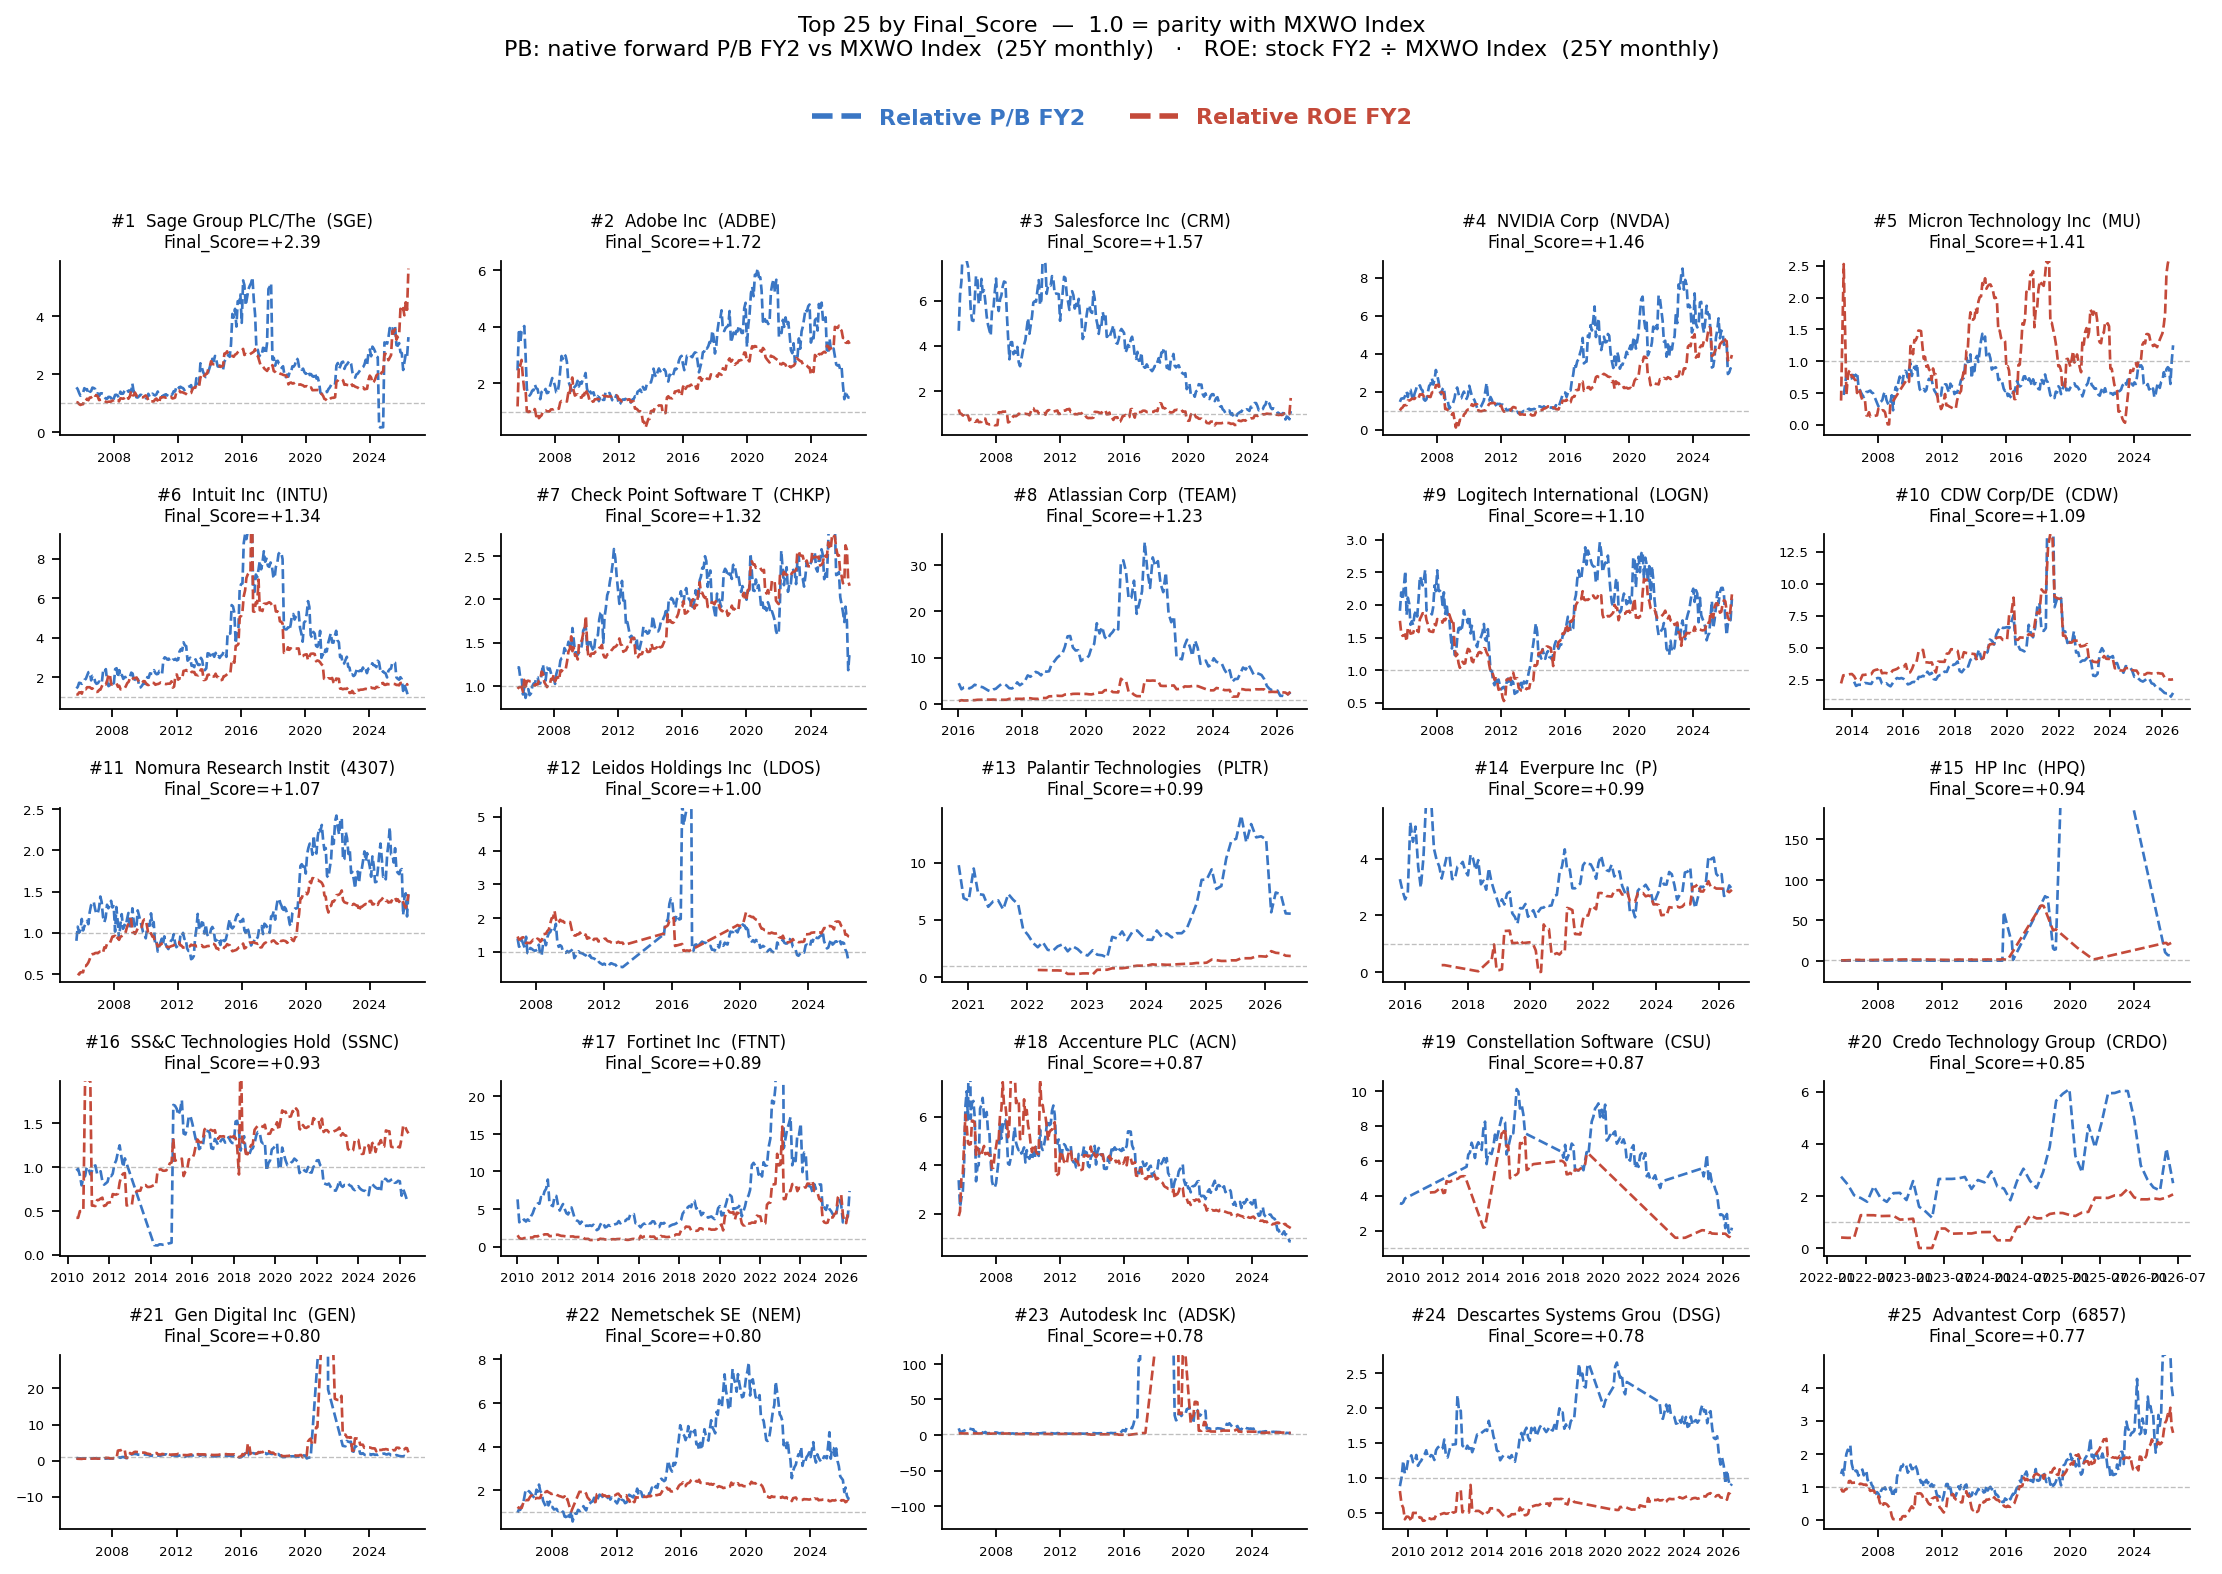
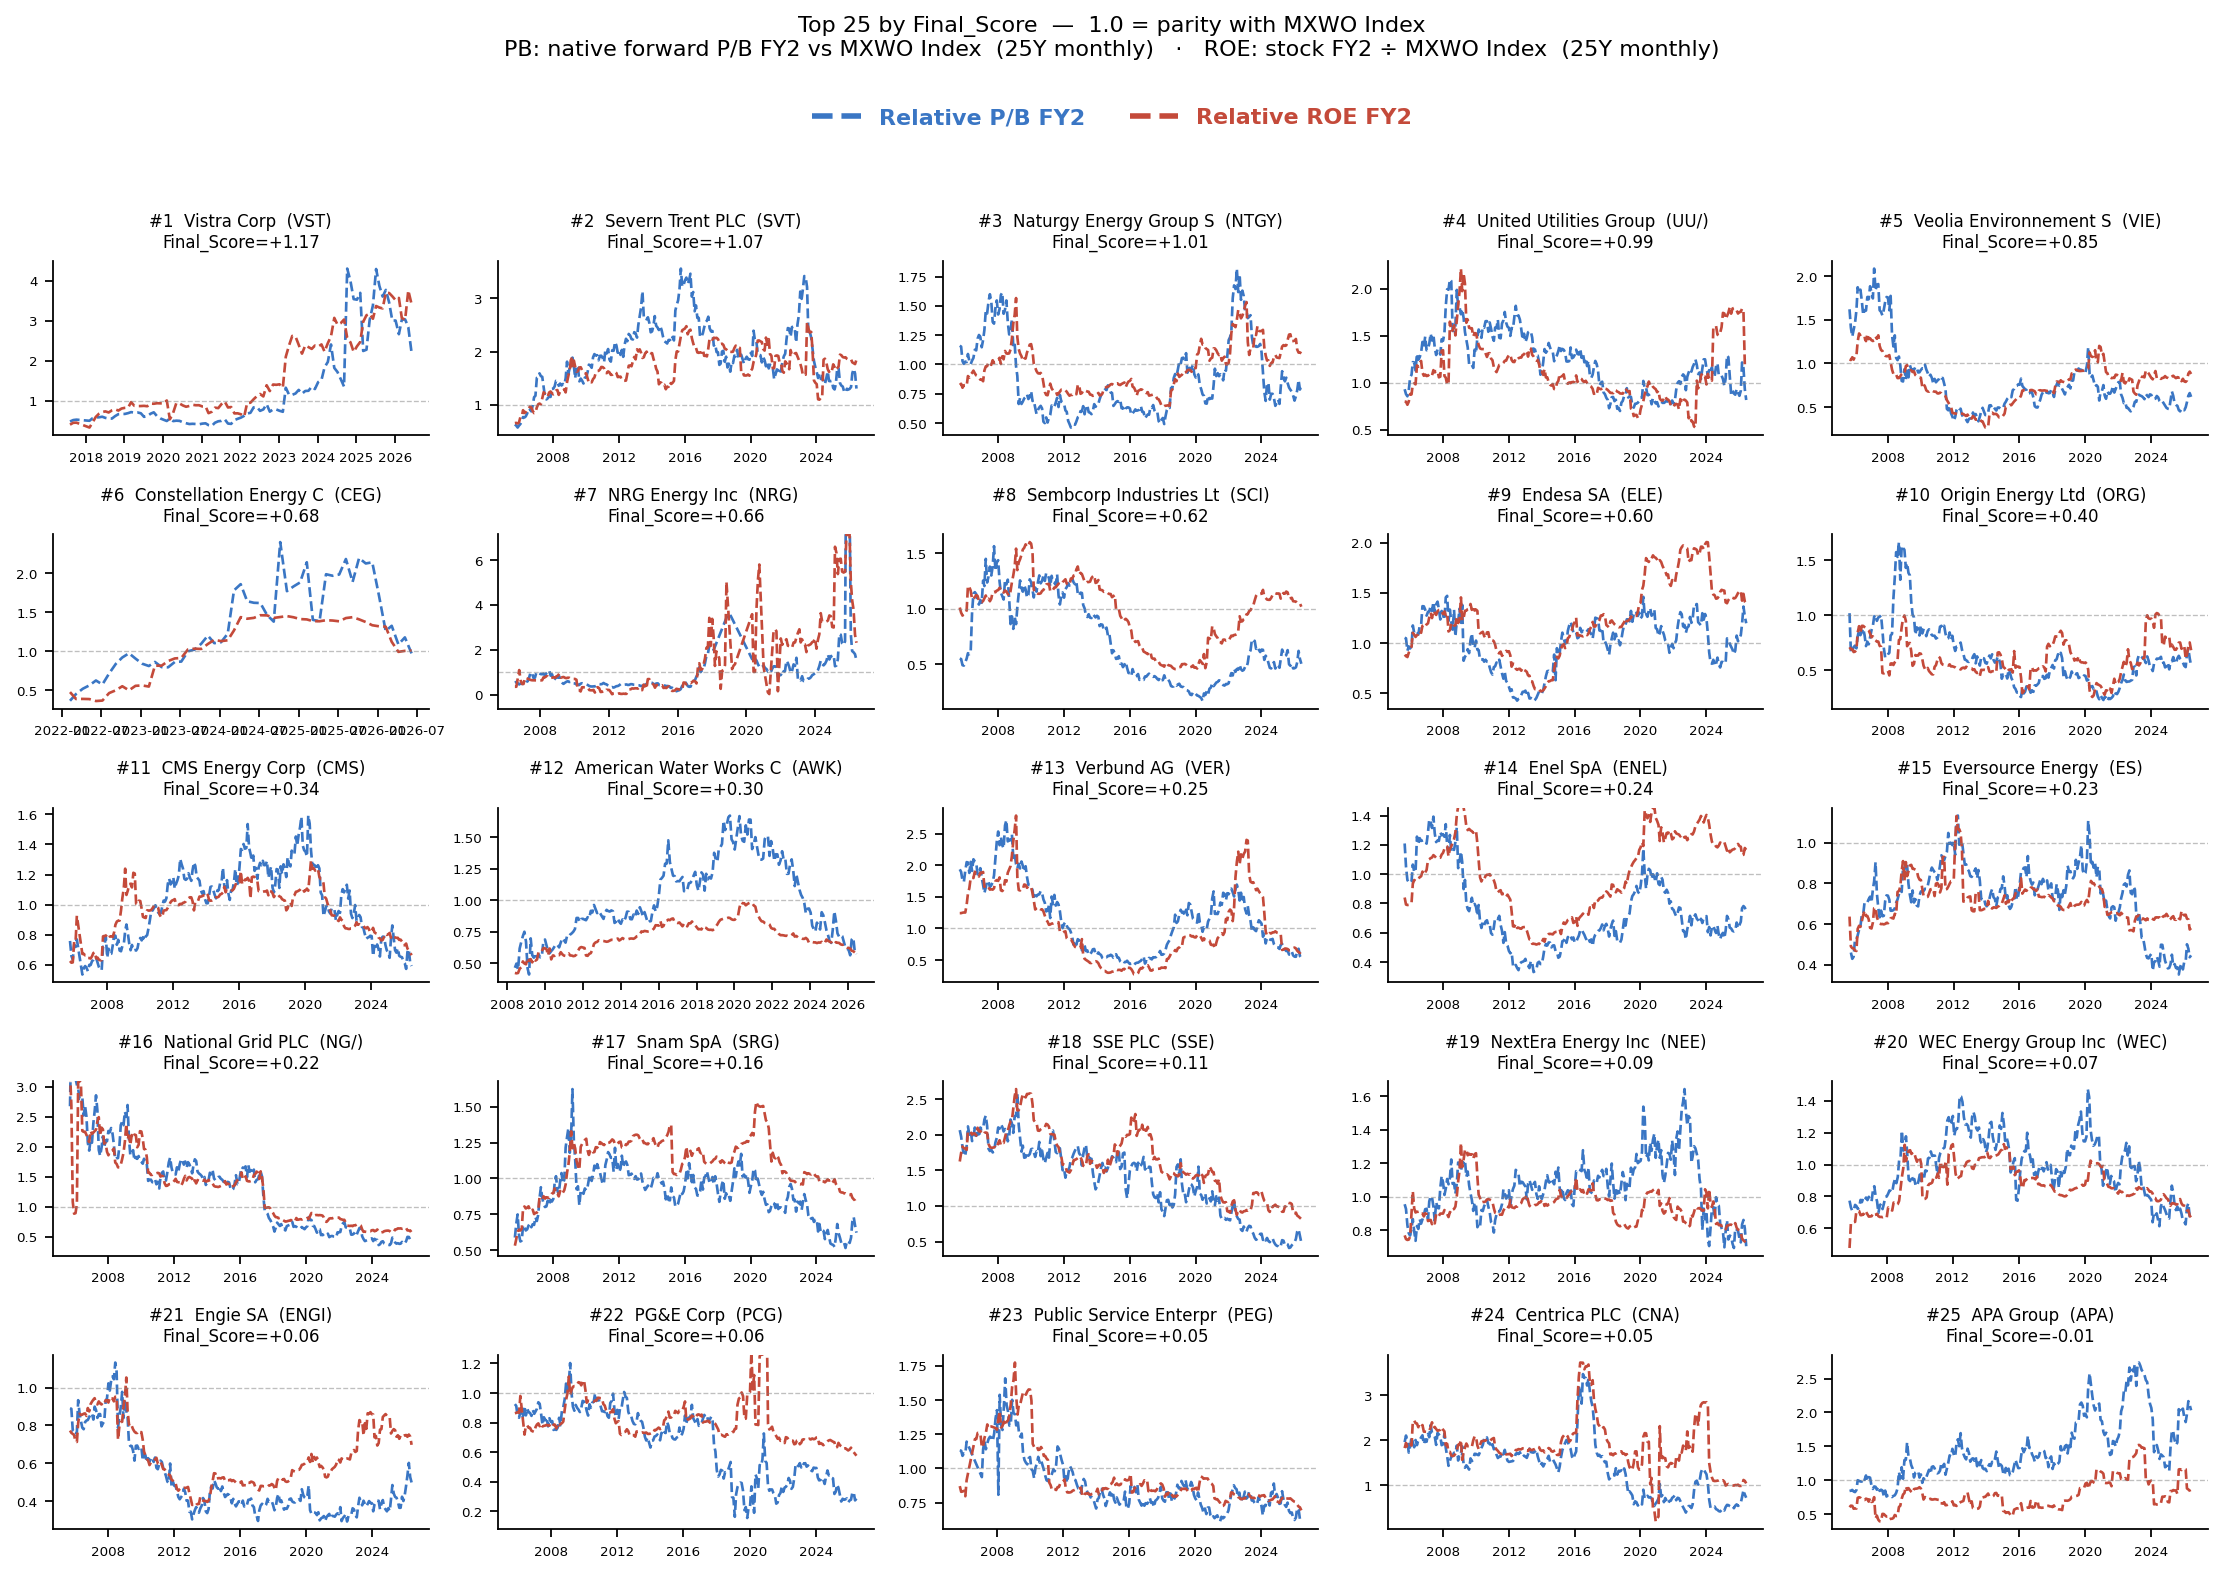
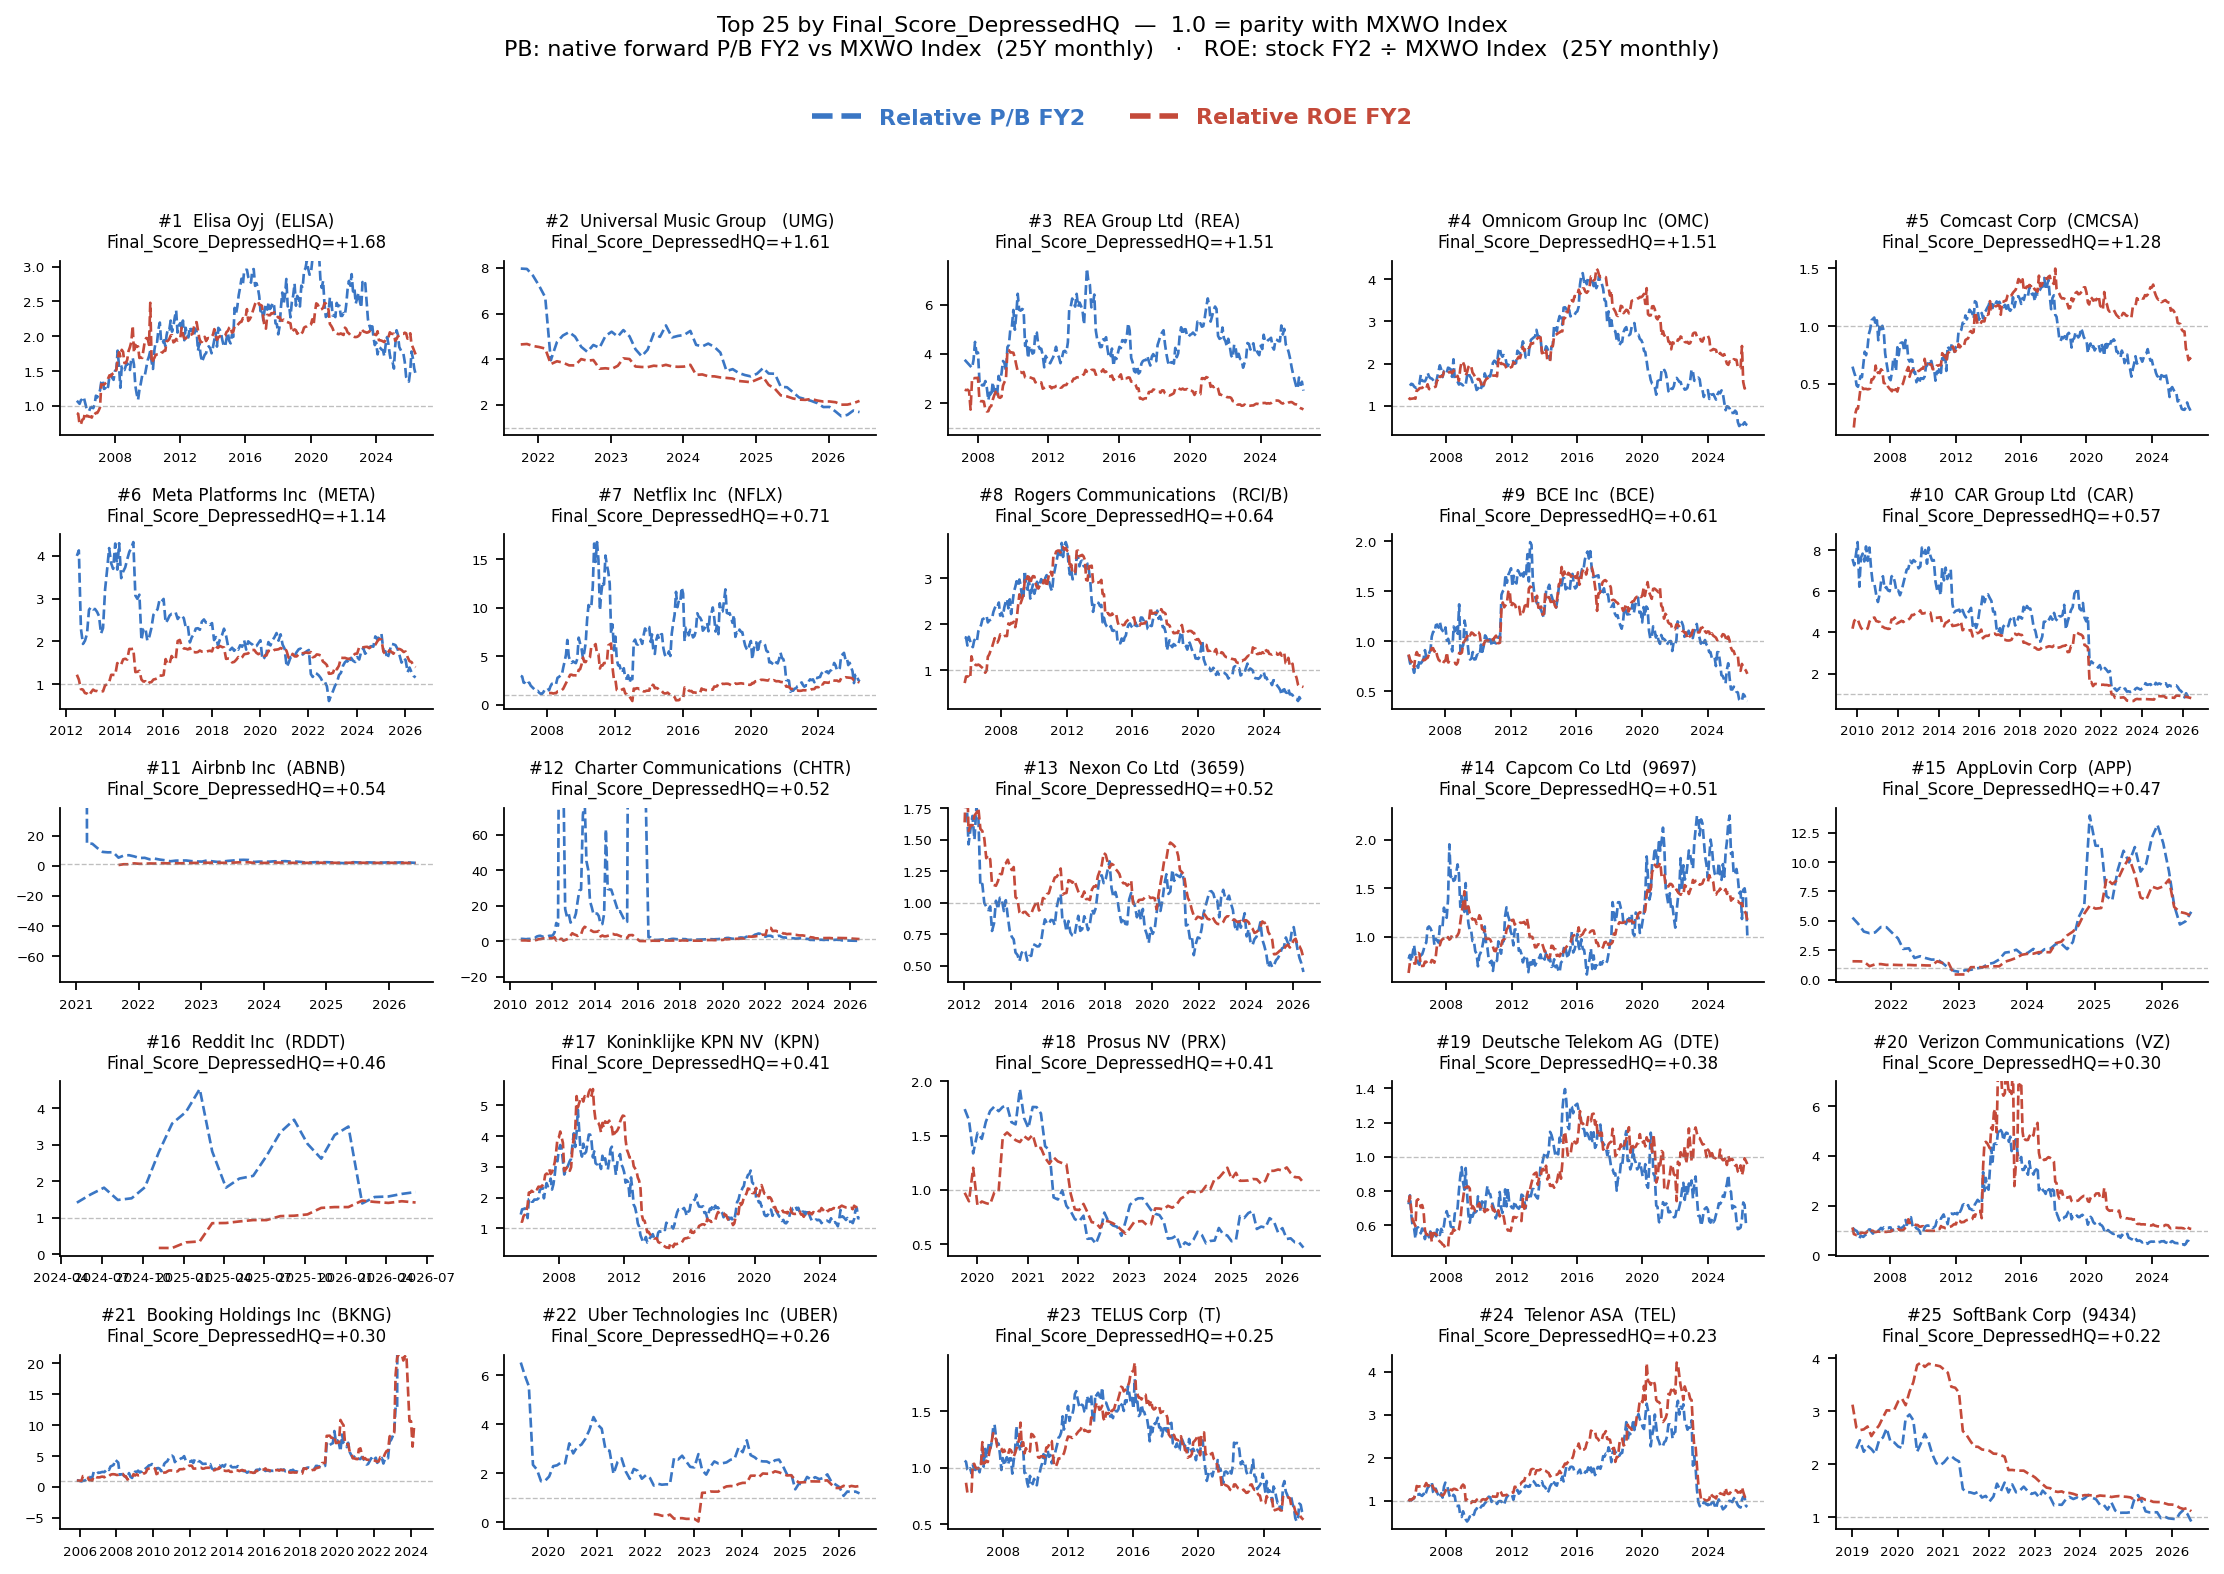
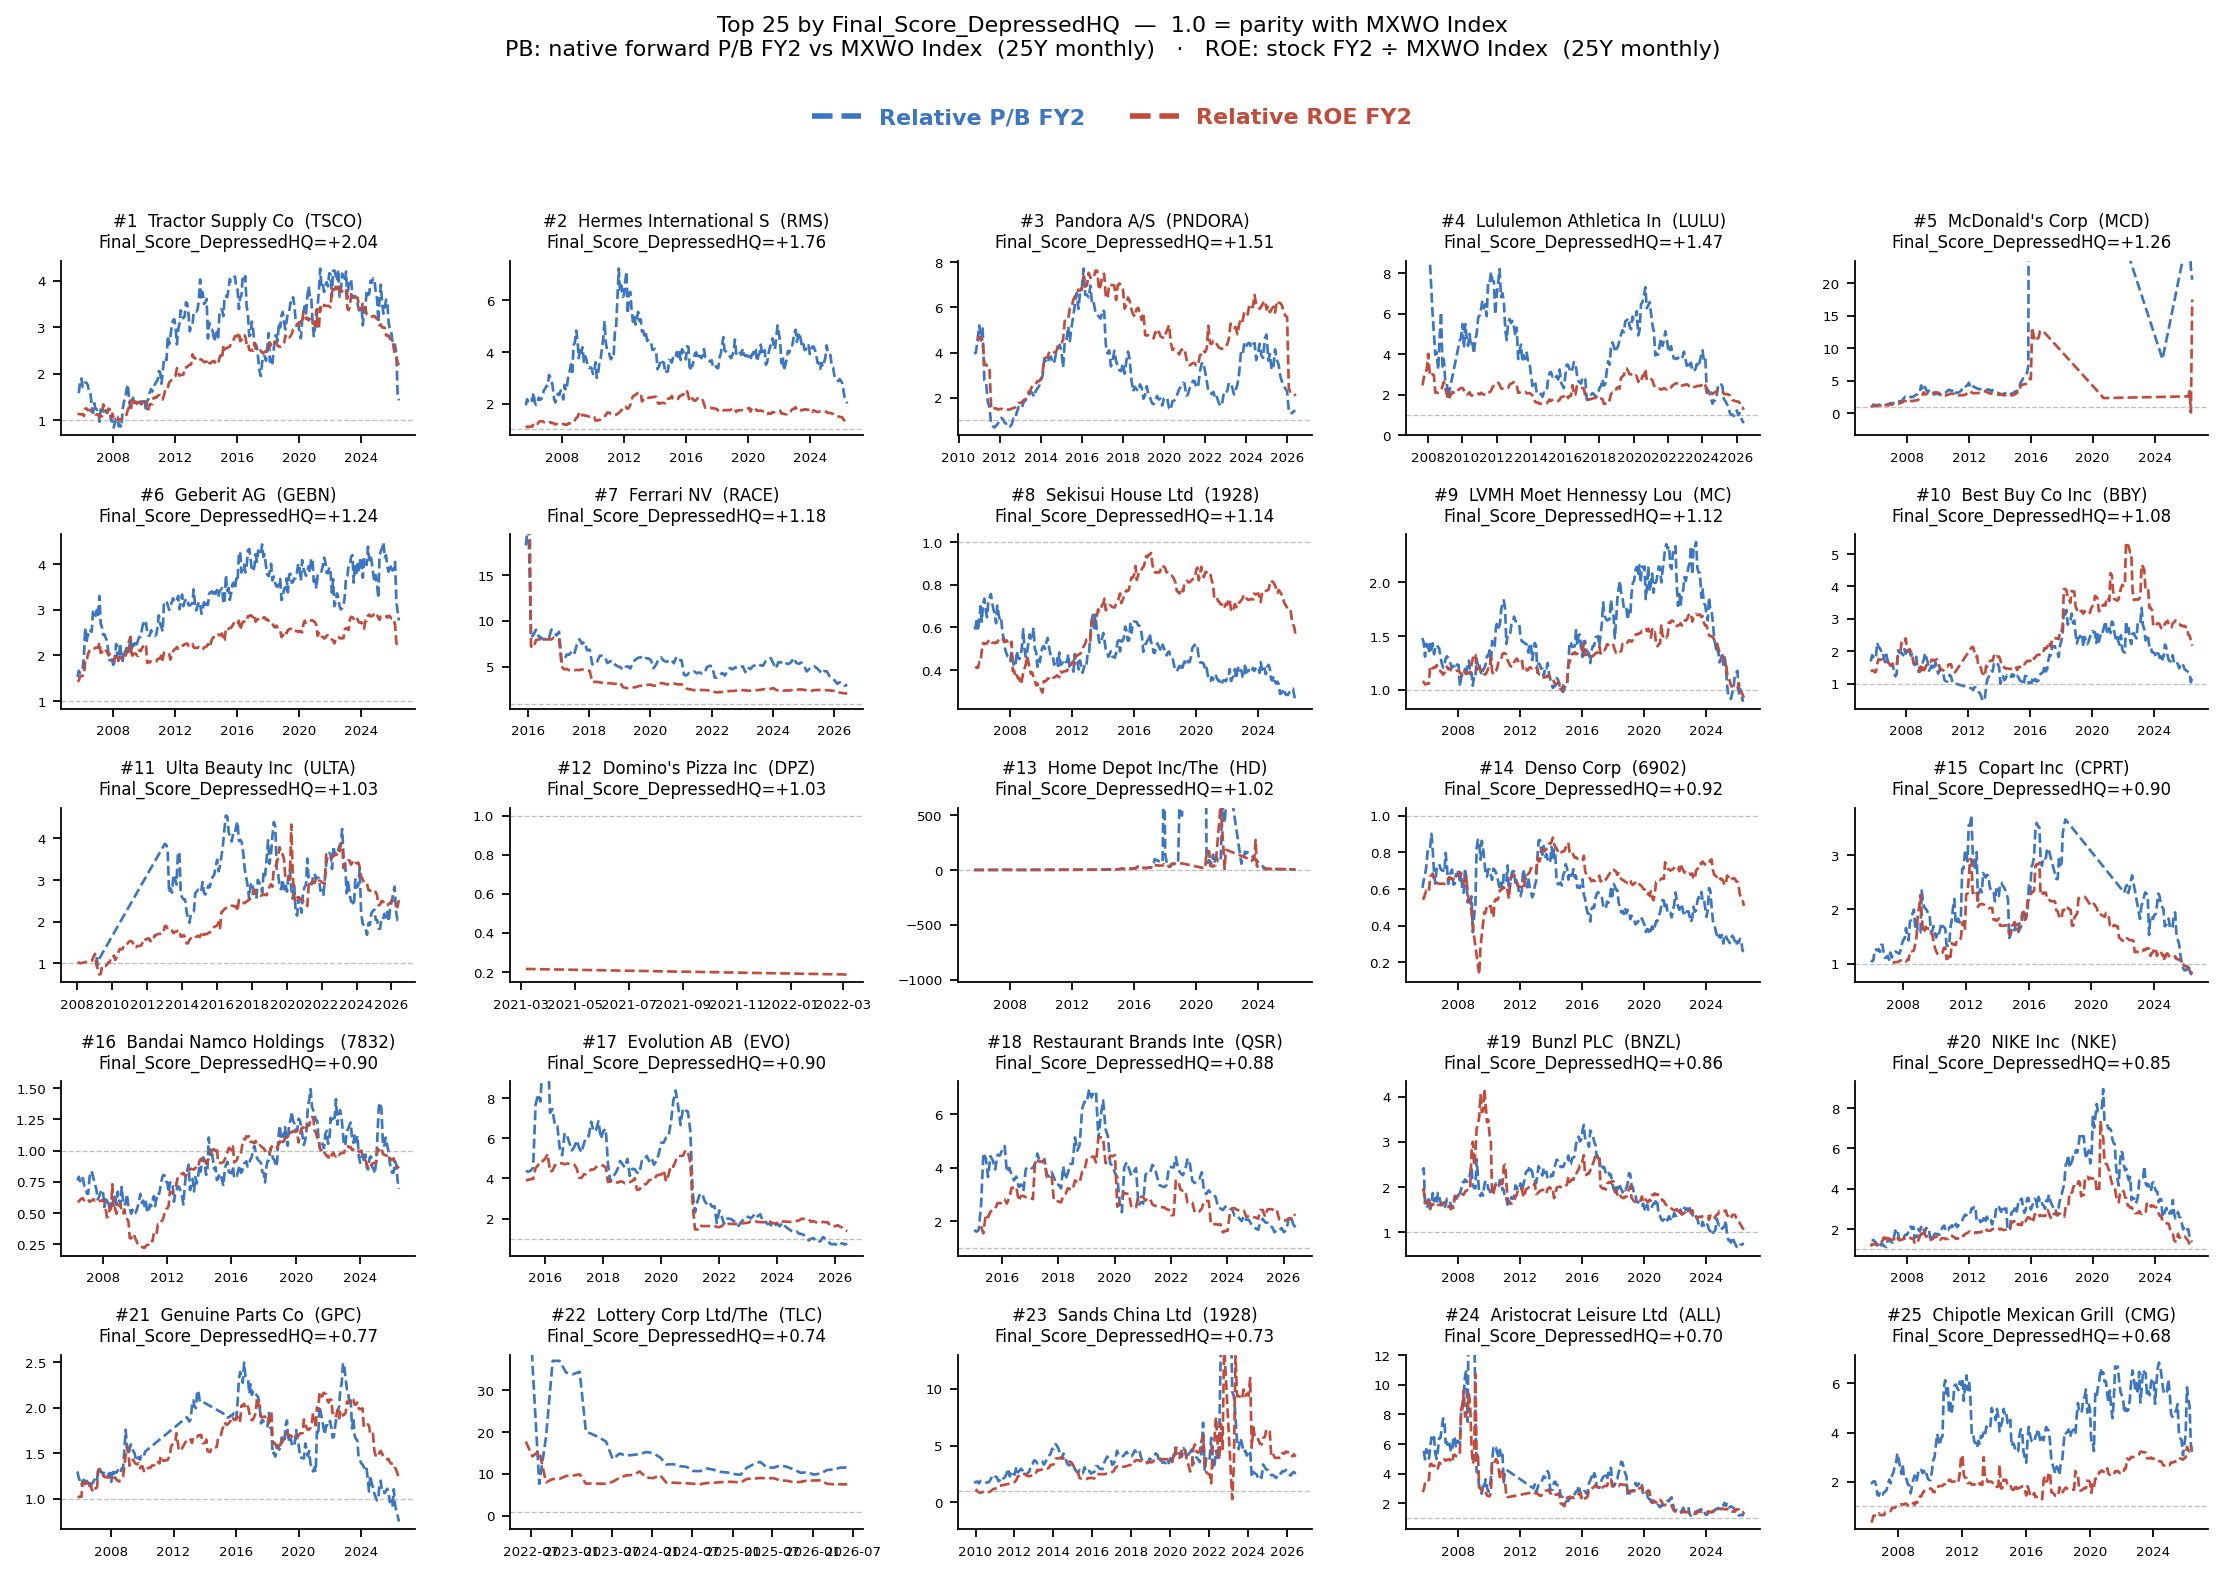
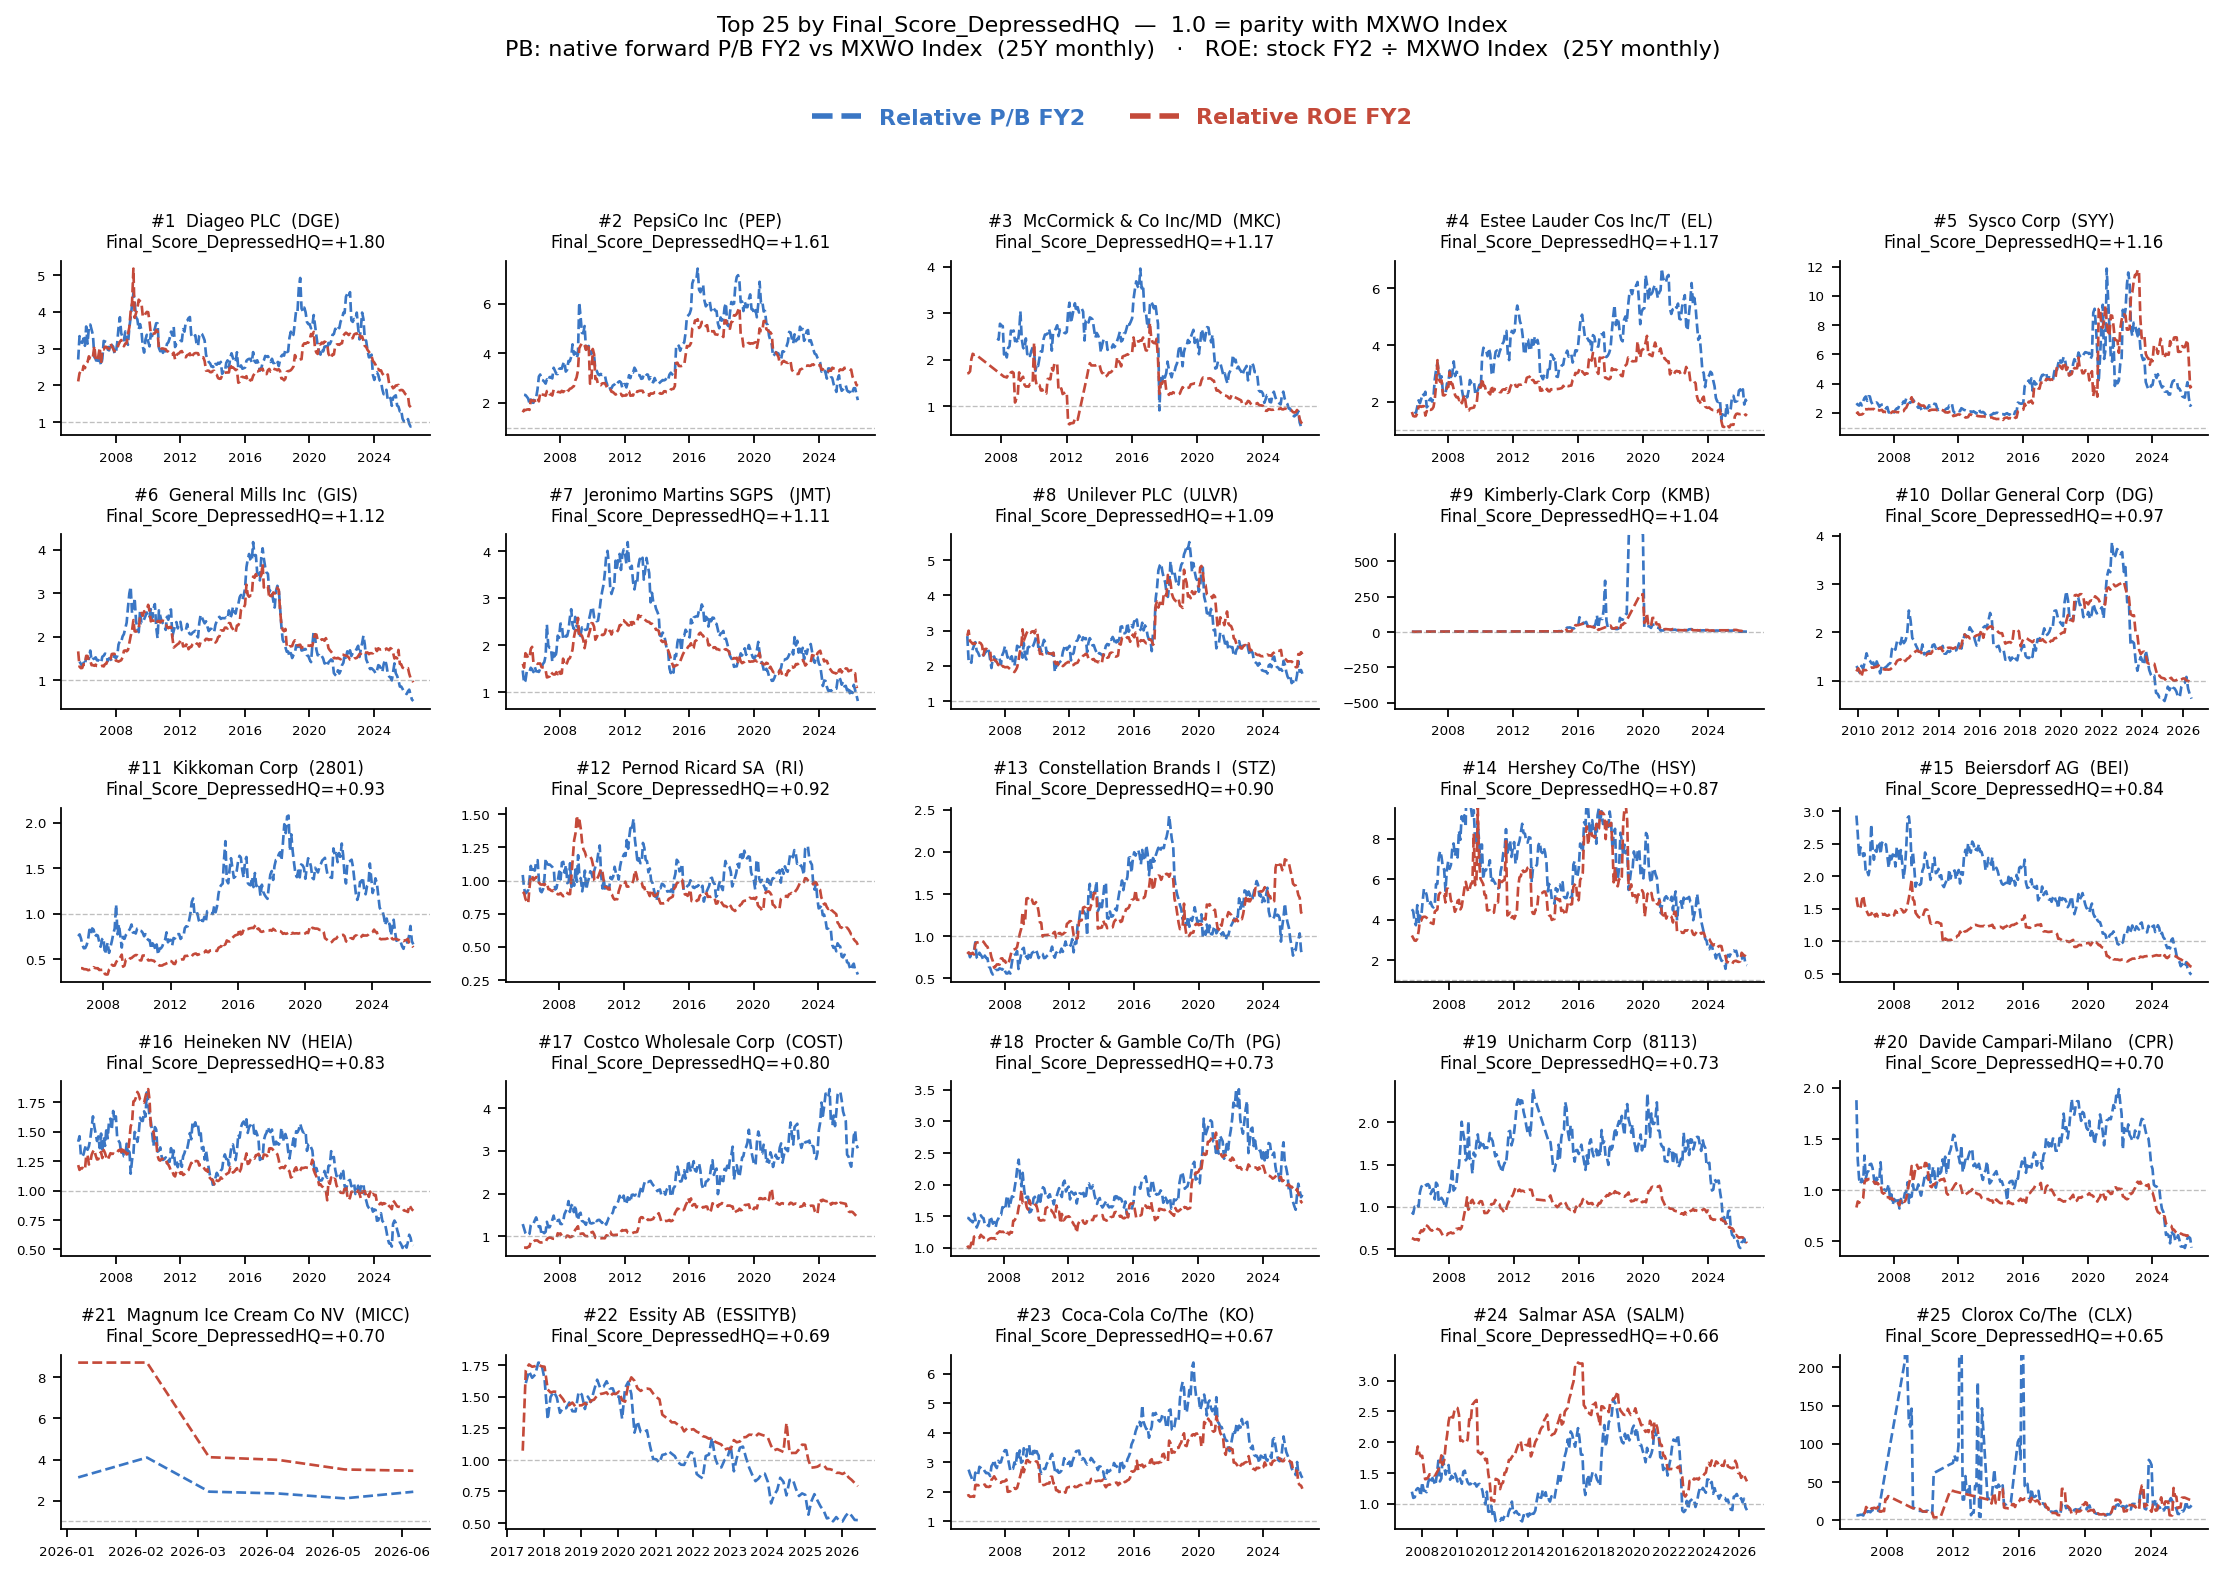
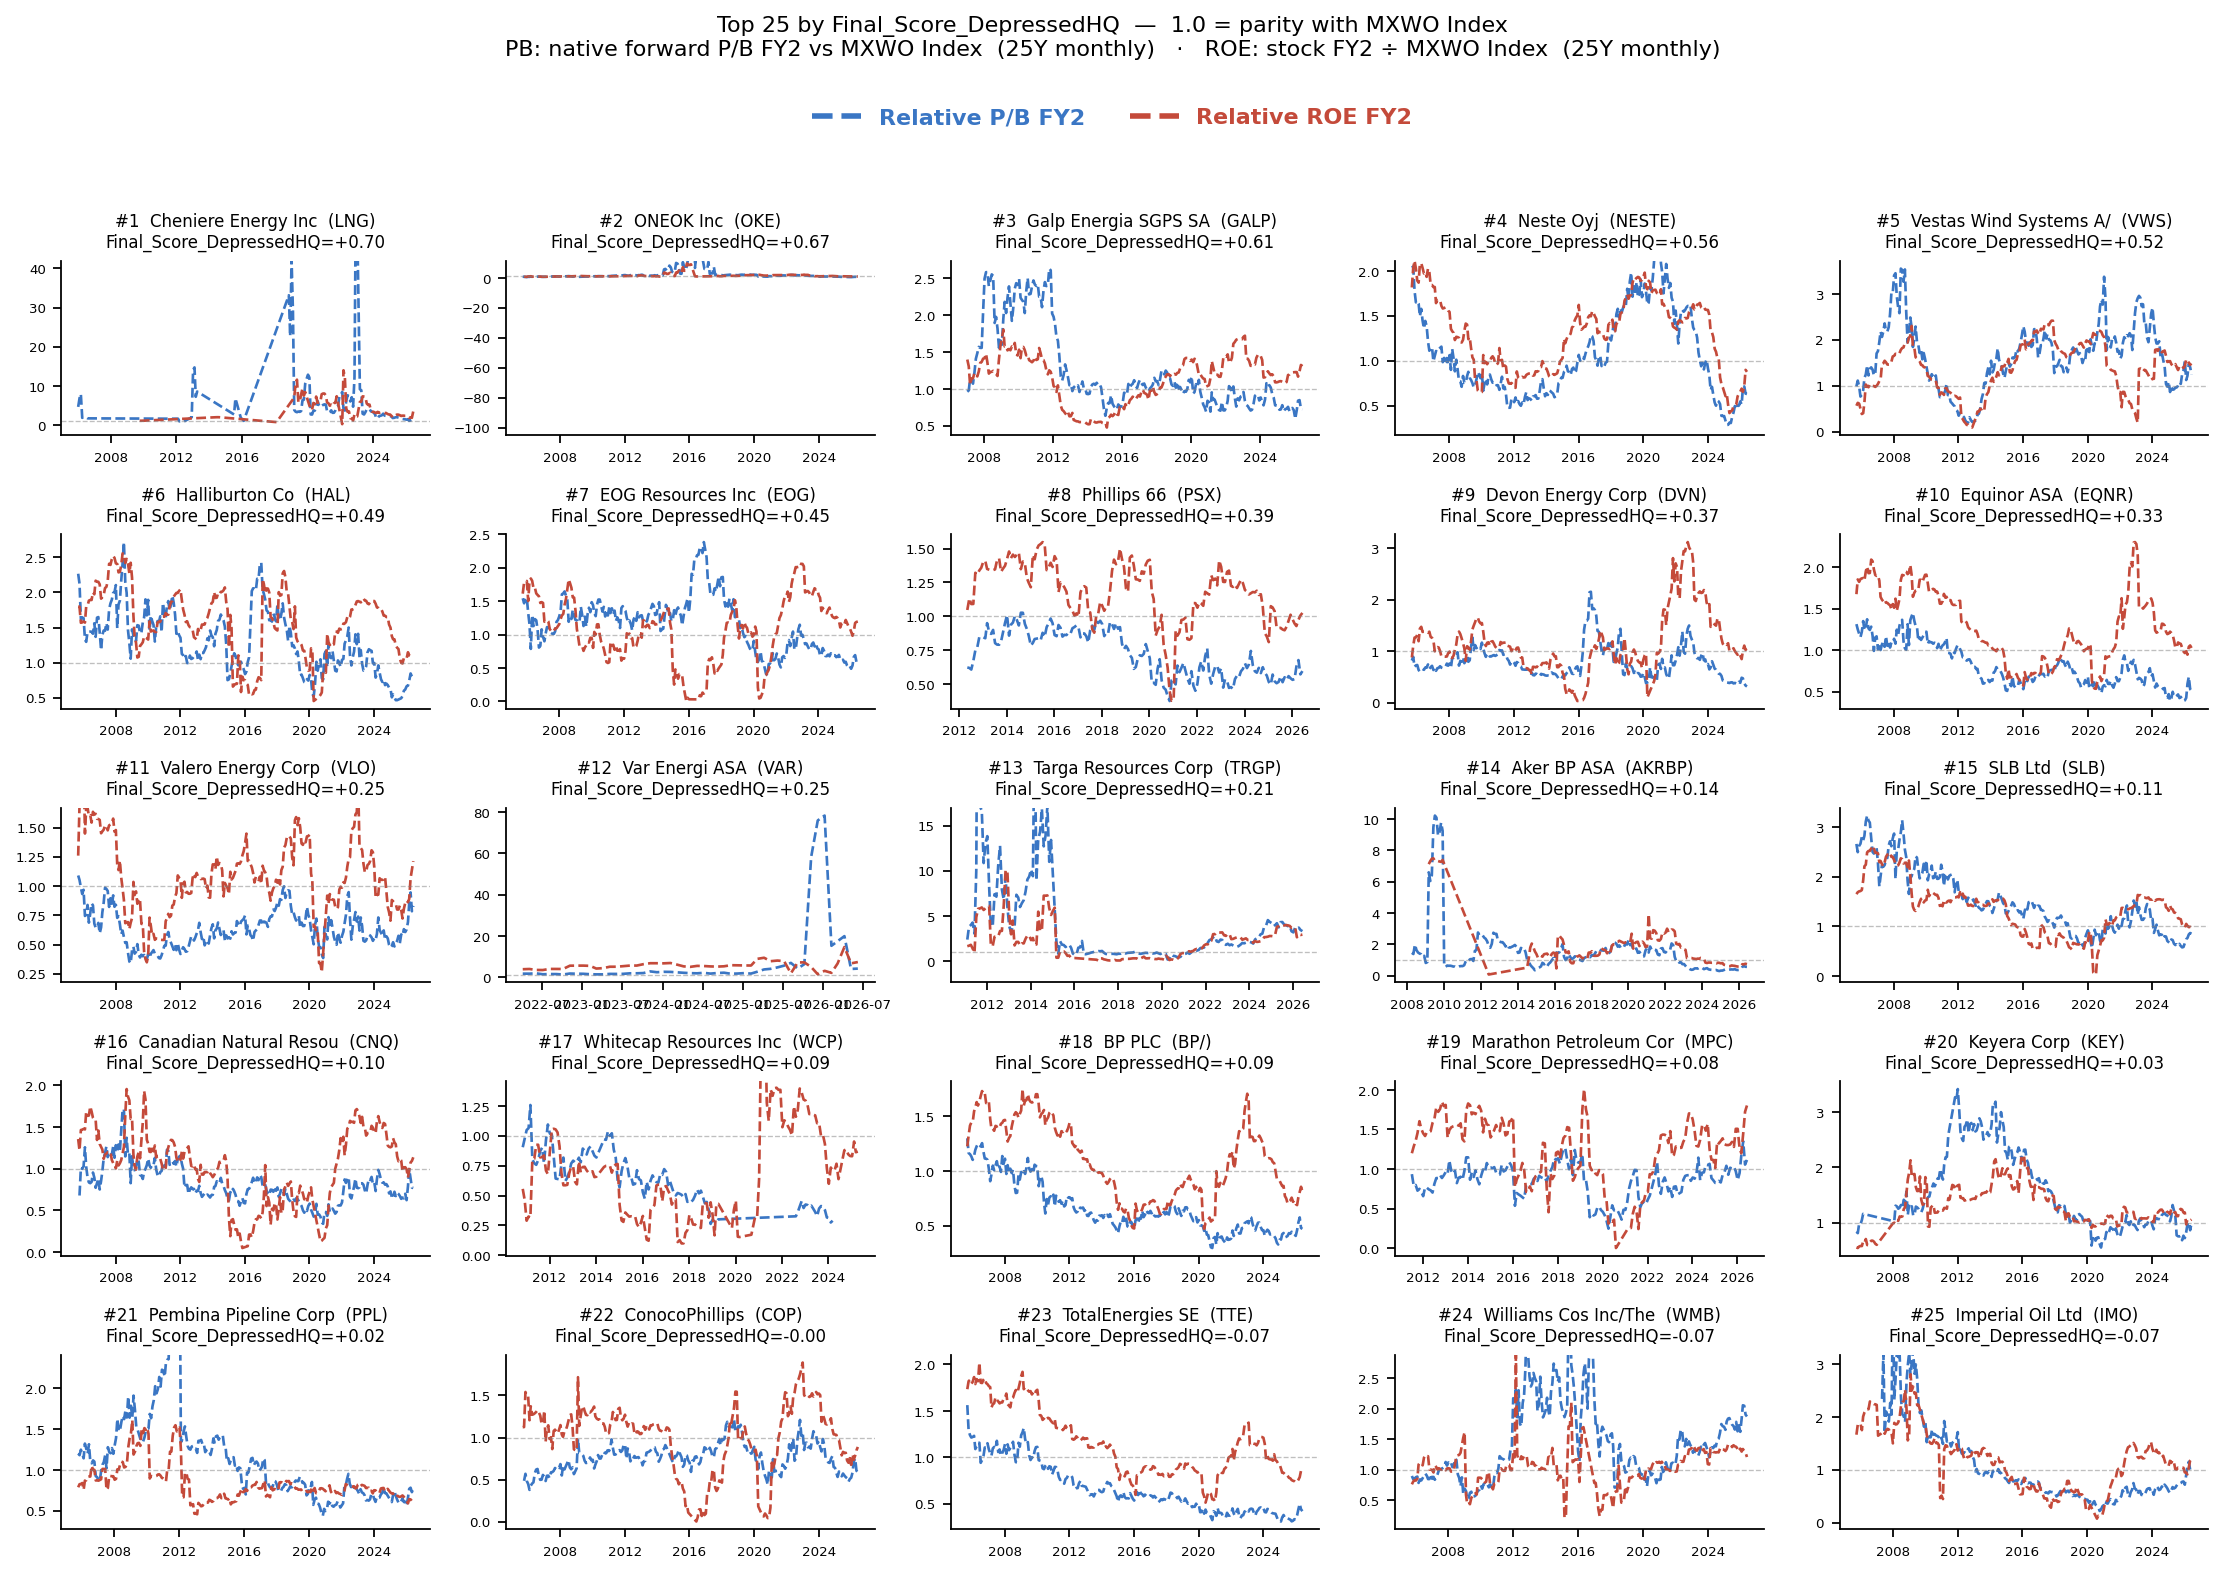
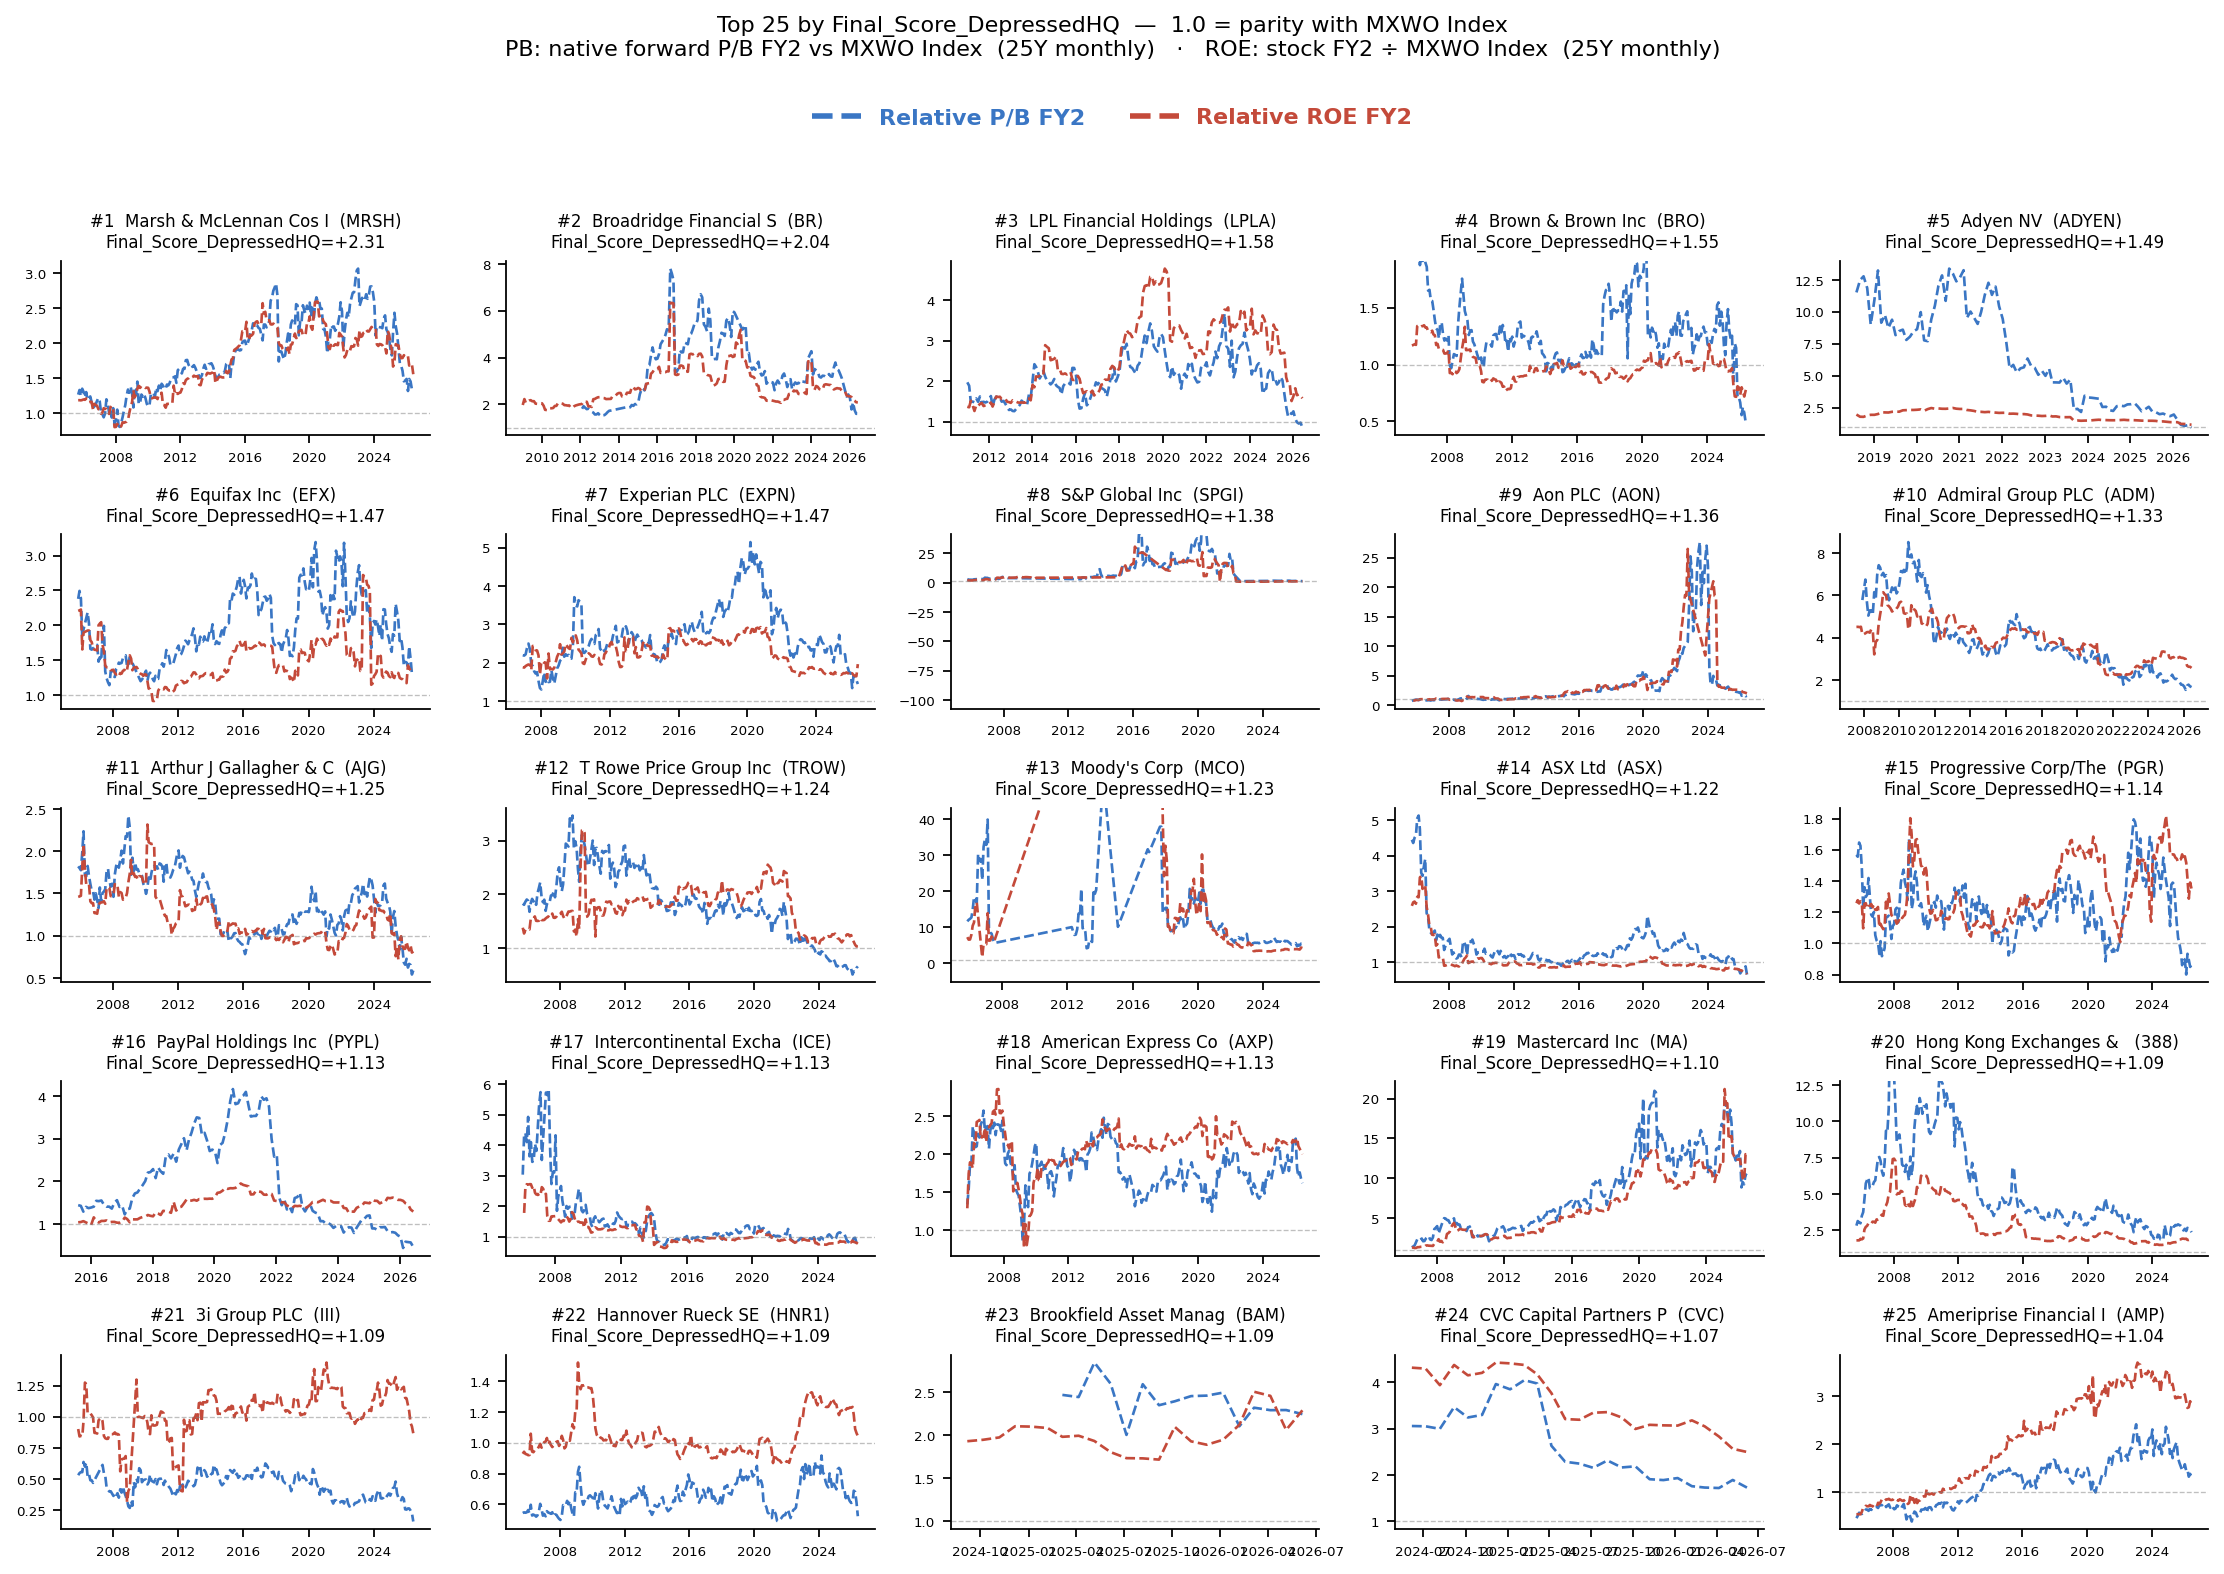
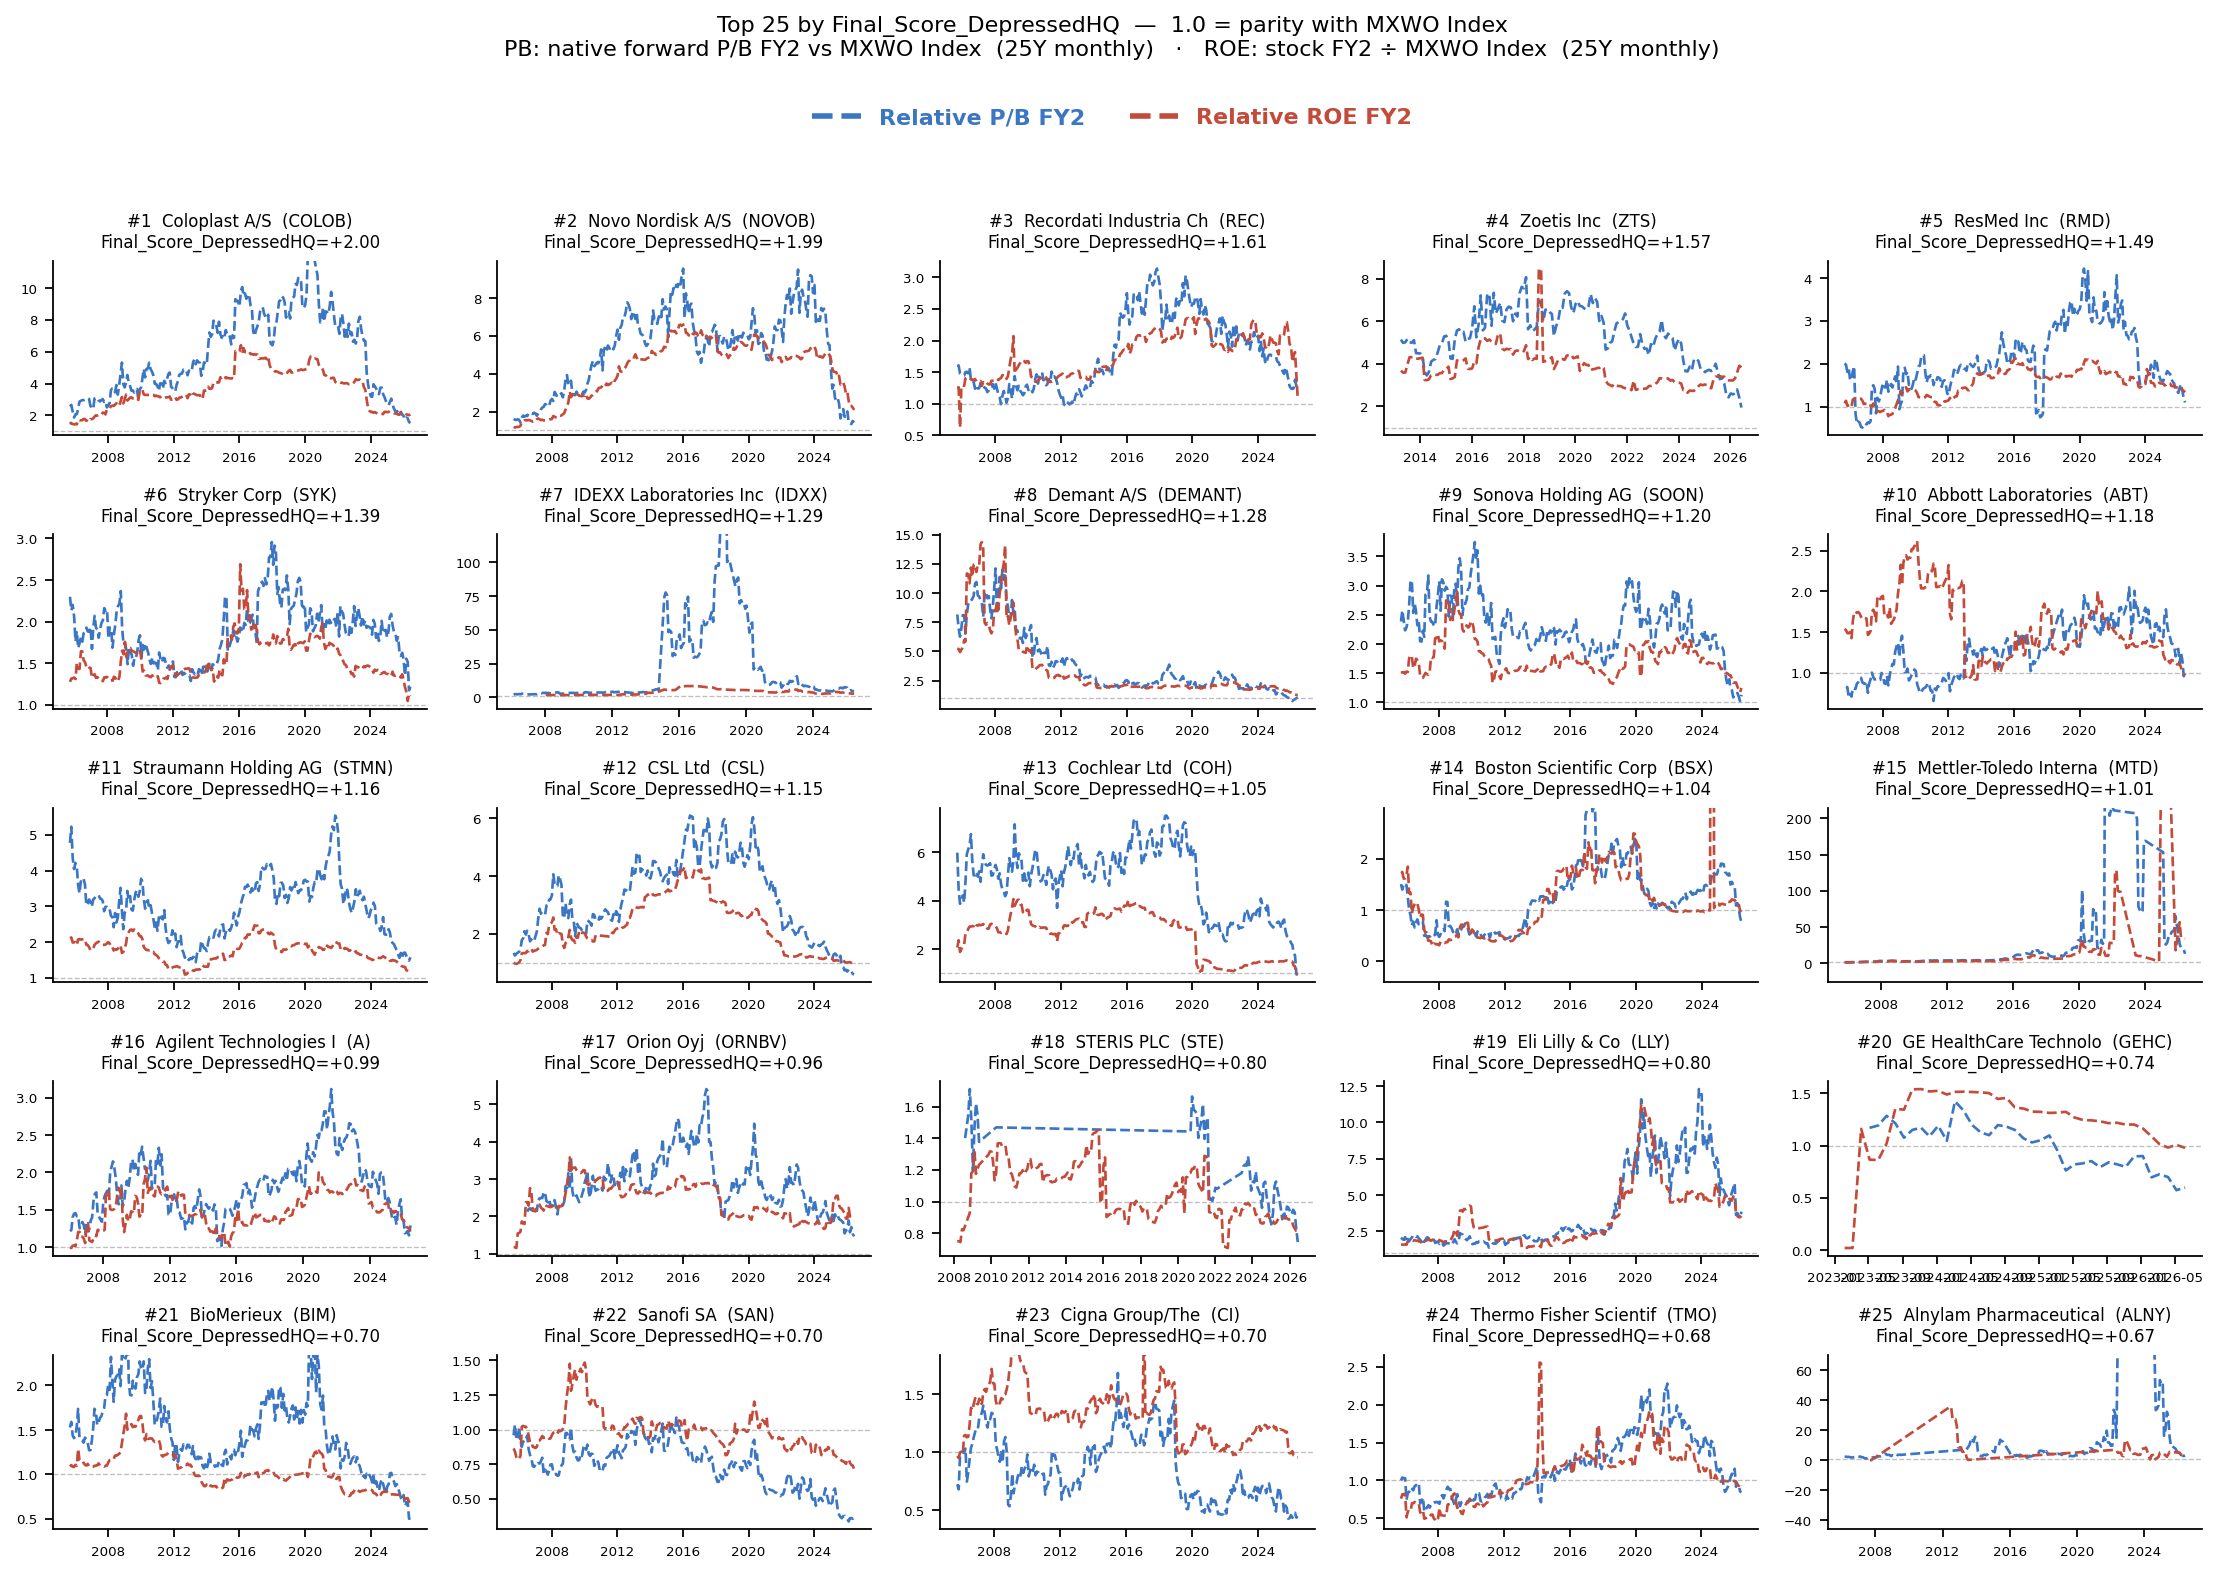
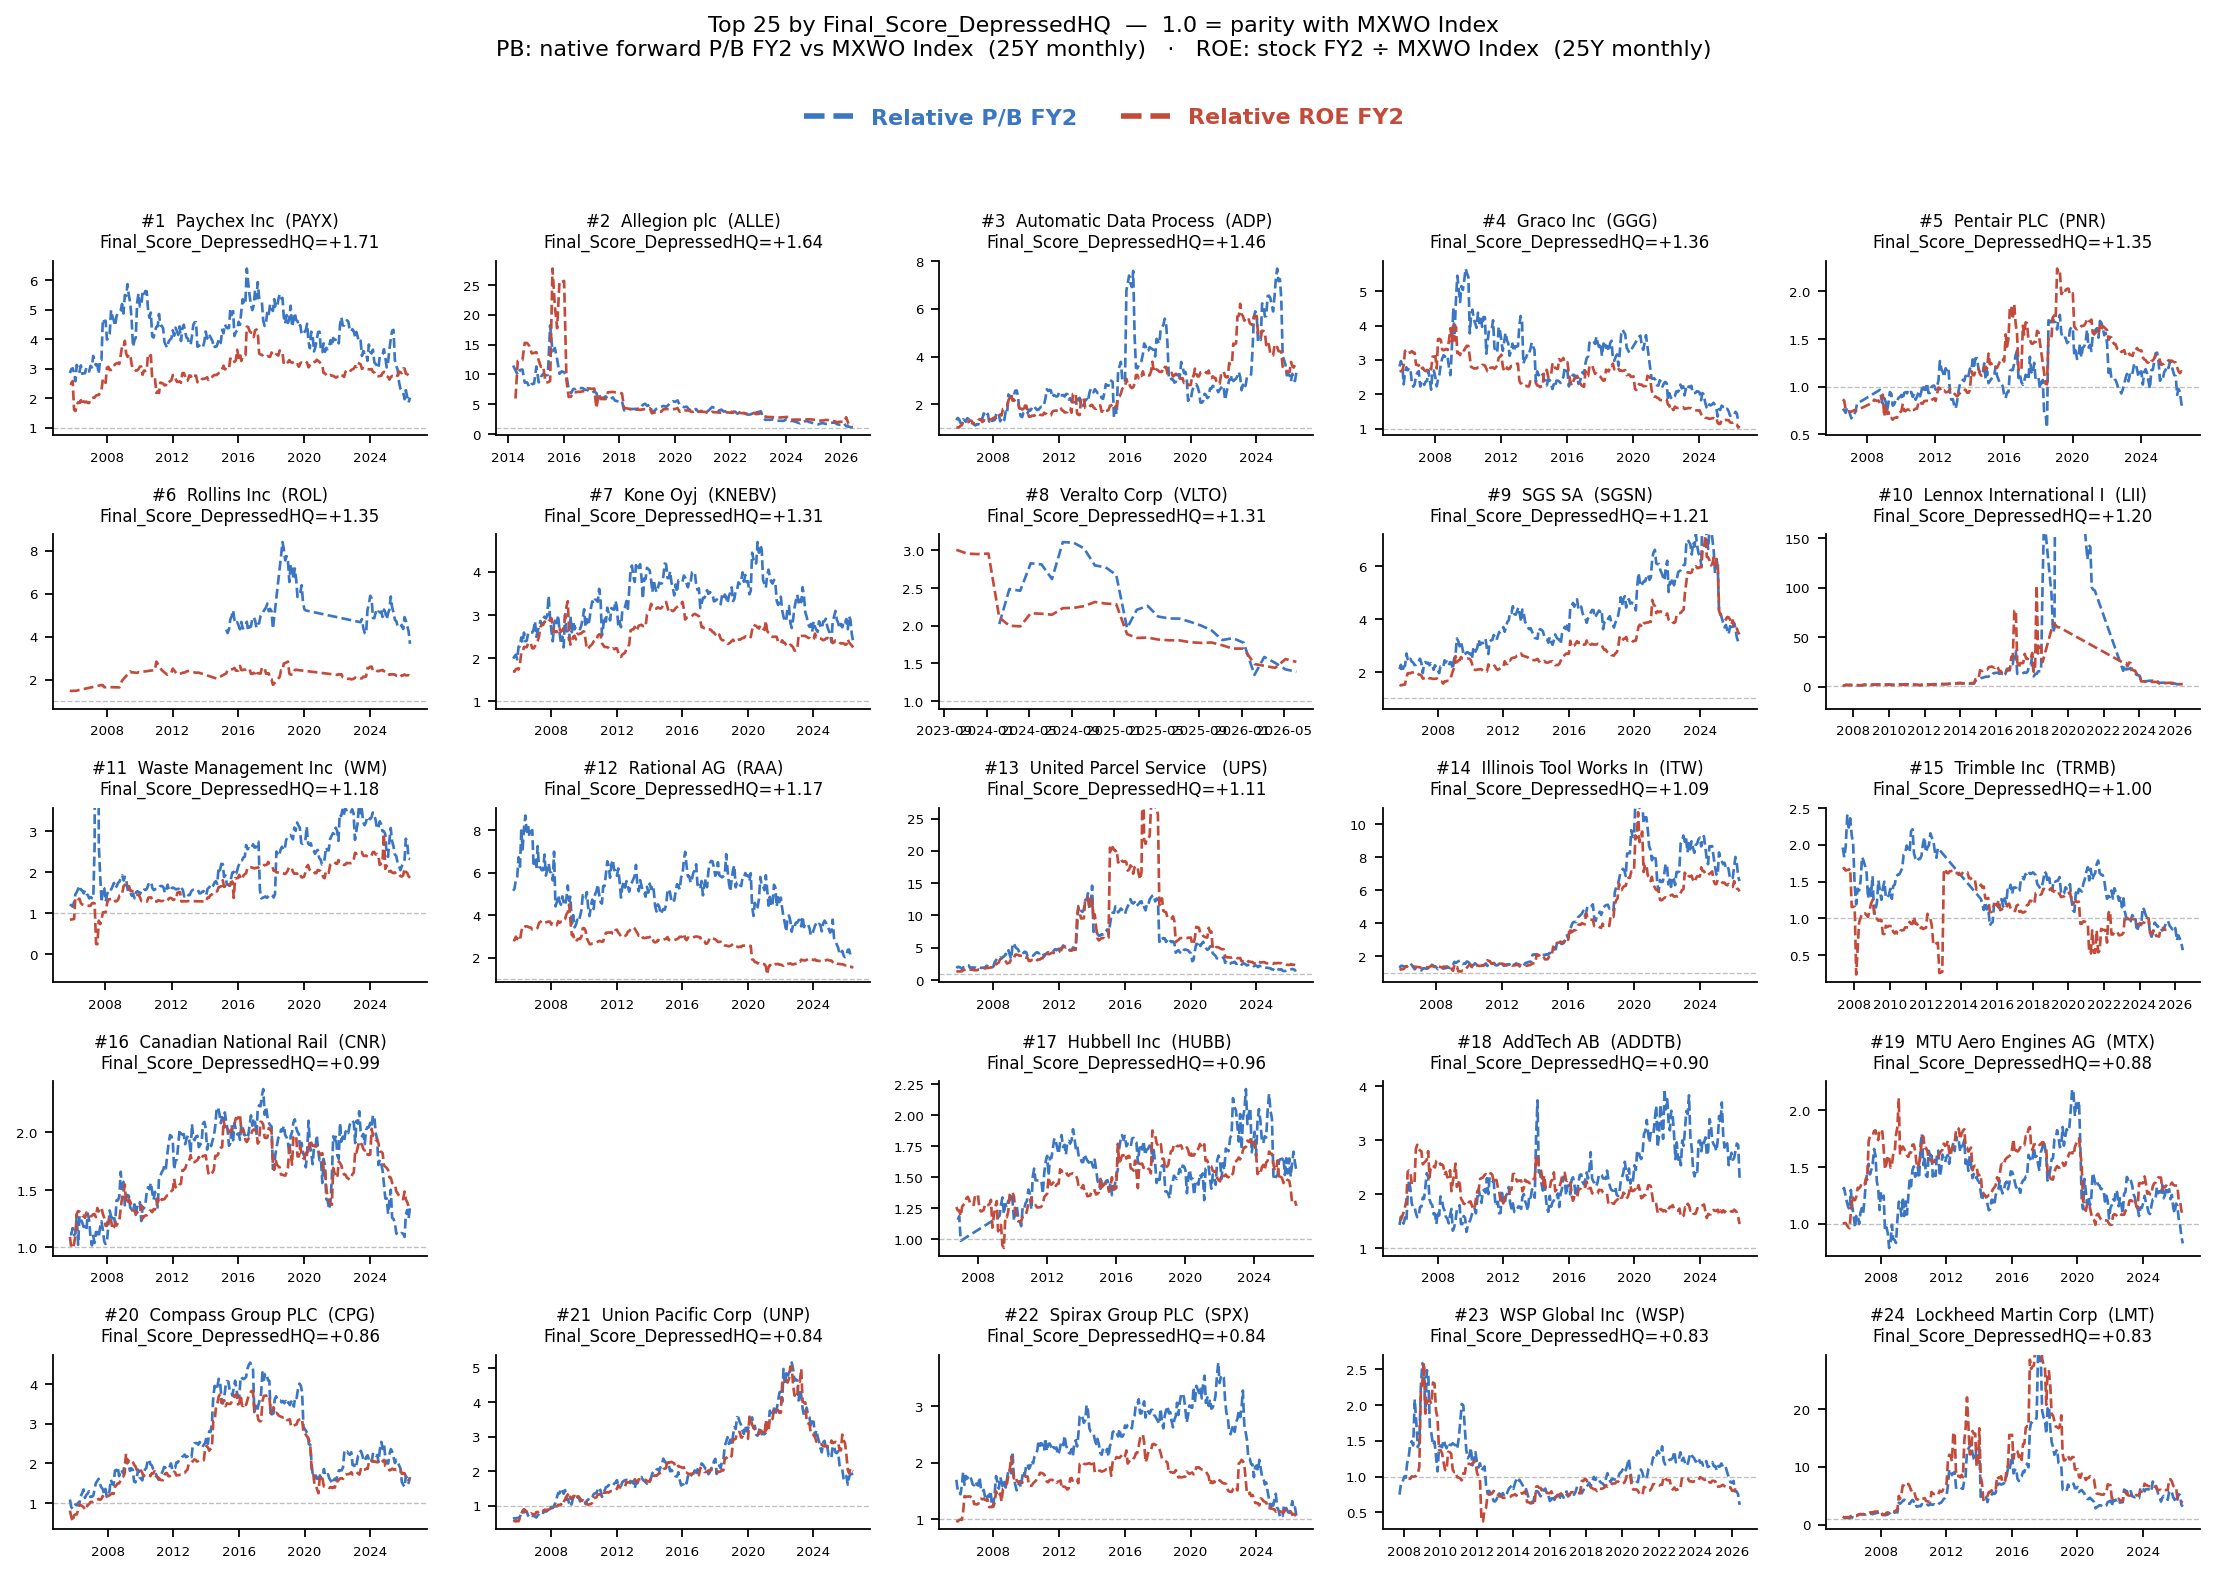
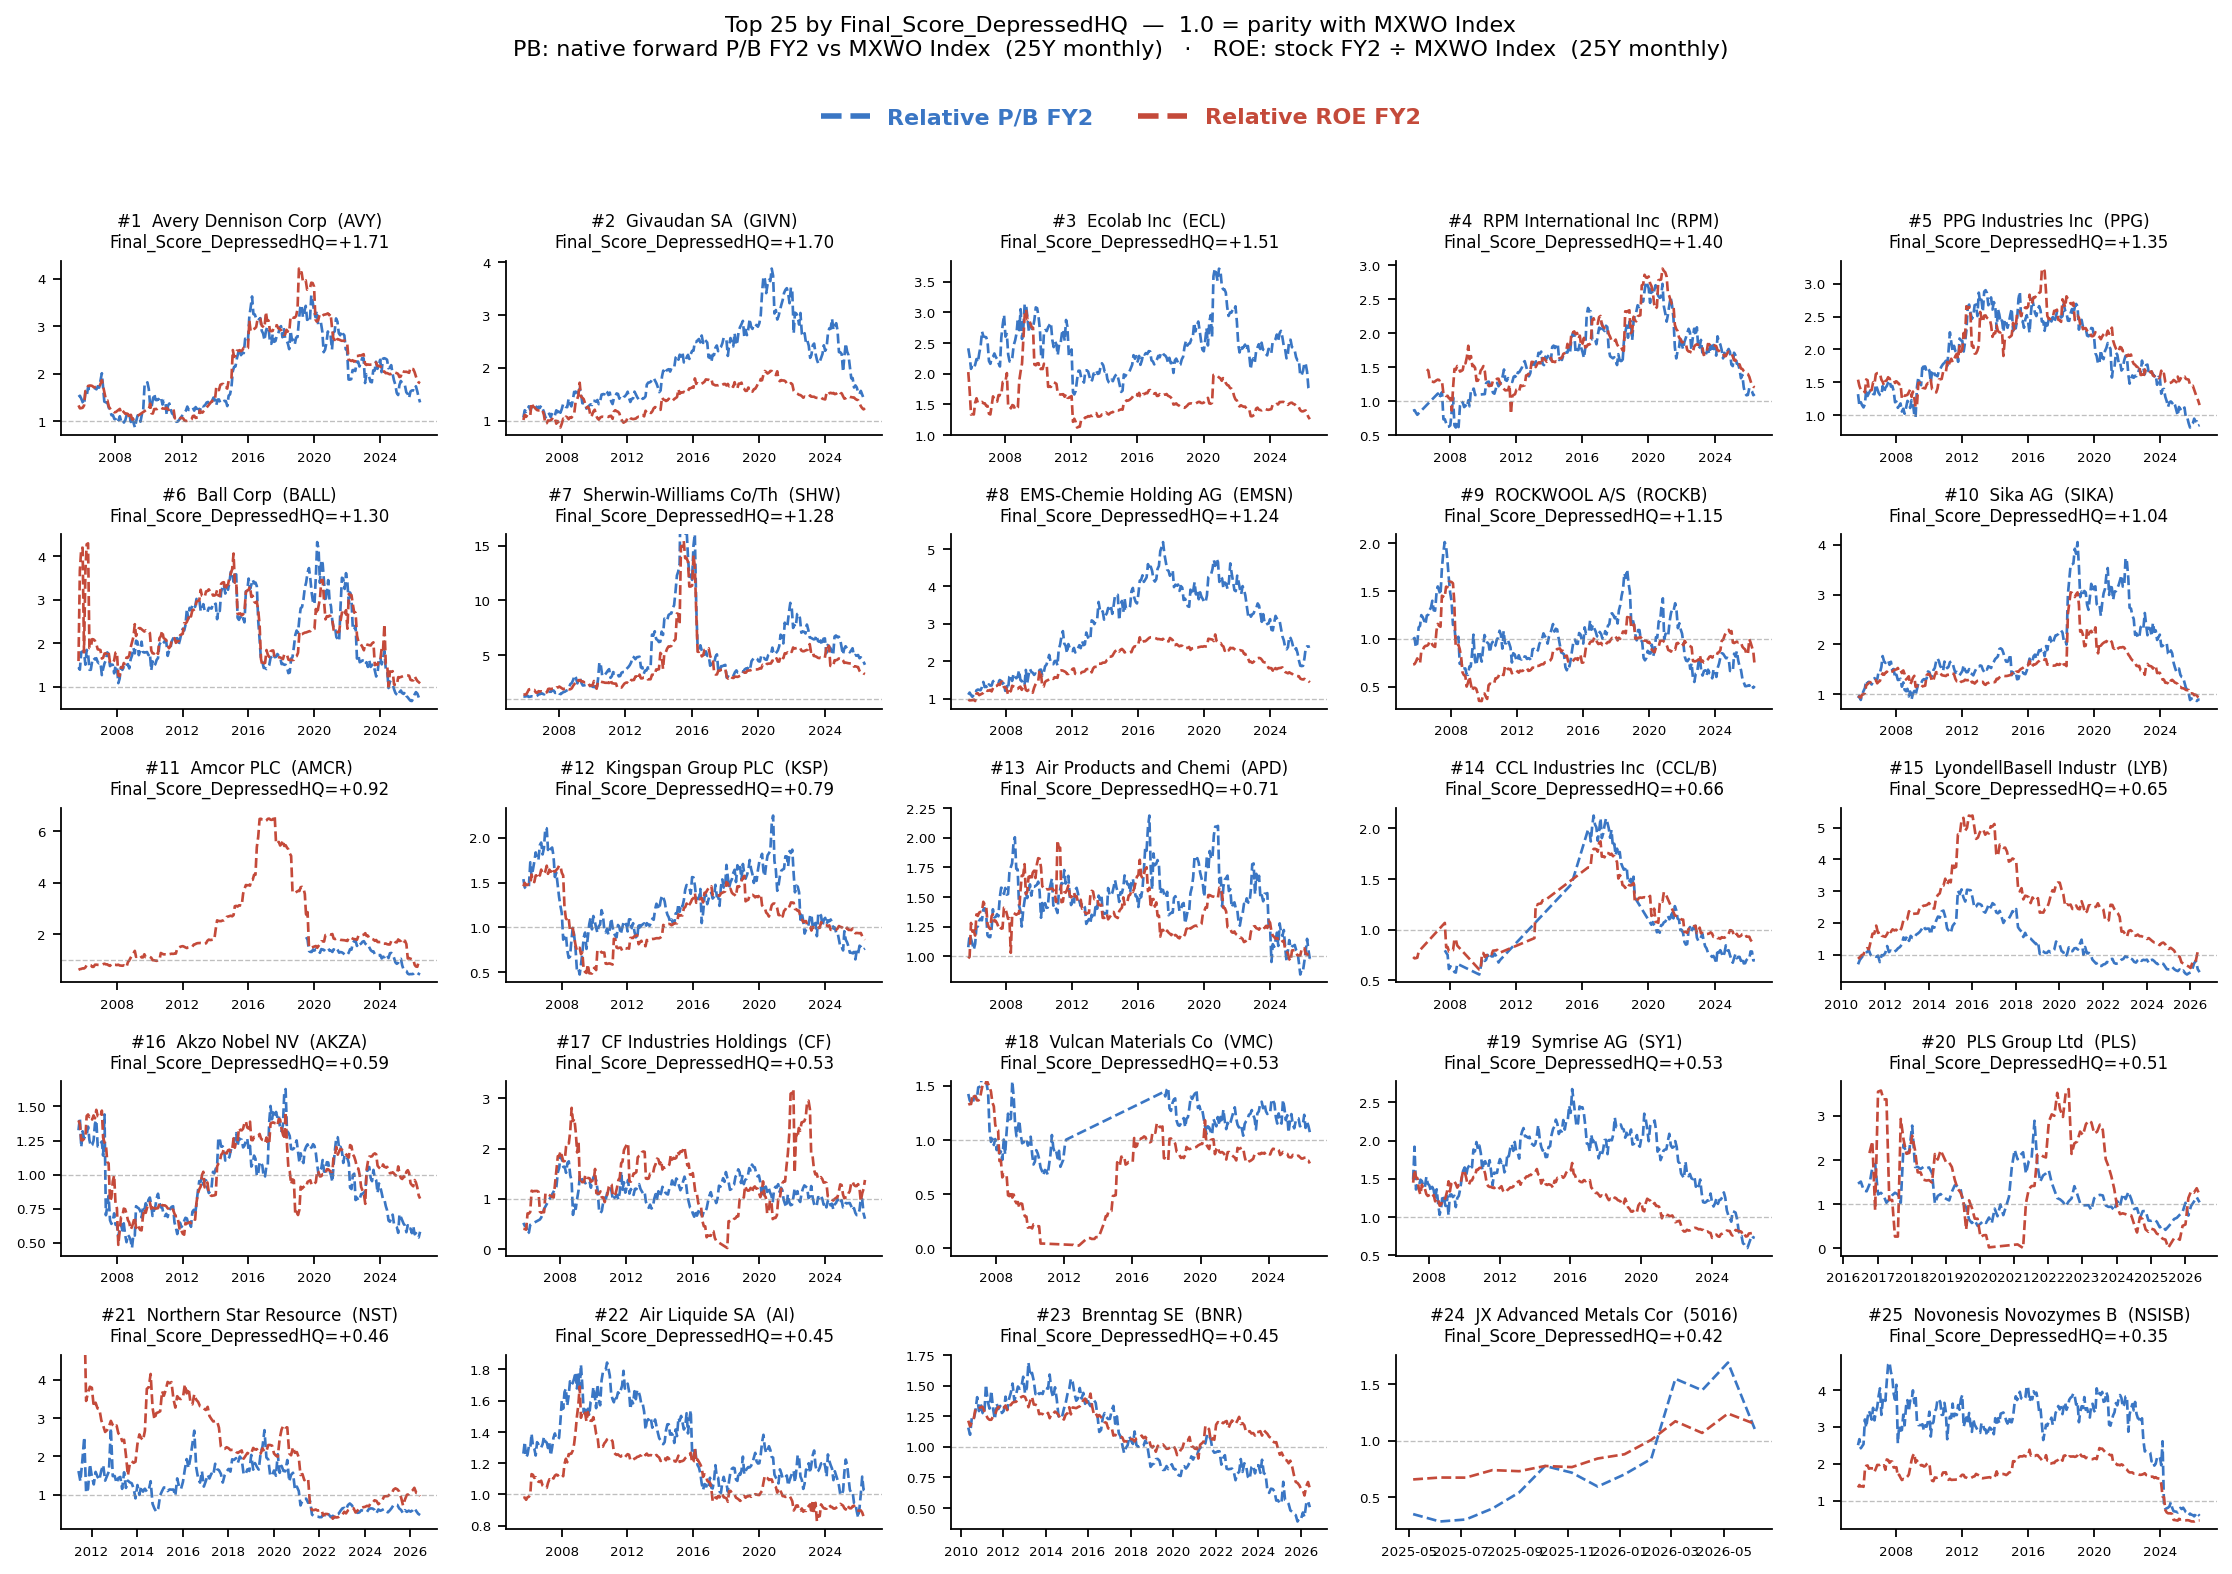
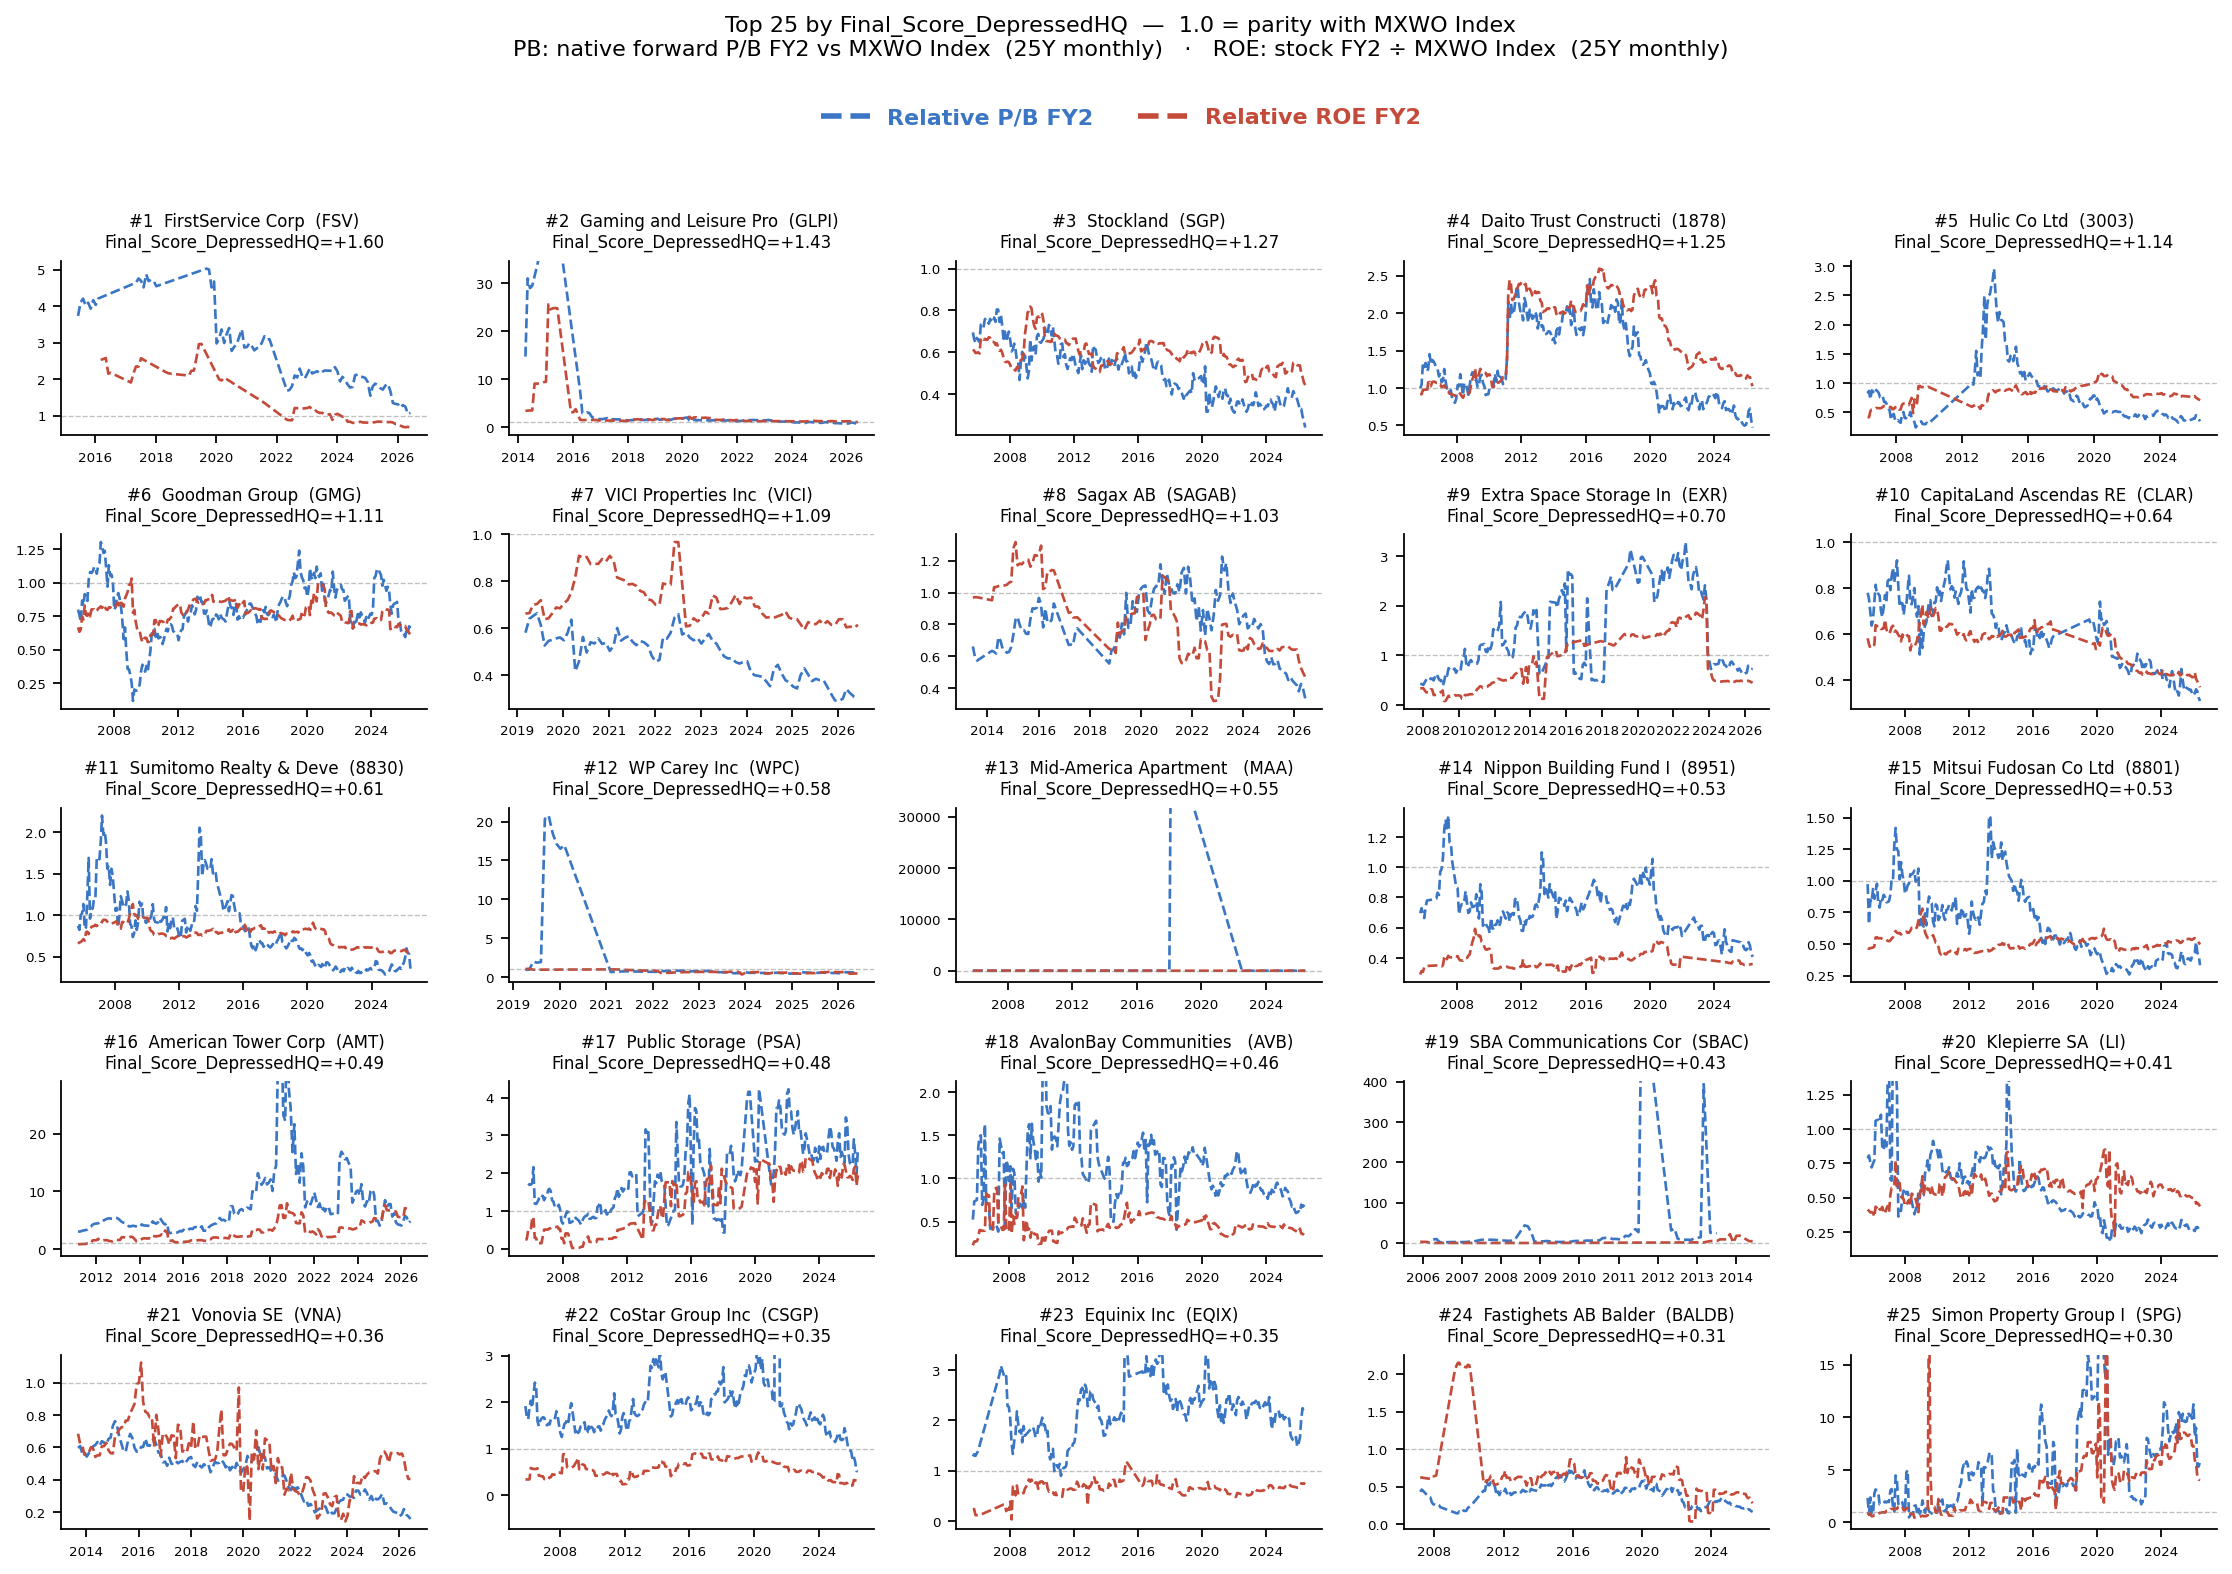
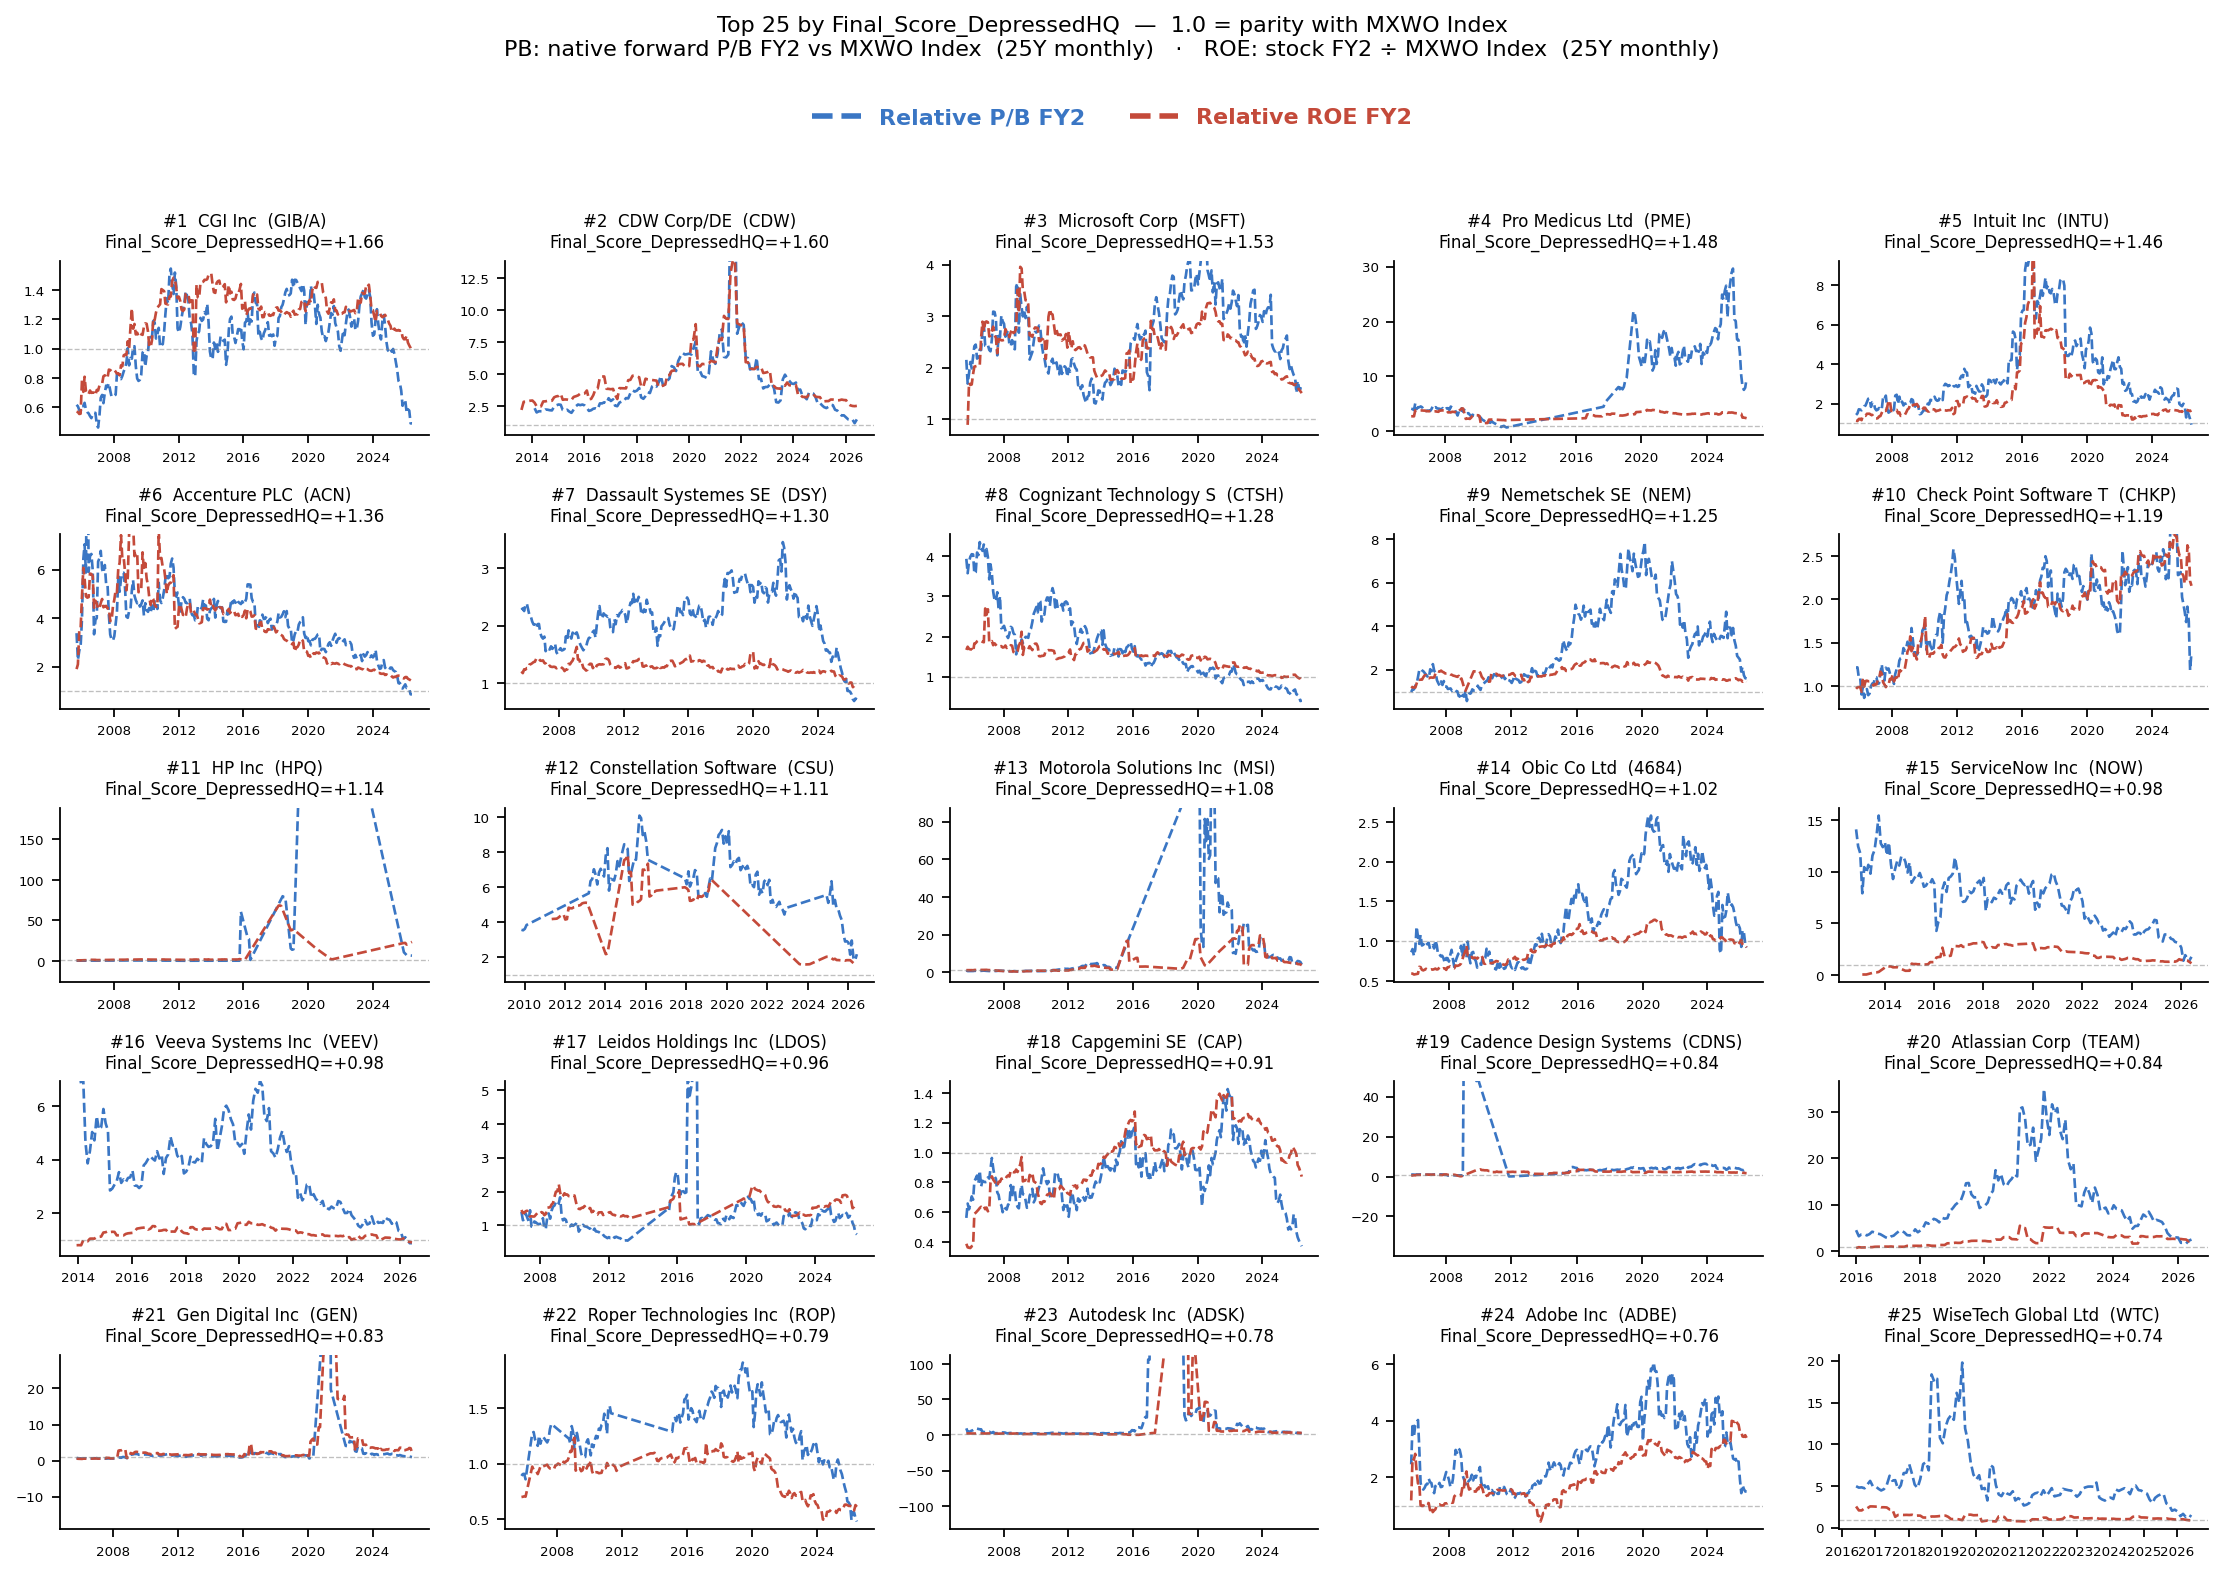
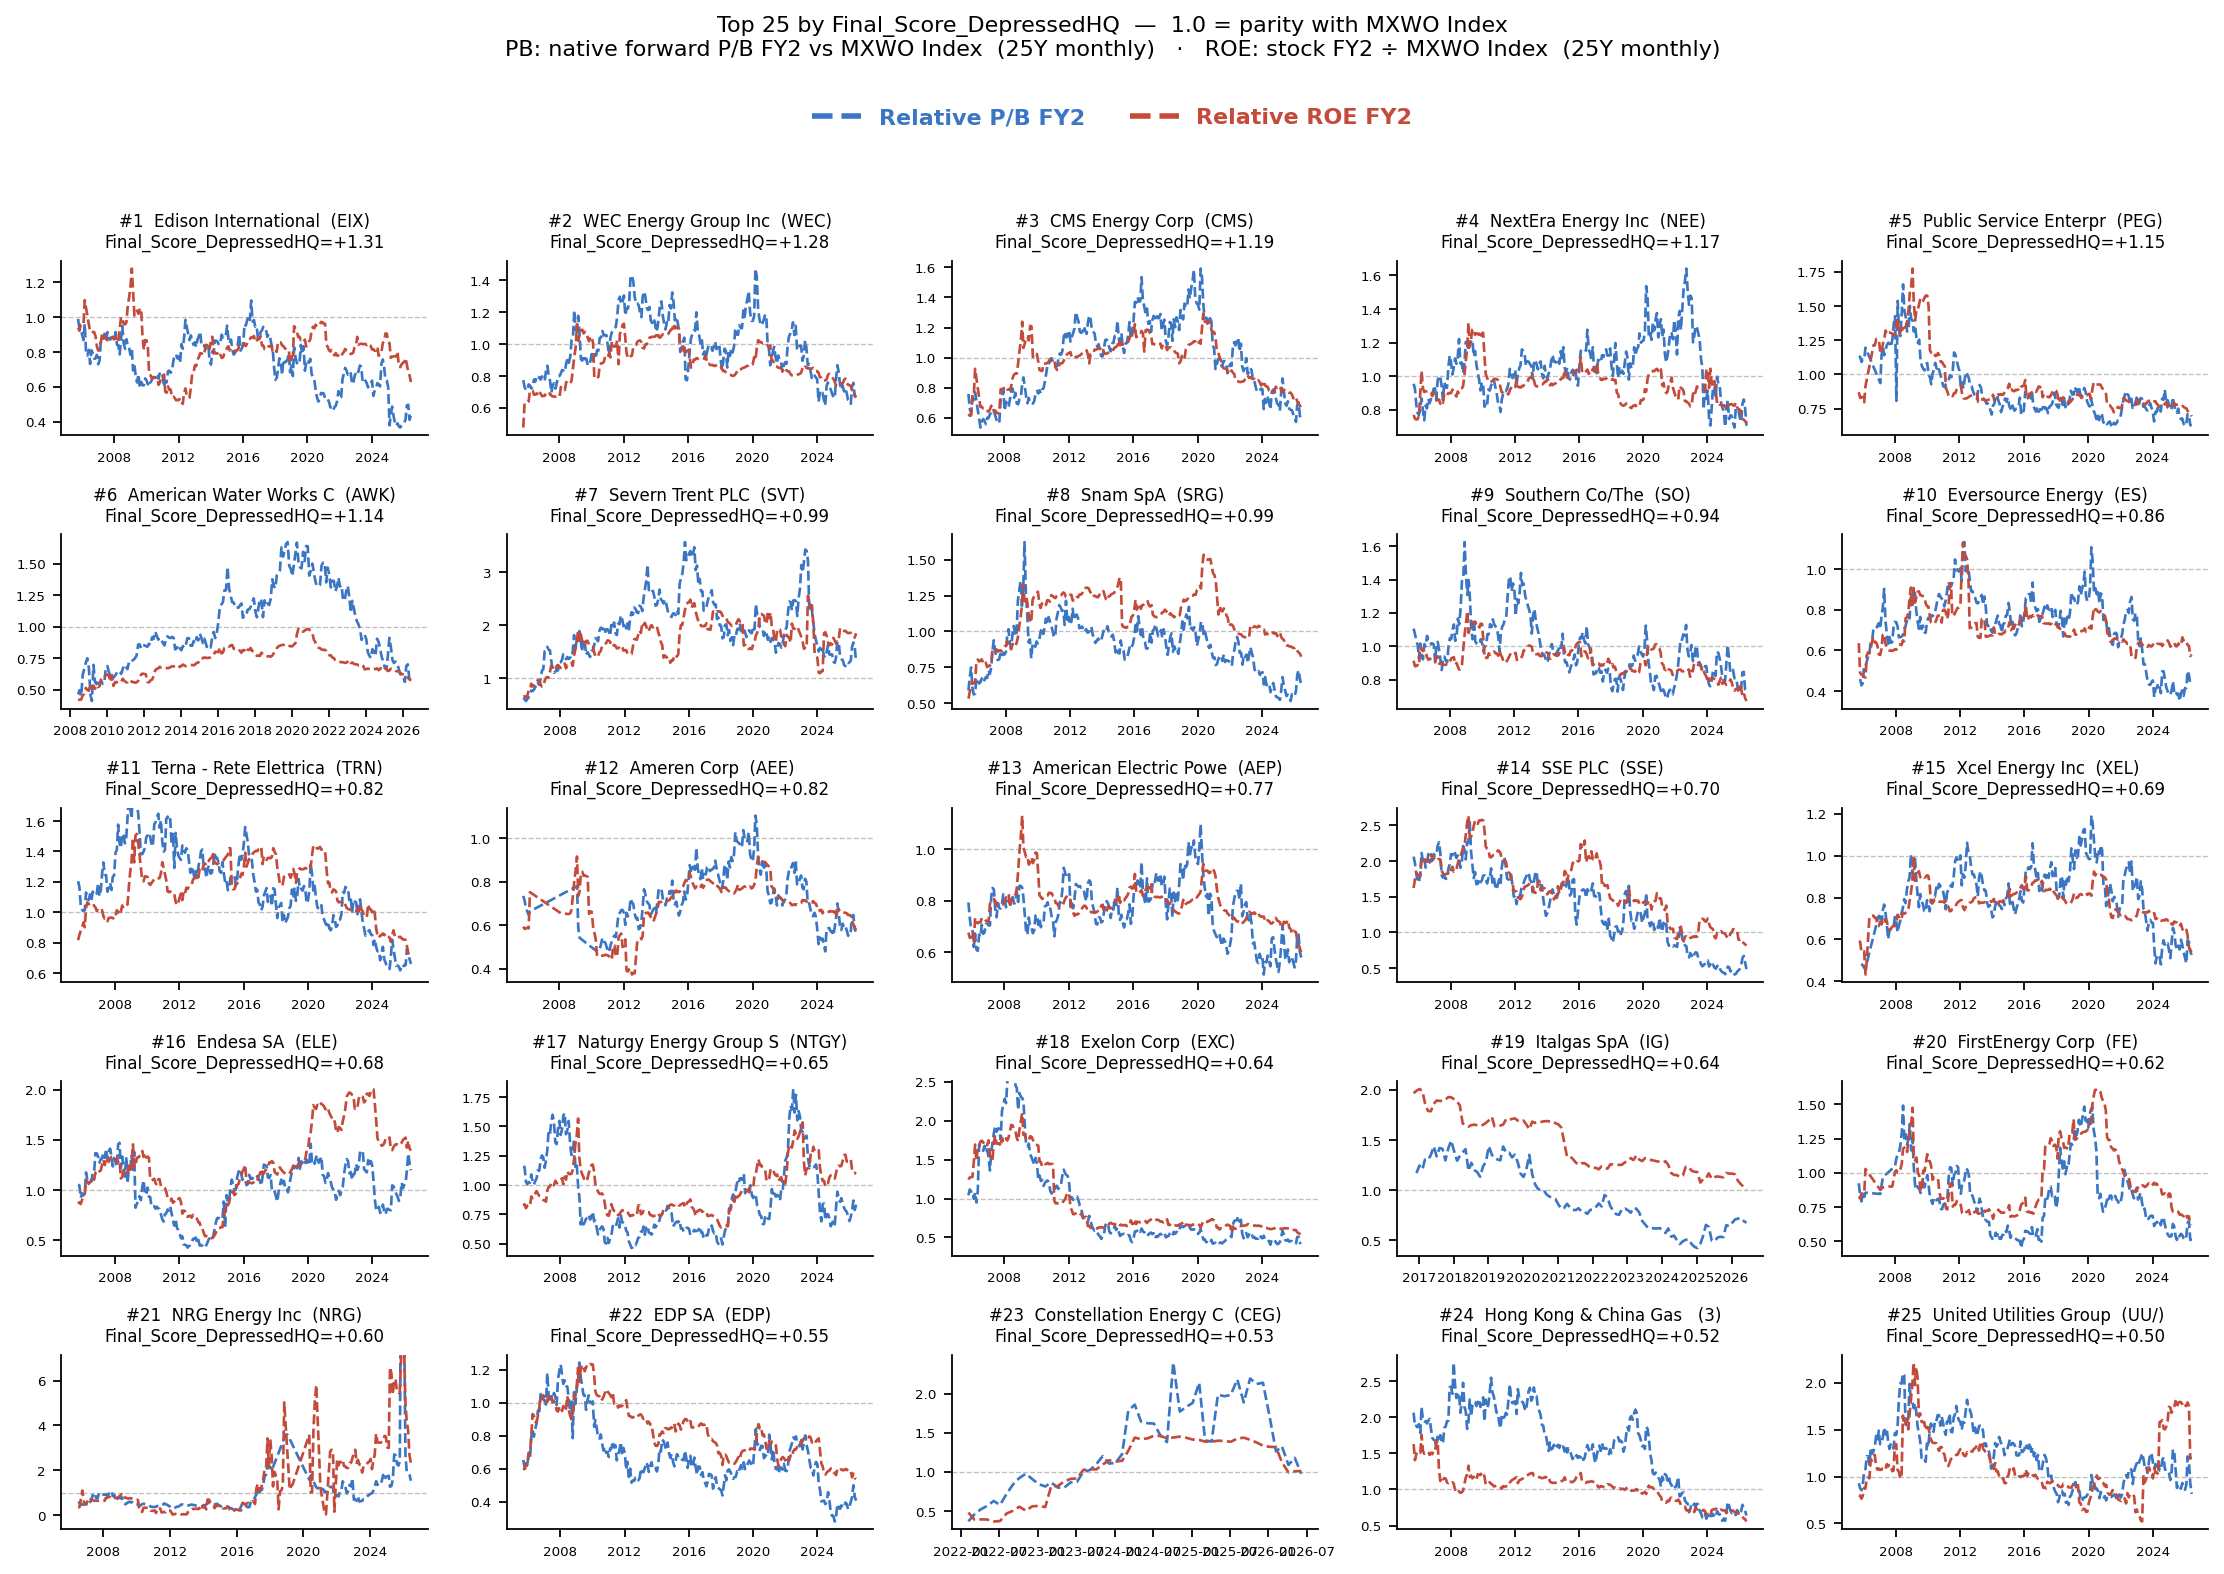
Top 100 Relative PB / Relative ROE FY2 Panels
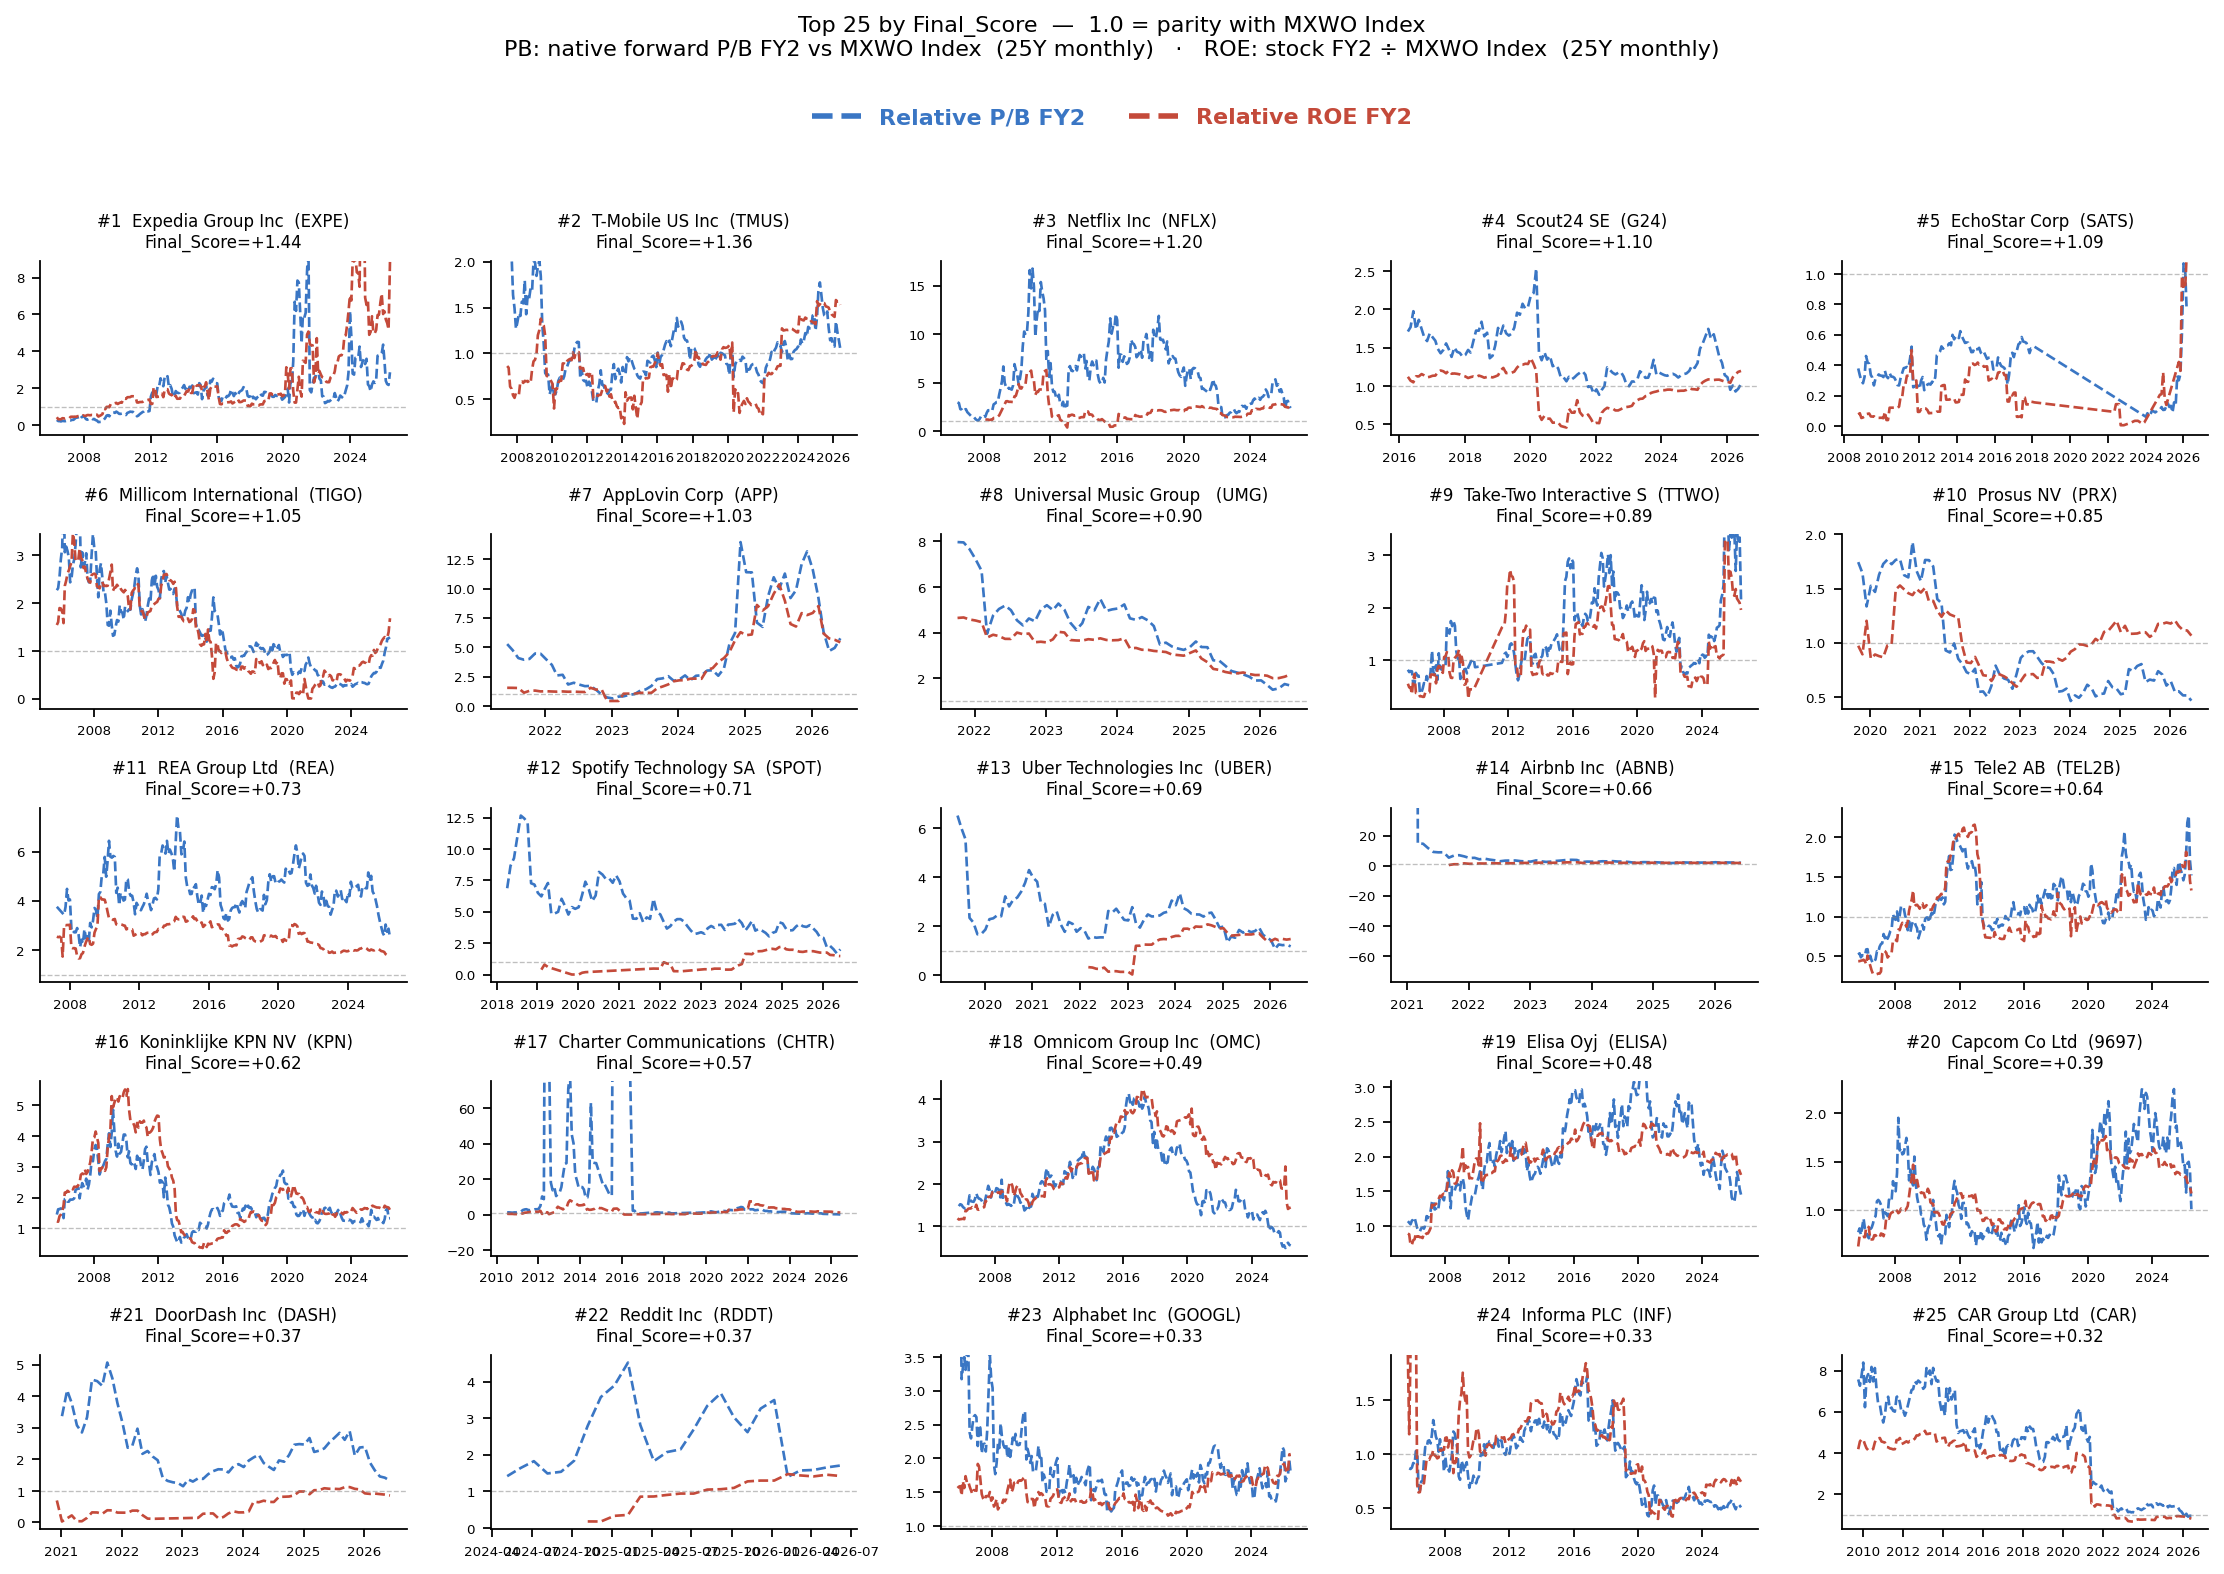
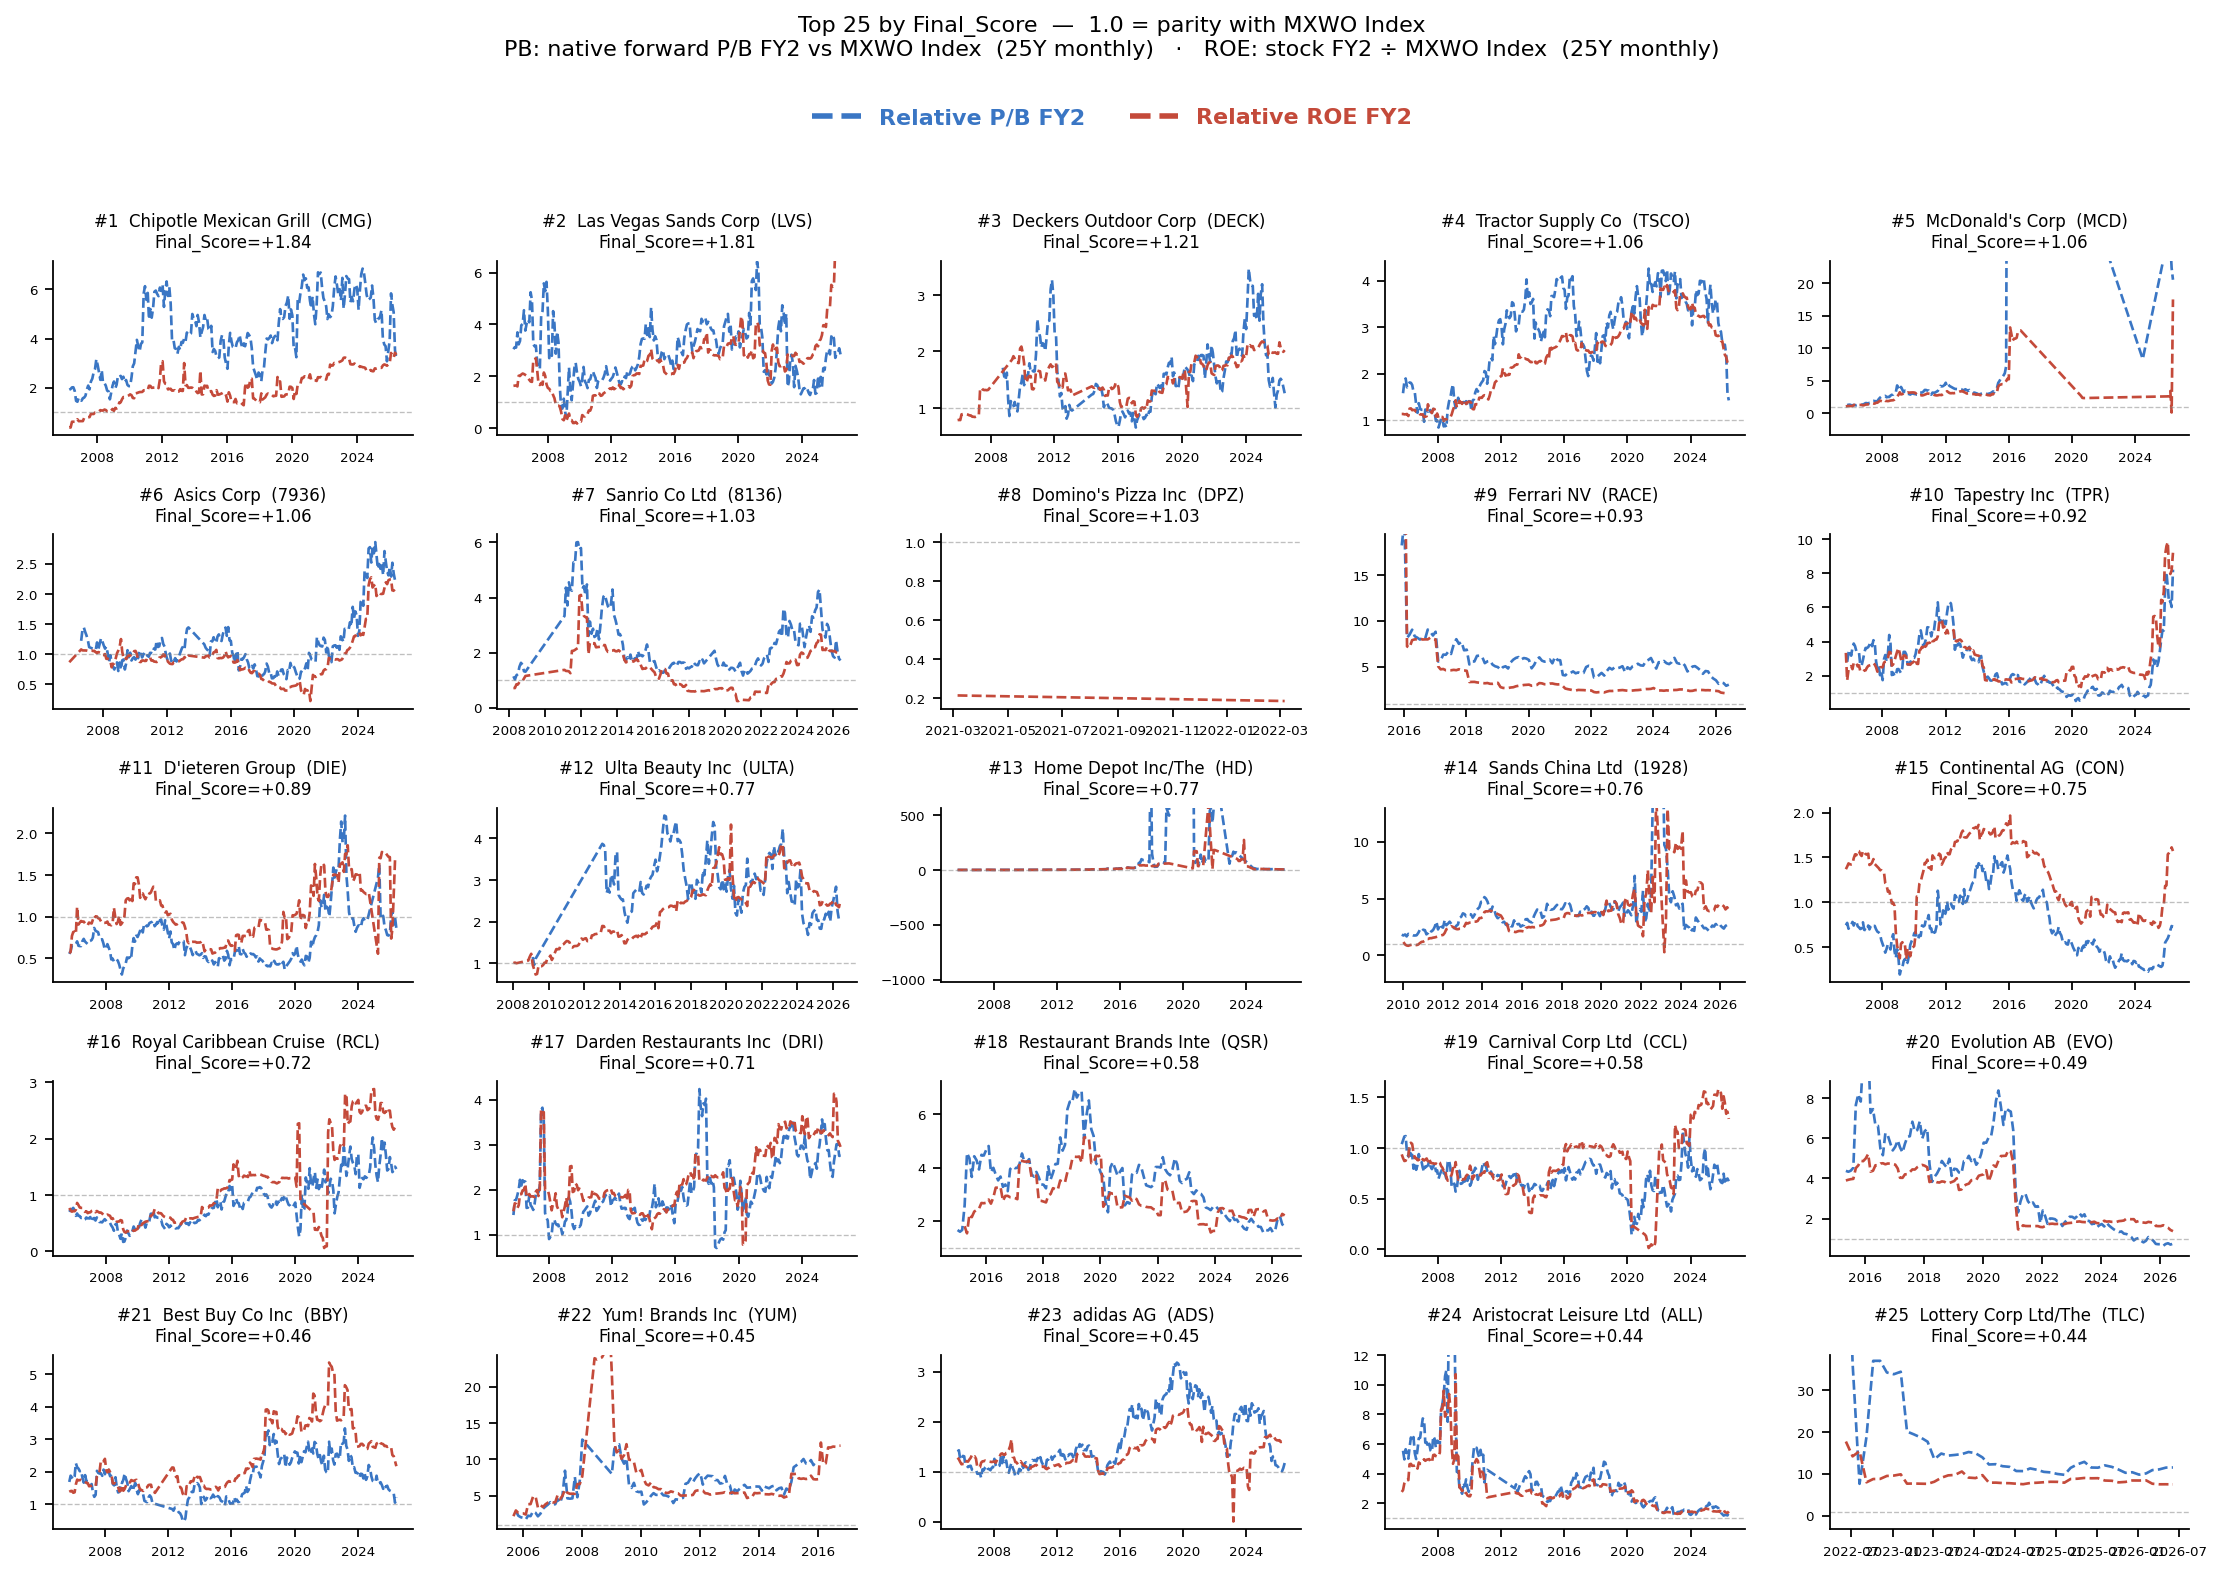
Top 25 By Sector Relative PB / Relative ROE FY2 Panels
Screen Tables
| Rank | Dep HQ Rank | Ticker | Name | Country | Sector | Mkt Cap $bn | Quality | Value | Final | Dep HQ Final | Rel PB | Rel ROE FY2 |
|---|---|---|---|---|---|---|---|---|---|---|---|---|
| 1 | 587 | REL LN Equity | RELX PLC | GB | Industrials | 61.8 | 3.22 | 1.57 | 2.40 | 0.06 | 4.82 | 8.43 |
| 2 | 456 | SGE LN Equity | Sage Group PLC/The | GB | Technology | 10.5 | 2.87 | 1.91 | 2.39 | 0.29 | 9.37 | 4.49 |
| 3 | 206 | WKL NA Equity | Wolters Kluwer NV | NL | Industrials | 17.0 | 2.50 | 1.95 | 2.22 | 0.73 | 4.31 | 8.30 |
| 4 | 143 | PGHN SW Equity | Partners Group Holding AG | CH | Financials | 23.9 | 2.12 | 1.87 | 1.99 | 0.93 | 2.01 | 3.40 |
| 5 | 297 | V US Equity | Visa Inc | US | Financials | 624.6 | 2.43 | 1.51 | 1.97 | 0.56 | 3.96 | 4.14 |
| 6 | 711 | NEM US Equity | Newmont Corp | US | Materials | 106.4 | 2.76 | 1.10 | 1.93 | -0.10 | 0.73 | 1.49 |
| 7 | 99 | MA US Equity | Mastercard Inc | US | Financials | 434.0 | 1.92 | 1.85 | 1.89 | 1.10 | 15.54 | 12.96 |
| 8 | 234 | CMG US Equity | Chipotle Mexican Grill Inc | US | Consumer Discretionary | 37.6 | 2.10 | 1.59 | 1.84 | 0.68 | 3.76 | 3.34 |
| 9 | 20 | ZTS US Equity | Zoetis Inc | US | Health Care | 33.3 | 1.36 | 2.30 | 1.83 | 1.57 | 2.48 | 3.84 |
| 10 | 1,029 | LVS US Equity | Las Vegas Sands Corp | US | Consumer Discretionary | 33.3 | 3.24 | 0.39 | 1.81 | -0.61 | 6.67 | 7.05 |
| 11 | 198 | ADBE US Equity | Adobe Inc | US | Technology | 101.6 | 1.74 | 1.70 | 1.72 | 0.76 | 2.14 | 3.40 |
| 12 | 471 | WPM CN Equity | Wheaton Precious Metals Corp | CA | Materials | 52.8 | 1.73 | 1.63 | 1.68 | 0.26 | 1.37 | 1.05 |
| 13 | 767 | 6098 JP Equity | Recruit Holdings Co Ltd | JP | Industrials | 97.3 | 2.46 | 0.88 | 1.67 | -0.18 | 2.24 | 2.07 |
| 14 | 121 | WTW US Equity | Willis Towers Watson PLC | GB | Financials | 24.9 | 1.37 | 1.94 | 1.65 | 1.02 | 0.75 | 1.12 |
| 15 | 337 | AMT US Equity | American Tower Corp | US | Real Estate | 90.4 | 2.22 | 1.02 | 1.62 | 0.49 | 6.16 | 6.61 |
| 16 | 1,170 | BBD/B CN Equity | Bombardier Inc | CA | Industrials | 21.9 | 3.45 | -0.23 | 1.61 | -0.99 | 29.16 | |
| 17 | 1,004 | CRM US Equity | Salesforce Inc | US | Technology | 152.1 | 2.12 | 1.03 | 1.57 | -0.57 | 1.06 | 1.62 |
| 18 | 34 | ADP US Equity | Automatic Data Processing Inc | US | Industrials | 92.7 | 1.25 | 1.89 | 1.57 | 1.46 | 3.51 | 3.67 |
| 19 | 1,165 | LGEN LN Equity | Legal & General Group PLC | GB | Financials | 20.0 | 3.37 | -0.24 | 1.56 | -0.97 | 1.61 | 4.13 |
| 20 | 689 | CSL US Equity | Carlisle Cos Inc | US | Materials | 14.0 | 2.56 | 0.55 | 1.56 | -0.08 | 2.03 | 3.05 |
| 21 | 590 | EVN AU Equity | Evolution Mining Ltd | AU | Materials | 16.8 | 2.36 | 0.75 | 1.55 | 0.05 | 1.01 | 1.70 |
| 22 | 630 | FRES LN Equity | Fresnillo PLC | MX | Materials | 29.4 | 2.43 | 0.65 | 1.54 | 0.01 | 1.52 | 2.04 |
| 23 | 520 | EDV CN Equity | Endeavour Mining PLC | GB | Materials | 12.6 | 2.32 | 0.76 | 1.54 | 0.17 | 0.90 | 2.08 |
| 24 | 611 | K CN Equity | Kinross Gold Corp | CA | Materials | 31.2 | 2.35 | 0.73 | 1.54 | 0.02 | 0.82 | 1.50 |
| 25 | 783 | J US Equity | Jacobs Solutions Inc | US | Industrials | 14.5 | 1.86 | 1.15 | 1.51 | -0.22 | 1.05 | 1.33 |
| Rank | Dep HQ Rank | Ticker | Name | Country | Sector | Mkt Cap $bn | Quality | Value | Final | Dep HQ Final | Rel PB | Rel ROE FY2 |
|---|---|---|---|---|---|---|---|---|---|---|---|---|
| 1 | 587 | REL LN Equity | RELX PLC | GB | Industrials | 61.8 | 3.22 | 1.57 | 2.40 | 0.06 | 4.82 | 8.43 |
| 2 | 456 | SGE LN Equity | Sage Group PLC/The | GB | Technology | 10.5 | 2.87 | 1.91 | 2.39 | 0.29 | 9.37 | 4.49 |
| 3 | 206 | WKL NA Equity | Wolters Kluwer NV | NL | Industrials | 17.0 | 2.50 | 1.95 | 2.22 | 0.73 | 4.31 | 8.30 |
| 4 | 143 | PGHN SW Equity | Partners Group Holding AG | CH | Financials | 23.9 | 2.12 | 1.87 | 1.99 | 0.93 | 2.01 | 3.40 |
| 5 | 297 | V US Equity | Visa Inc | US | Financials | 624.6 | 2.43 | 1.51 | 1.97 | 0.56 | 3.96 | 4.14 |
| 6 | 711 | NEM US Equity | Newmont Corp | US | Materials | 106.4 | 2.76 | 1.10 | 1.93 | -0.10 | 0.73 | 1.49 |
| 7 | 99 | MA US Equity | Mastercard Inc | US | Financials | 434.0 | 1.92 | 1.85 | 1.89 | 1.10 | 15.54 | 12.96 |
| 8 | 234 | CMG US Equity | Chipotle Mexican Grill Inc | US | Consumer Discretionary | 37.6 | 2.10 | 1.59 | 1.84 | 0.68 | 3.76 | 3.34 |
| 9 | 20 | ZTS US Equity | Zoetis Inc | US | Health Care | 33.3 | 1.36 | 2.30 | 1.83 | 1.57 | 2.48 | 3.84 |
| 11 | 198 | ADBE US Equity | Adobe Inc | US | Technology | 101.6 | 1.74 | 1.70 | 1.72 | 0.76 | 2.14 | 3.40 |
| 12 | 471 | WPM CN Equity | Wheaton Precious Metals Corp | CA | Materials | 52.8 | 1.73 | 1.63 | 1.68 | 0.26 | 1.37 | 1.05 |
| 13 | 767 | 6098 JP Equity | Recruit Holdings Co Ltd | JP | Industrials | 97.3 | 2.46 | 0.88 | 1.67 | -0.18 | 2.24 | 2.07 |
| 14 | 121 | WTW US Equity | Willis Towers Watson PLC | GB | Financials | 24.9 | 1.37 | 1.94 | 1.65 | 1.02 | 0.75 | 1.12 |
| 15 | 337 | AMT US Equity | American Tower Corp | US | Real Estate | 90.4 | 2.22 | 1.02 | 1.62 | 0.49 | 6.16 | 6.61 |
| 17 | 1,004 | CRM US Equity | Salesforce Inc | US | Technology | 152.1 | 2.12 | 1.03 | 1.57 | -0.57 | 1.06 | 1.62 |
| 18 | 34 | ADP US Equity | Automatic Data Processing Inc | US | Industrials | 92.7 | 1.25 | 1.89 | 1.57 | 1.46 | 3.51 | 3.67 |
| 21 | 590 | EVN AU Equity | Evolution Mining Ltd | AU | Materials | 16.8 | 2.36 | 0.75 | 1.55 | 0.05 | 1.01 | 1.70 |
| 22 | 630 | FRES LN Equity | Fresnillo PLC | MX | Materials | 29.4 | 2.43 | 0.65 | 1.54 | 0.01 | 1.52 | 2.04 |
| 23 | 520 | EDV CN Equity | Endeavour Mining PLC | GB | Materials | 12.6 | 2.32 | 0.76 | 1.54 | 0.17 | 0.90 | 2.08 |
| 24 | 611 | K CN Equity | Kinross Gold Corp | CA | Materials | 31.2 | 2.35 | 0.73 | 1.54 | 0.02 | 0.82 | 1.50 |
| 25 | 783 | J US Equity | Jacobs Solutions Inc | US | Industrials | 14.5 | 1.86 | 1.15 | 1.51 | -0.22 | 1.05 | 1.33 |
| 27 | 589 | ABX CN Equity | Barrick Mining Corp | CA | Materials | 66.0 | 2.09 | 0.89 | 1.49 | 0.05 | 0.58 | 1.21 |
| 28 | 162 | SCHW US Equity | Charles Schwab Corp/The | US | Financials | 159.0 | 1.51 | 1.45 | 1.48 | 0.86 | 0.87 | 1.37 |
| 30 | 634 | AEM CN Equity | Agnico Eagle Mines Ltd | CA | Materials | 81.9 | 1.87 | 1.08 | 1.48 | 0.01 | 0.75 | 1.12 |
| 31 | 210 | NVDA US Equity | NVIDIA Corp | US | Technology | 4,963.4 | 1.67 | 1.24 | 1.46 | 0.73 | 6.09 | 3.92 |
| Rank | Dep HQ Rank | Ticker | Name | Country | Sector | Mkt Cap $bn | Quality | Value | Final | Dep HQ Final | Rel PB | Rel ROE FY2 |
|---|---|---|---|---|---|---|---|---|---|---|---|---|
| 102 | 1 | MRSH US Equity | Marsh & McLennan Cos Inc | US | Financials | 79.7 | -0.10 | 2.08 | 0.99 | 2.31 | 1.31 | 1.56 |
| 26 | 2 | BR US Equity | Broadridge Financial Solutions | US | Financials | 17.5 | 0.67 | 2.32 | 1.49 | 2.04 | 1.49 | 2.08 |
| 81 | 3 | TSCO US Equity | Tractor Supply Co | US | Consumer Discretionary | 15.6 | 0.07 | 2.05 | 1.06 | 2.04 | 1.49 | 2.18 |
| 46 | 4 | COLOB DC Equity | Coloplast A/S | DK | Health Care | 13.5 | 0.32 | 2.22 | 1.27 | 2.00 | 1.61 | 2.06 |
| 378 | 5 | NOVOB DC Equity | Novo Nordisk A/S | DK | Health Care | 195.5 | -0.40 | 1.08 | 0.34 | 1.99 | 1.50 | 2.38 |
| 258 | 6 | DGE LN Equity | Diageo PLC | GB | Consumer Staples | 44.5 | -0.44 | 1.59 | 0.58 | 1.80 | 0.92 | 1.33 |
| 384 | 7 | RMS FP Equity | Hermes International SCA | FR | Consumer Discretionary | 197.1 | -0.97 | 1.63 | 0.33 | 1.76 | 2.16 | 1.27 |
| 39 | 8 | PAYX US Equity | Paychex Inc | US | Industrials | 36.0 | 0.80 | 1.91 | 1.35 | 1.71 | 2.15 | 2.77 |
| 101 | 9 | AVY US Equity | Avery Dennison Corp | US | Materials | 11.9 | 0.51 | 1.47 | 0.99 | 1.71 | 1.24 | 1.80 |
| 261 | 10 | GIVN SW Equity | Givaudan SA | CH | Materials | 33.3 | -0.06 | 1.19 | 0.57 | 1.70 | 1.40 | 1.24 |
| 301 | 11 | ELISA FH Equity | Elisa Oyj | FI | Communications | 7.7 | -0.07 | 1.02 | 0.48 | 1.68 | 1.14 | 1.74 |
| 400 | 12 | GIB/A CN Equity | CGI Inc | CA | Technology | 14.2 | -1.48 | 2.11 | 0.32 | 1.66 | 0.48 | 0.98 |
| 94 | 13 | ALLE US Equity | Allegion plc | IE | Industrials | 11.2 | 0.12 | 1.88 | 1.00 | 1.64 | 1.28 | 1.60 |
| 182 | 14 | PEP US Equity | PepsiCo Inc | US | Consumer Staples | 194.0 | 0.35 | 1.12 | 0.74 | 1.61 | 2.18 | 2.68 |
| 718 | 15 | REC IM Equity | Recordati Industria Chimica e | IT | Health Care | 12.2 | -0.81 | 0.58 | -0.12 | 1.61 | 1.23 | 1.48 |
| 123 | 16 | UMG NA Equity | Universal Music Group NV | NL | Communications | 38.5 | 0.54 | 1.25 | 0.90 | 1.61 | 1.76 | 2.17 |
| 49 | 17 | FSV CN Equity | FirstService Corp | CA | Real Estate | 6.7 | 0.57 | 1.88 | 1.22 | 1.60 | 1.09 | 0.67 |
| 71 | 18 | CDW US Equity | CDW Corp/DE | US | Technology | 17.0 | 0.36 | 1.82 | 1.09 | 1.60 | 1.60 | 2.53 |
| 191 | 19 | LPLA US Equity | LPL Financial Holdings Inc | US | Financials | 23.1 | 0.31 | 1.12 | 0.71 | 1.58 | 0.98 | 1.58 |
| 9 | 20 | ZTS US Equity | Zoetis Inc | US | Health Care | 33.3 | 1.36 | 2.30 | 1.83 | 1.57 | 2.48 | 3.84 |
| 117 | 21 | BRO US Equity | Brown & Brown Inc | US | Financials | 20.0 | -0.54 | 2.40 | 0.93 | 1.55 | 0.38 | 0.81 |
| 242 | 22 | MSFT US Equity | Microsoft Corp | US | Technology | 3,095.2 | -0.60 | 1.81 | 0.60 | 1.53 | 1.79 | 1.51 |
| 184 | 23 | REA AU Equity | REA Group Ltd | AU | Communications | 14.7 | 0.24 | 1.22 | 0.73 | 1.51 | 2.45 | 1.74 |
| 297 | 24 | OMC US Equity | Omnicom Group Inc | US | Communications | 21.5 | -0.24 | 1.21 | 0.49 | 1.51 | 0.55 | 1.45 |
| 459 | 25 | PNDORA DC Equity | Pandora A/S | DK | Consumer Discretionary | 6.7 | -0.30 | 0.76 | 0.23 | 1.51 | 2.59 | 2.08 |
| Rank | Dep HQ Rank | Ticker | Name | Country | Sector | Mkt Cap $bn | Quality | Value | Final | Dep HQ Final | Rel PB | Rel ROE FY2 |
|---|---|---|---|---|---|---|---|---|---|---|---|---|
| 102 | 1 | MRSH US Equity | Marsh & McLennan Cos Inc | US | Financials | 79.7 | -0.10 | 2.08 | 0.99 | 2.31 | 1.31 | 1.56 |
| 26 | 2 | BR US Equity | Broadridge Financial Solutions | US | Financials | 17.5 | 0.67 | 2.32 | 1.49 | 2.04 | 1.49 | 2.08 |
| 81 | 3 | TSCO US Equity | Tractor Supply Co | US | Consumer Discretionary | 15.6 | 0.07 | 2.05 | 1.06 | 2.04 | 1.49 | 2.18 |
| 46 | 4 | COLOB DC Equity | Coloplast A/S | DK | Health Care | 13.5 | 0.32 | 2.22 | 1.27 | 2.00 | 1.61 | 2.06 |
| 378 | 5 | NOVOB DC Equity | Novo Nordisk A/S | DK | Health Care | 195.5 | -0.40 | 1.08 | 0.34 | 1.99 | 1.50 | 2.38 |
| 258 | 6 | DGE LN Equity | Diageo PLC | GB | Consumer Staples | 44.5 | -0.44 | 1.59 | 0.58 | 1.80 | 0.92 | 1.33 |
| 384 | 7 | RMS FP Equity | Hermes International SCA | FR | Consumer Discretionary | 197.1 | -0.97 | 1.63 | 0.33 | 1.76 | 2.16 | 1.27 |
| 39 | 8 | PAYX US Equity | Paychex Inc | US | Industrials | 36.0 | 0.80 | 1.91 | 1.35 | 1.71 | 2.15 | 2.77 |
| 101 | 9 | AVY US Equity | Avery Dennison Corp | US | Materials | 11.9 | 0.51 | 1.47 | 0.99 | 1.71 | 1.24 | 1.80 |
| 261 | 10 | GIVN SW Equity | Givaudan SA | CH | Materials | 33.3 | -0.06 | 1.19 | 0.57 | 1.70 | 1.40 | 1.24 |
| 301 | 11 | ELISA FH Equity | Elisa Oyj | FI | Communications | 7.7 | -0.07 | 1.02 | 0.48 | 1.68 | 1.14 | 1.74 |
| 400 | 12 | GIB/A CN Equity | CGI Inc | CA | Technology | 14.2 | -1.48 | 2.11 | 0.32 | 1.66 | 0.48 | 0.98 |
| 94 | 13 | ALLE US Equity | Allegion plc | IE | Industrials | 11.2 | 0.12 | 1.88 | 1.00 | 1.64 | 1.28 | 1.60 |
| 182 | 14 | PEP US Equity | PepsiCo Inc | US | Consumer Staples | 194.0 | 0.35 | 1.12 | 0.74 | 1.61 | 2.18 | 2.68 |
| 123 | 16 | UMG NA Equity | Universal Music Group NV | NL | Communications | 38.5 | 0.54 | 1.25 | 0.90 | 1.61 | 1.76 | 2.17 |
| 49 | 17 | FSV CN Equity | FirstService Corp | CA | Real Estate | 6.7 | 0.57 | 1.88 | 1.22 | 1.60 | 1.09 | 0.67 |
| 71 | 18 | CDW US Equity | CDW Corp/DE | US | Technology | 17.0 | 0.36 | 1.82 | 1.09 | 1.60 | 1.60 | 2.53 |
| 191 | 19 | LPLA US Equity | LPL Financial Holdings Inc | US | Financials | 23.1 | 0.31 | 1.12 | 0.71 | 1.58 | 0.98 | 1.58 |
| 117 | 21 | BRO US Equity | Brown & Brown Inc | US | Financials | 20.0 | -0.54 | 2.40 | 0.93 | 1.55 | 0.38 | 0.81 |
| 242 | 22 | MSFT US Equity | Microsoft Corp | US | Technology | 3,095.2 | -0.60 | 1.81 | 0.60 | 1.53 | 1.79 | 1.51 |
| 184 | 23 | REA AU Equity | REA Group Ltd | AU | Communications | 14.7 | 0.24 | 1.22 | 0.73 | 1.51 | 2.45 | 1.74 |
| 297 | 24 | OMC US Equity | Omnicom Group Inc | US | Communications | 21.5 | -0.24 | 1.21 | 0.49 | 1.51 | 0.55 | 1.45 |
| 459 | 25 | PNDORA DC Equity | Pandora A/S | DK | Consumer Discretionary | 6.7 | -0.30 | 0.76 | 0.23 | 1.51 | 2.59 | 2.08 |
| 253 | 26 | ECL US Equity | Ecolab Inc | US | Materials | 72.6 | 0.19 | 0.98 | 0.58 | 1.51 | 1.74 | 1.26 |
| 265 | 27 | ADYEN NA Equity | Adyen NV | NL | Financials | 29.7 | 0.07 | 1.05 | 0.56 | 1.49 | 1.17 | 1.17 |
| Rank | Dep HQ Rank | Ticker | Name | Country | Sector | Mkt Cap $bn | Quality | Value | Final | Dep HQ Final | Rel PB | Rel ROE FY2 |
|---|---|---|---|---|---|---|---|---|---|---|---|---|
| 1,116 | 878 | DOW US Equity | Dow Inc | US | Materials | 24.5 | -0.86 | -0.58 | -0.72 | -0.36 | 0.38 | 0.60 |
| 1,117 | 672 | SRE US Equity | Sempra | US | Utilities | 59.8 | -0.81 | -0.64 | -0.73 | -0.04 | 0.44 | 0.54 |
| 1,128 | 798 | SIE GR Equity | Siemens AG | DE | Industrials | 239.7 | -0.93 | -0.58 | -0.76 | -0.23 | 0.77 | 0.80 |
| 1,129 | 671 | H CN Equity | Hydro One Ltd | CA | Utilities | 24.5 | -0.81 | -0.71 | -0.76 | -0.04 | 0.64 | 0.55 |
| 1,132 | 1,131 | RBI AV Equity | Raiffeisen Bank International | AT | Financials | 18.7 | -0.88 | -0.66 | -0.77 | -0.84 | 0.19 | 0.56 |
| 1,135 | 885 | BCVN SW Equity | Banque Cantonale Vaudoise | CH | Financials | 12.8 | -0.99 | -0.55 | -0.77 | -0.37 | 0.61 | 0.65 |
| 1,145 | 1,188 | 9101 JP Equity | Nippon Yusen KK | JP | Industrials | 14.2 | -0.98 | -0.64 | -0.81 | -1.05 | 0.18 | 0.33 |
| 1,165 | 1,169 | 9104 JP Equity | Mitsui OSK Lines Ltd | JP | Industrials | 13.1 | -1.12 | -0.66 | -0.89 | -0.98 | 0.17 | 0.33 |
| 1,169 | 691 | AME US Equity | AMETEK Inc | US | Industrials | 51.9 | -1.16 | -0.67 | -0.92 | -0.08 | 1.14 | 0.83 |
| 1,174 | 828 | AFL US Equity | Aflac Inc | US | Financials | 60.2 | -1.00 | -0.87 | -0.94 | -0.28 | 0.48 | 0.70 |
| 1,175 | 825 | 7272 JP Equity | Yamaha Motor Co Ltd | JP | Consumer Discretionary | 7.8 | -1.19 | -0.68 | -0.94 | -0.27 | 0.24 | 0.56 |
| 1,177 | 936 | AYV FP Equity | Ayvens SA | FR | Consumer Discretionary | 10.1 | -1.14 | -0.75 | -0.94 | -0.45 | 0.19 | 0.53 |
| 1,180 | 1,079 | IFX GR Equity | Infineon Technologies AG | DE | Technology | 112.1 | -0.77 | -1.16 | -0.97 | -0.70 | 1.38 | 0.88 |
| 1,181 | 880 | FTS CN Equity | Fortis Inc/Canada | CA | Utilities | 28.4 | -1.31 | -0.63 | -0.97 | -0.36 | 0.42 | 0.46 |
| 1,185 | 819 | TRP CN Equity | TC Energy Corp | CA | Energy | 71.6 | -0.82 | -1.14 | -0.98 | -0.26 | 0.95 | 0.79 |
| 1,186 | 1,124 | PANW US Equity | Palo Alto Networks Inc | US | Technology | 221.7 | -1.16 | -0.80 | -0.98 | -0.83 | 1.92 | 0.54 |
| 1,189 | 1,196 | MSTR US Equity | Strategy Inc | US | Technology | 42.2 | -1.16 | -0.81 | -0.99 | -1.11 | 0.28 | 0.11 |
| 1,190 | 1,148 | 6954 JP Equity | FANUC Corp | JP | Industrials | 46.9 | -0.95 | -1.03 | -0.99 | -0.90 | 0.92 | 0.61 |
| 1,191 | 1,065 | CVS US Equity | CVS Health Corp | US | Health Care | 122.4 | -1.14 | -0.85 | -1.00 | -0.67 | 0.38 | 0.61 |
| 1,195 | 849 | DHI US Equity | DR Horton Inc | US | Consumer Discretionary | 41.3 | -1.01 | -1.02 | -1.02 | -0.31 | 0.42 | 0.74 |
| 1,196 | 817 | ML FP Equity | Cie Generale des Etablissement | FR | Consumer Discretionary | 25.3 | -1.15 | -0.89 | -1.02 | -0.26 | 0.29 | 0.60 |
| 1,199 | 1,104 | BG US Equity | Bunge Global SA | US | Consumer Staples | 24.5 | -0.91 | -1.18 | -1.05 | -0.76 | 0.37 | 0.62 |
| 1,201 | 1,118 | BOL FP Equity | Bollore SE | FR | Energy | 17.8 | -1.44 | -0.66 | -1.05 | -0.80 | 0.15 | 0.08 |
| 1,202 | 916 | 6479 JP Equity | MINEBEA MITSUMI Inc | JP | Technology | 13.3 | -1.56 | -0.57 | -1.06 | -0.42 | 0.53 | 0.55 |
| 1,203 | 1,089 | 4188 JP Equity | Mitsubishi Chemical Group Corp | JP | Materials | 9.6 | -1.38 | -0.75 | -1.06 | -0.73 | 0.20 | 0.36 |
Extraction Warnings
- Country 'US' = 52% of top quartile (>50%)
- [value_index] 2 stocks with Relative_PB > 50 (possible currency mismatch)
- [value_index] Z_PB_Expanding mean = -0.516 (expected ~0)
Appendix: Methodology
This dashboard ranks companies in the selected benchmark, currently MSCI World / MXWO Index, using a Quality Value framework. The model is designed to find companies that combine attractive valuation with strong or improving business quality.
The screen has two views: Canonical QV and Depressed HQ. Both use the same value score. They differ only in how the quality score is defined.
Canonical QV
Canonical QV is the base version of the model.
Final Score = 50% Quality Composite + 50% Value Composite
The Quality Composite combines:
- Quality Level: how strong a company's forward FY2 ROE is versus the benchmark, ranked within its GICS sector.
- Quality Momentum: whether that relative ROE is high or low versus the company's own 10-year history.
The Value Composite combines:
- Value vs Index: whether the company is cheap versus the benchmark on relative valuation.
- Value vs Sector: whether the company is cheap versus its own sector peers.
The scored valuation inputs are mainly relative P/E and EV/EBIT. Lower valuation is converted into a higher value score. For financials, where EV/EBIT is not meaningful, the model falls back more heavily to P/E. Relative P/B is shown in the charts as an important diagnostic, especially for financials, but it is not currently part of the scored value composite.
Depressed HQ
Depressed HQ is a complementary, more contrarian version of the screen.
It keeps the same Value Composite as Canonical QV, but changes the quality lens. Instead of rewarding companies whose relative ROE is high versus their own history, it looks for companies that still rank well on current quality but whose relative ROE is depressed versus their own historical norm.
In simple terms, Depressed HQ is trying to find good businesses, still cheap, where current quality looks cyclically or temporarily depressed.
Depressed HQ Score = 50% Depressed Quality + 50% Value Composite
This view is useful for identifying recovery candidates that may not look strongest on near-term momentum, but still have enough underlying quality to be interesting.
How To Read The Charts
The Relative P/B and Relative ROE panels are diagnostic charts for the companies selected by each approach. Switching between Canonical QV and Depressed HQ changes the selected company list. The chart definitions stay the same.
- Relative P/B shows how expensive or cheap the company is versus the benchmark on price-to-book.
- Relative ROE shows how profitable the company is versus the benchmark on forward ROE.
- The most interesting candidates are often companies where relative valuation is low or normalizing while relative ROE is stable, improving, or cyclically depressed but recoverable.