Methodology At A Glance
Canonical QV ranks companies on a 50% Quality Composite and 50% Value Composite. Quality rewards strong forward FY2 ROE versus the benchmark and sector peers, plus positive own-history ROE momentum. Value rewards cheaper relative P/E and EV/EBIT versus the index and sector.
Depressed HQ uses the same Value Composite, but replaces the quality momentum lens with a contrarian one: high-quality companies whose relative ROE is below their own 10-year norm. It is intended to surface cheap quality names with potential for recovery.
Top 100 Sector Mix
Canonical QV
Depressed HQ
Top 100 Country Mix
Canonical QV
Depressed HQ
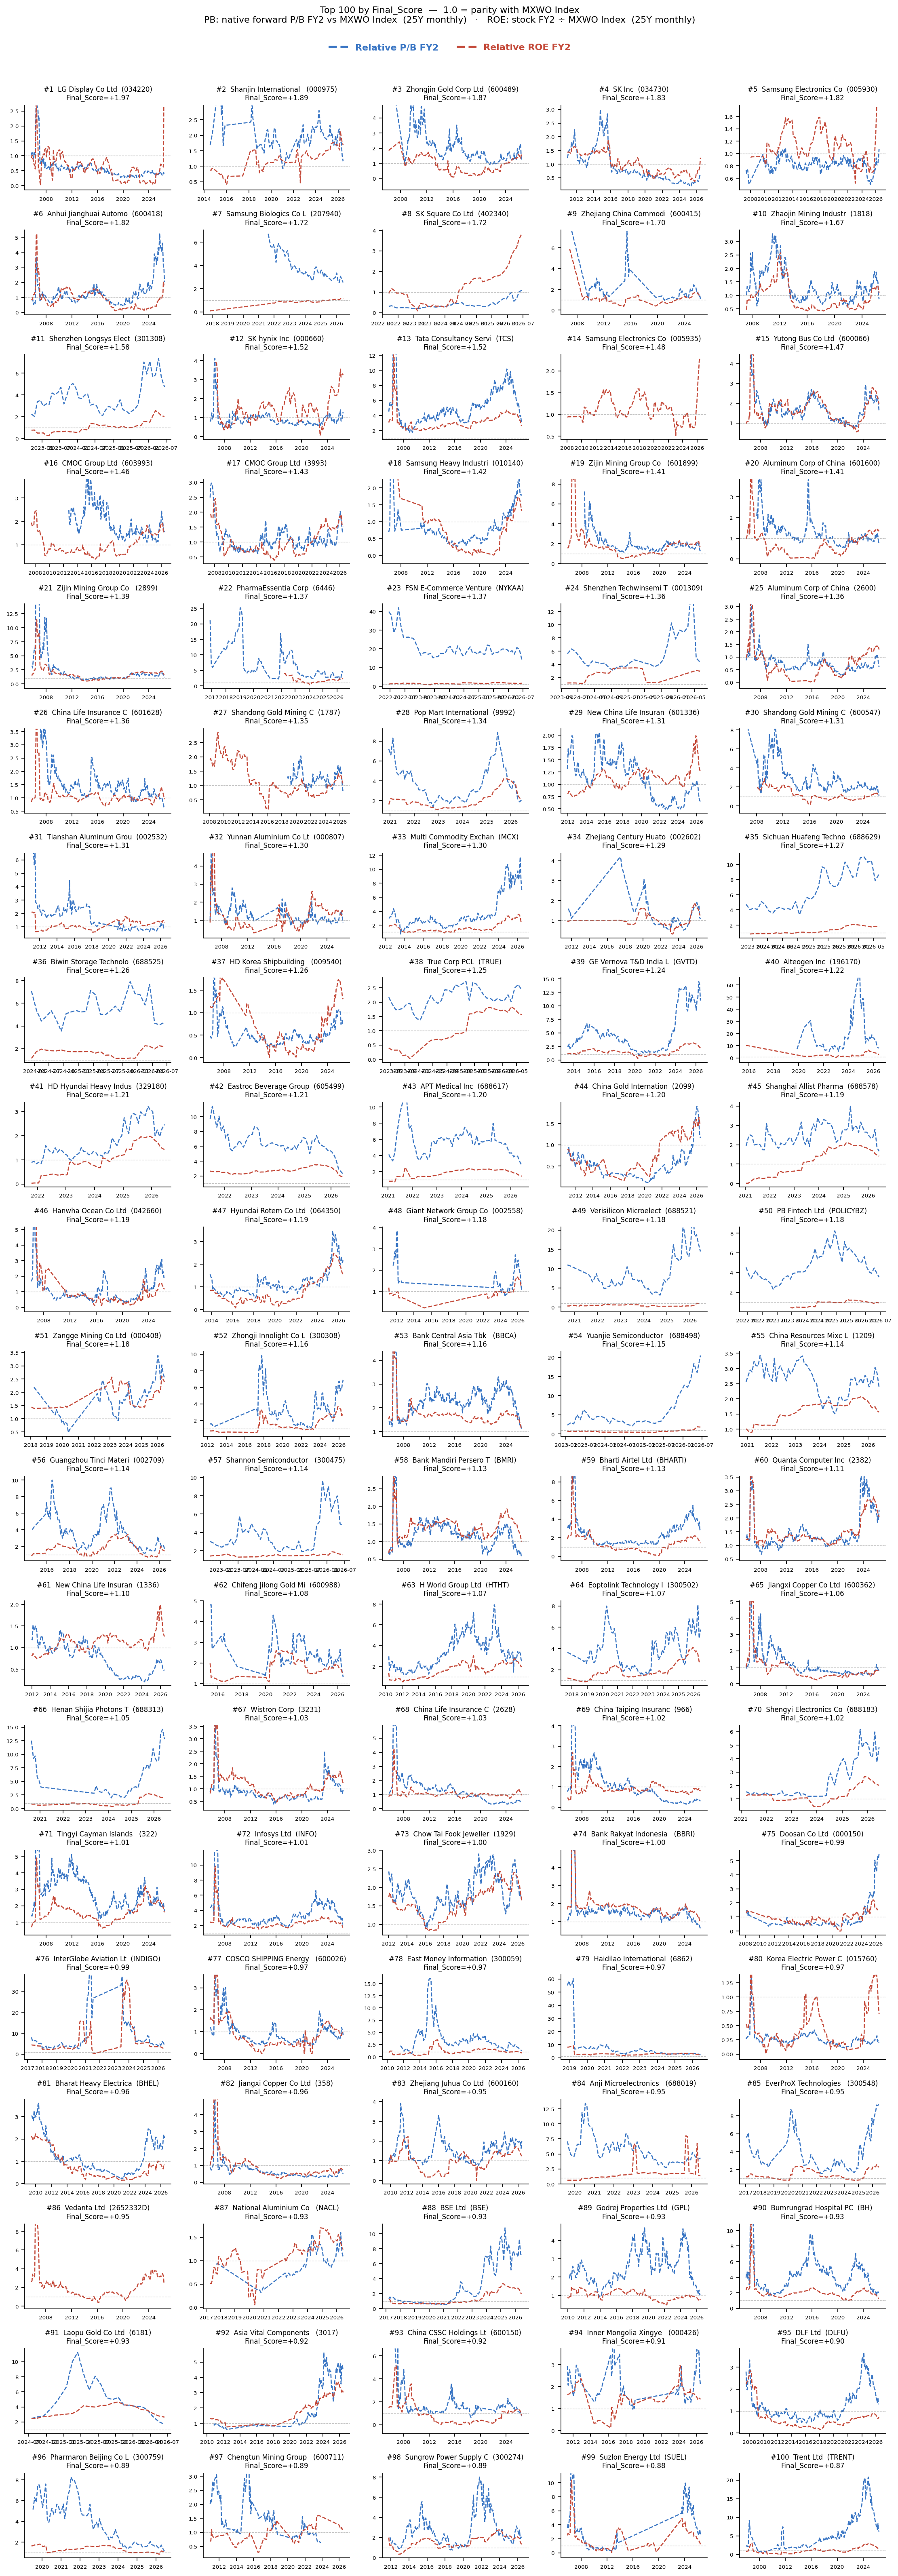
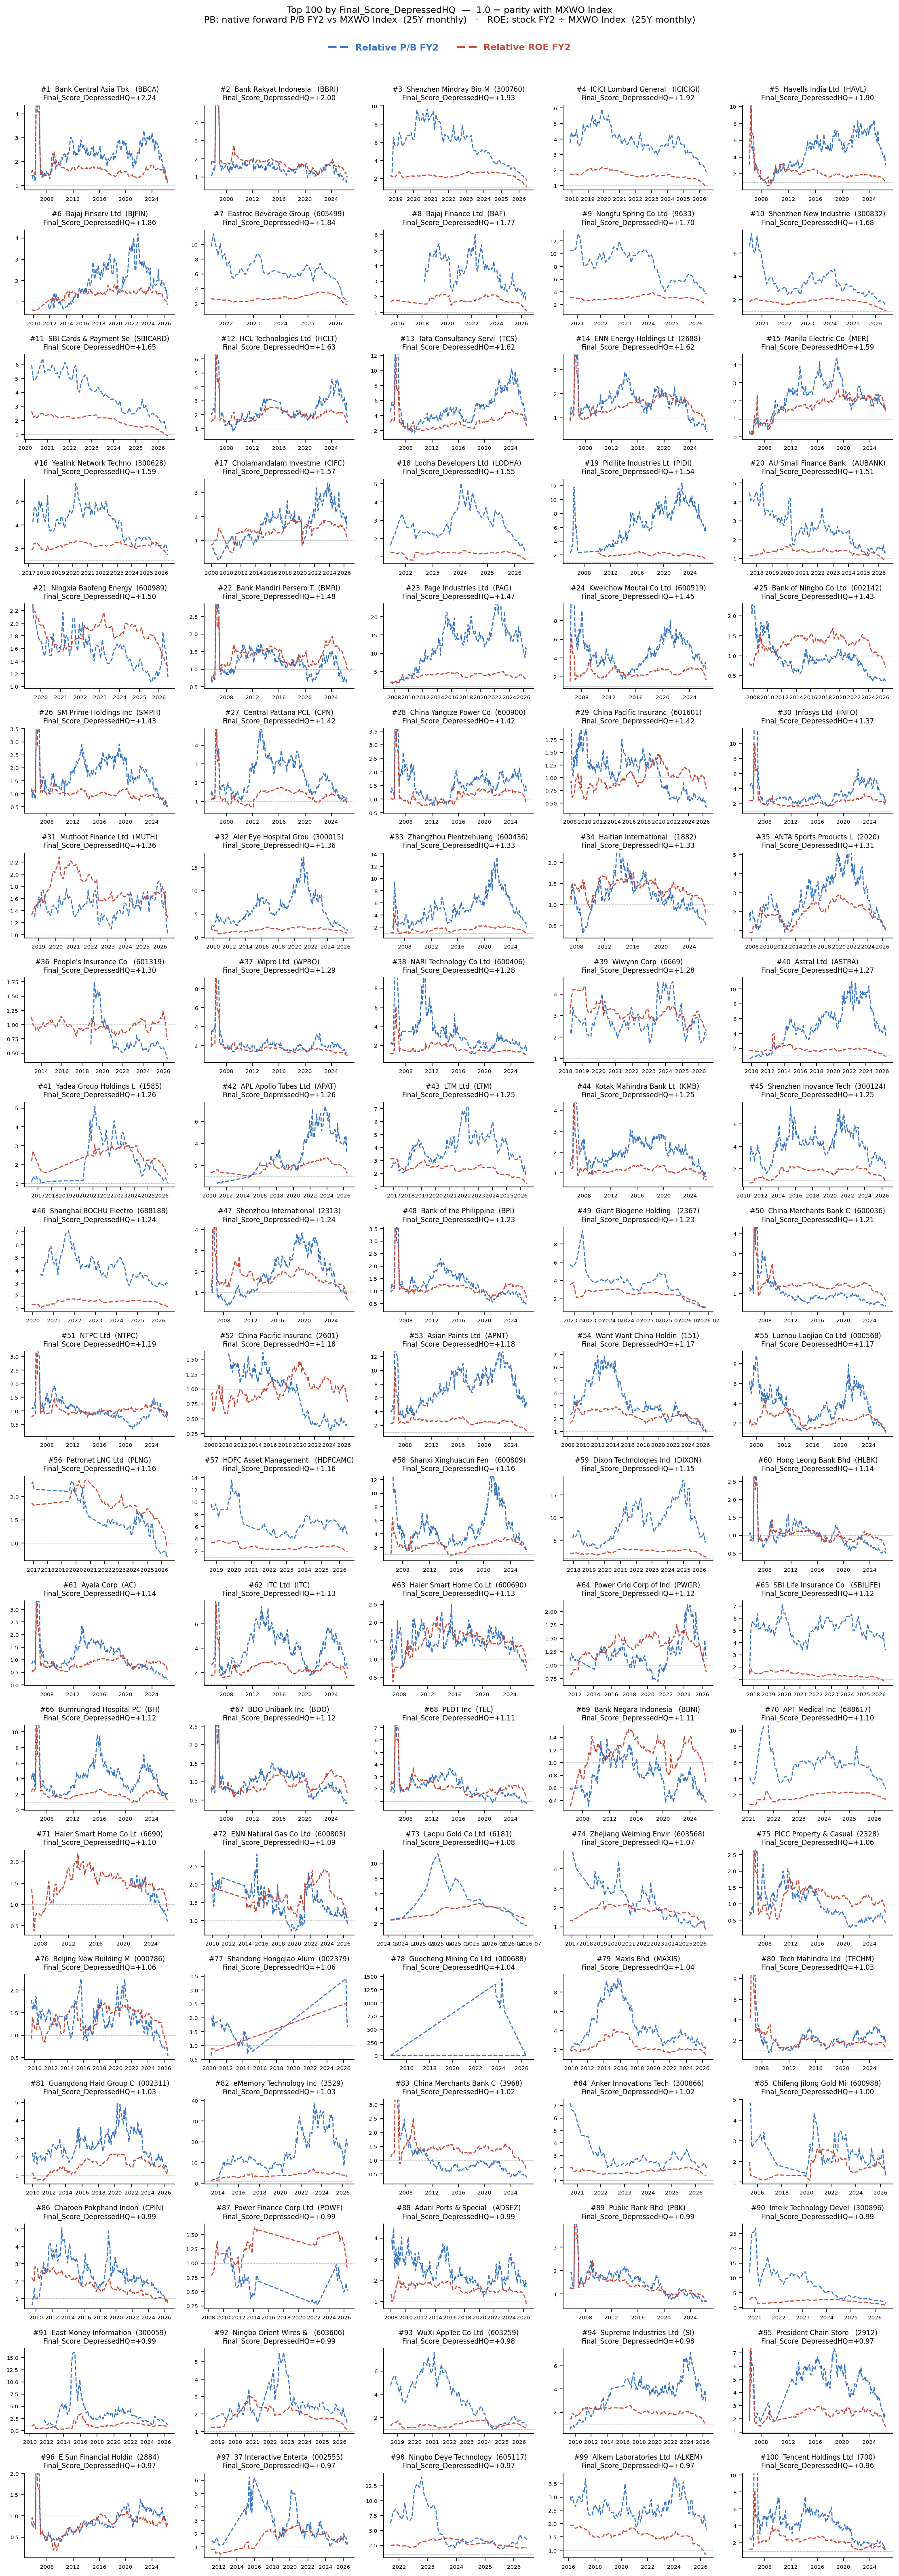
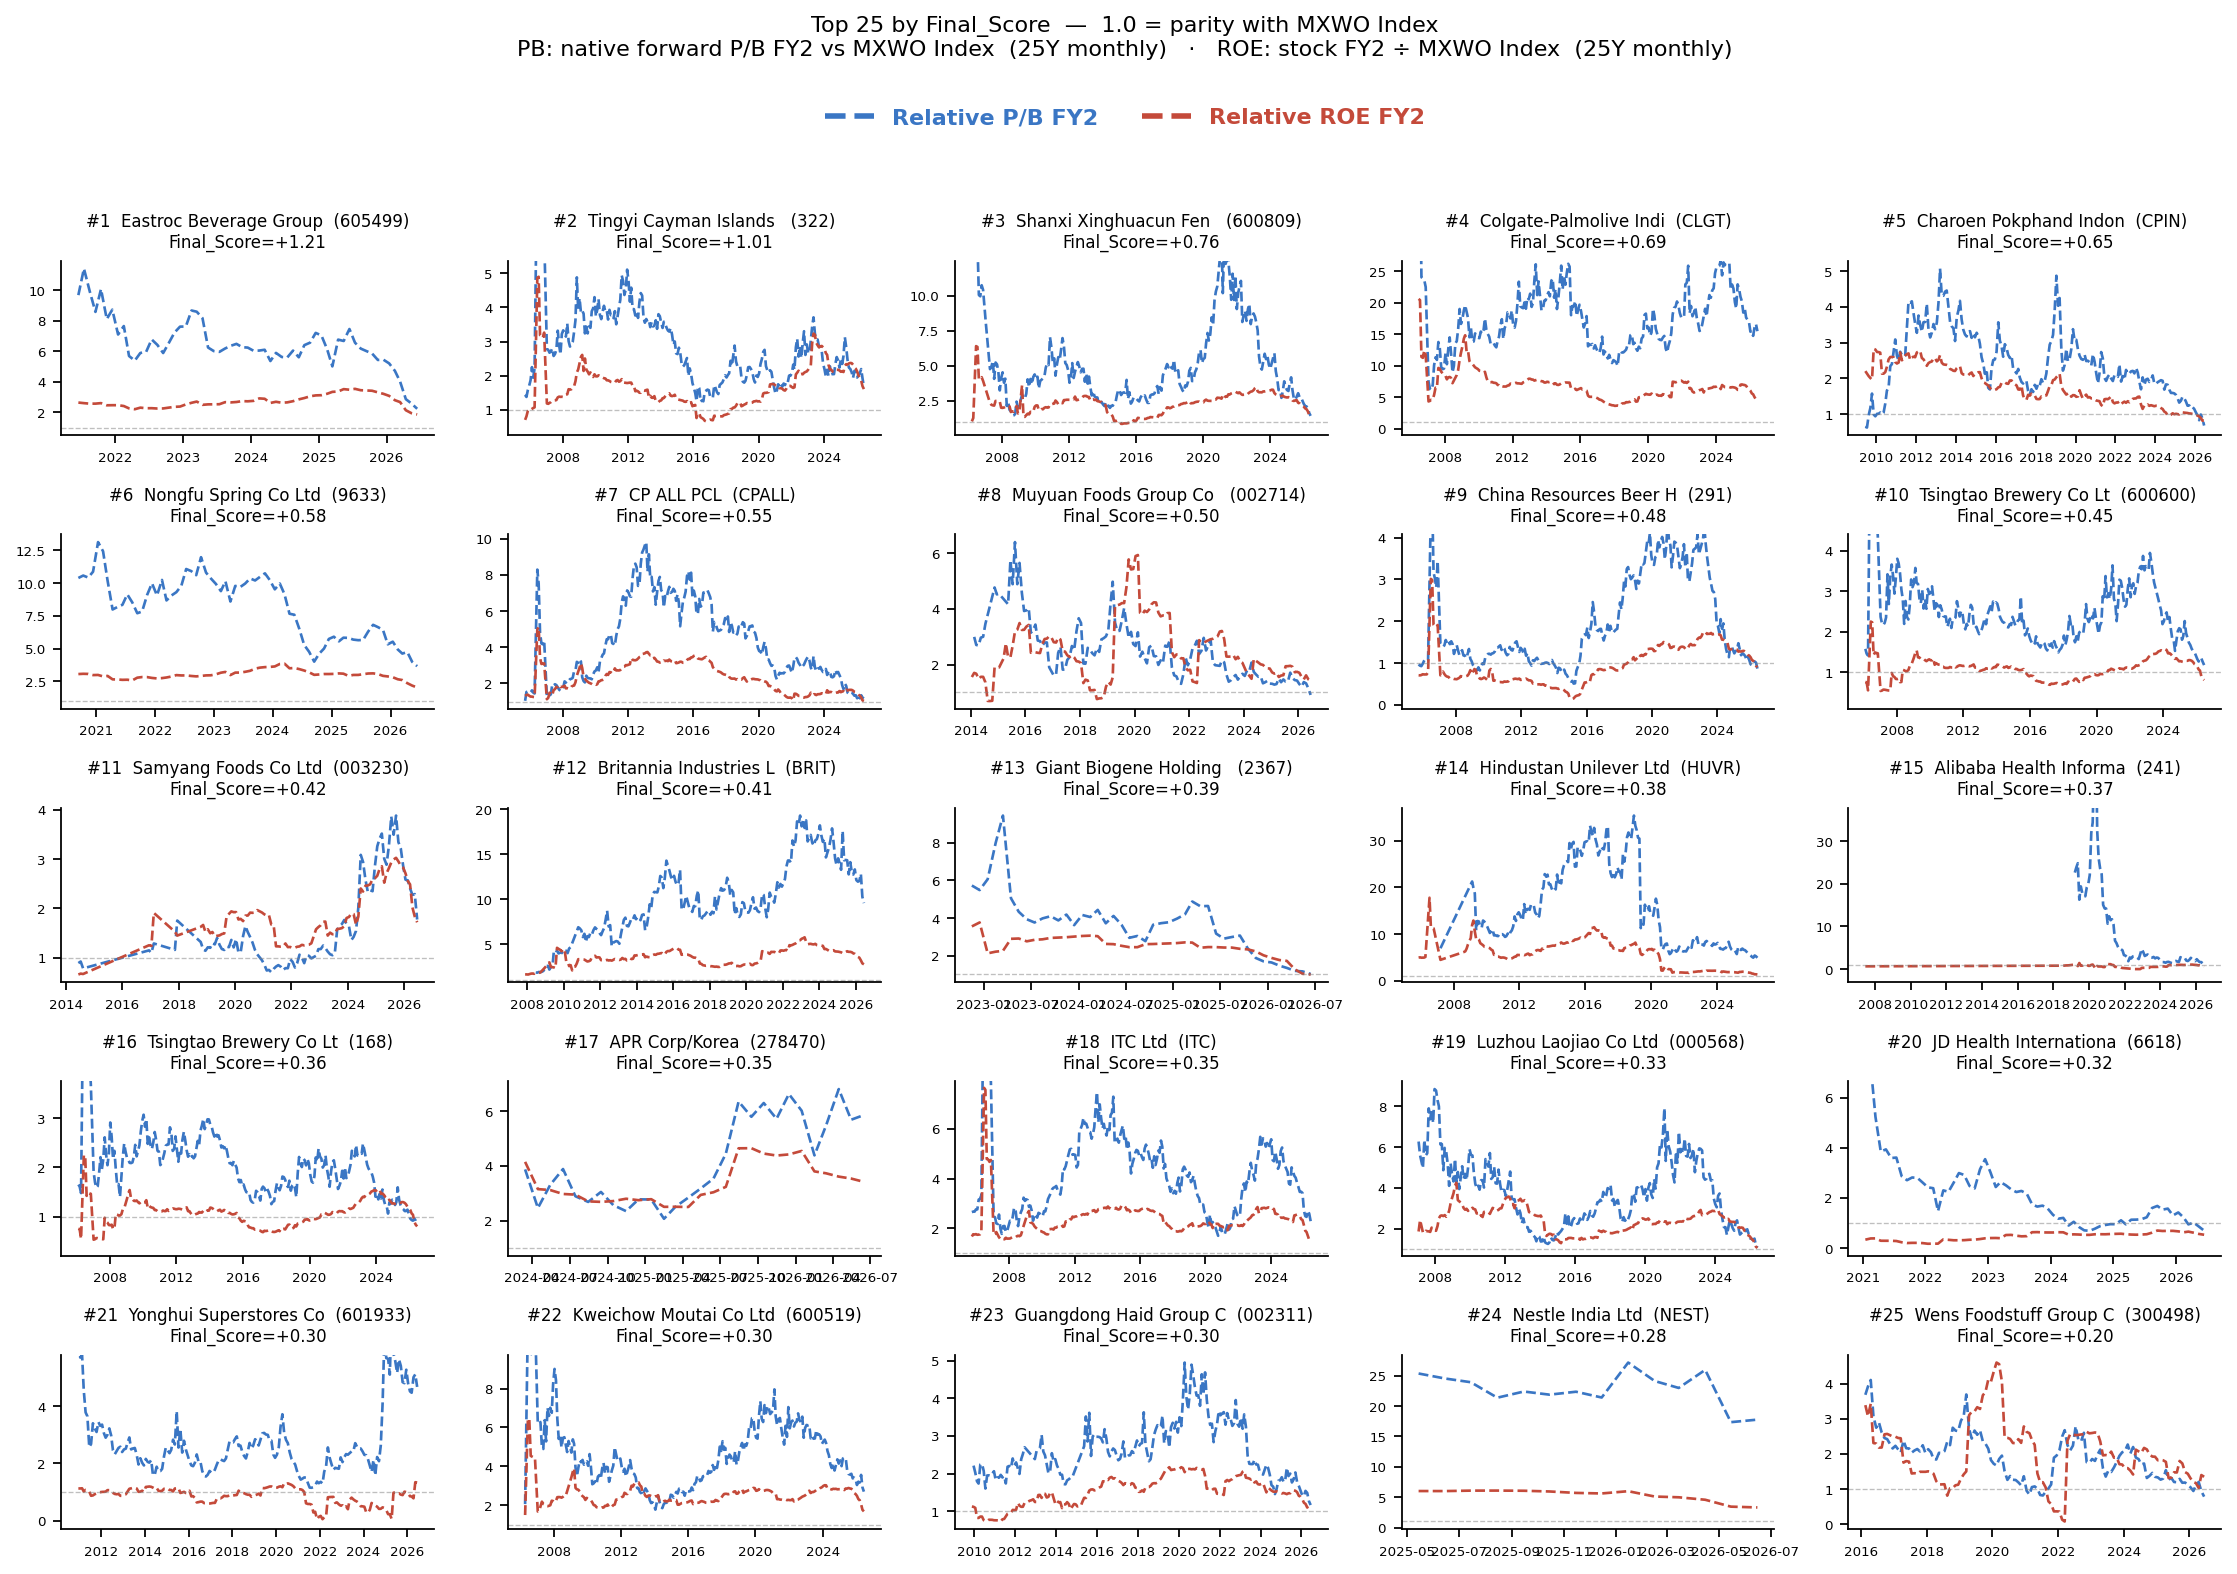
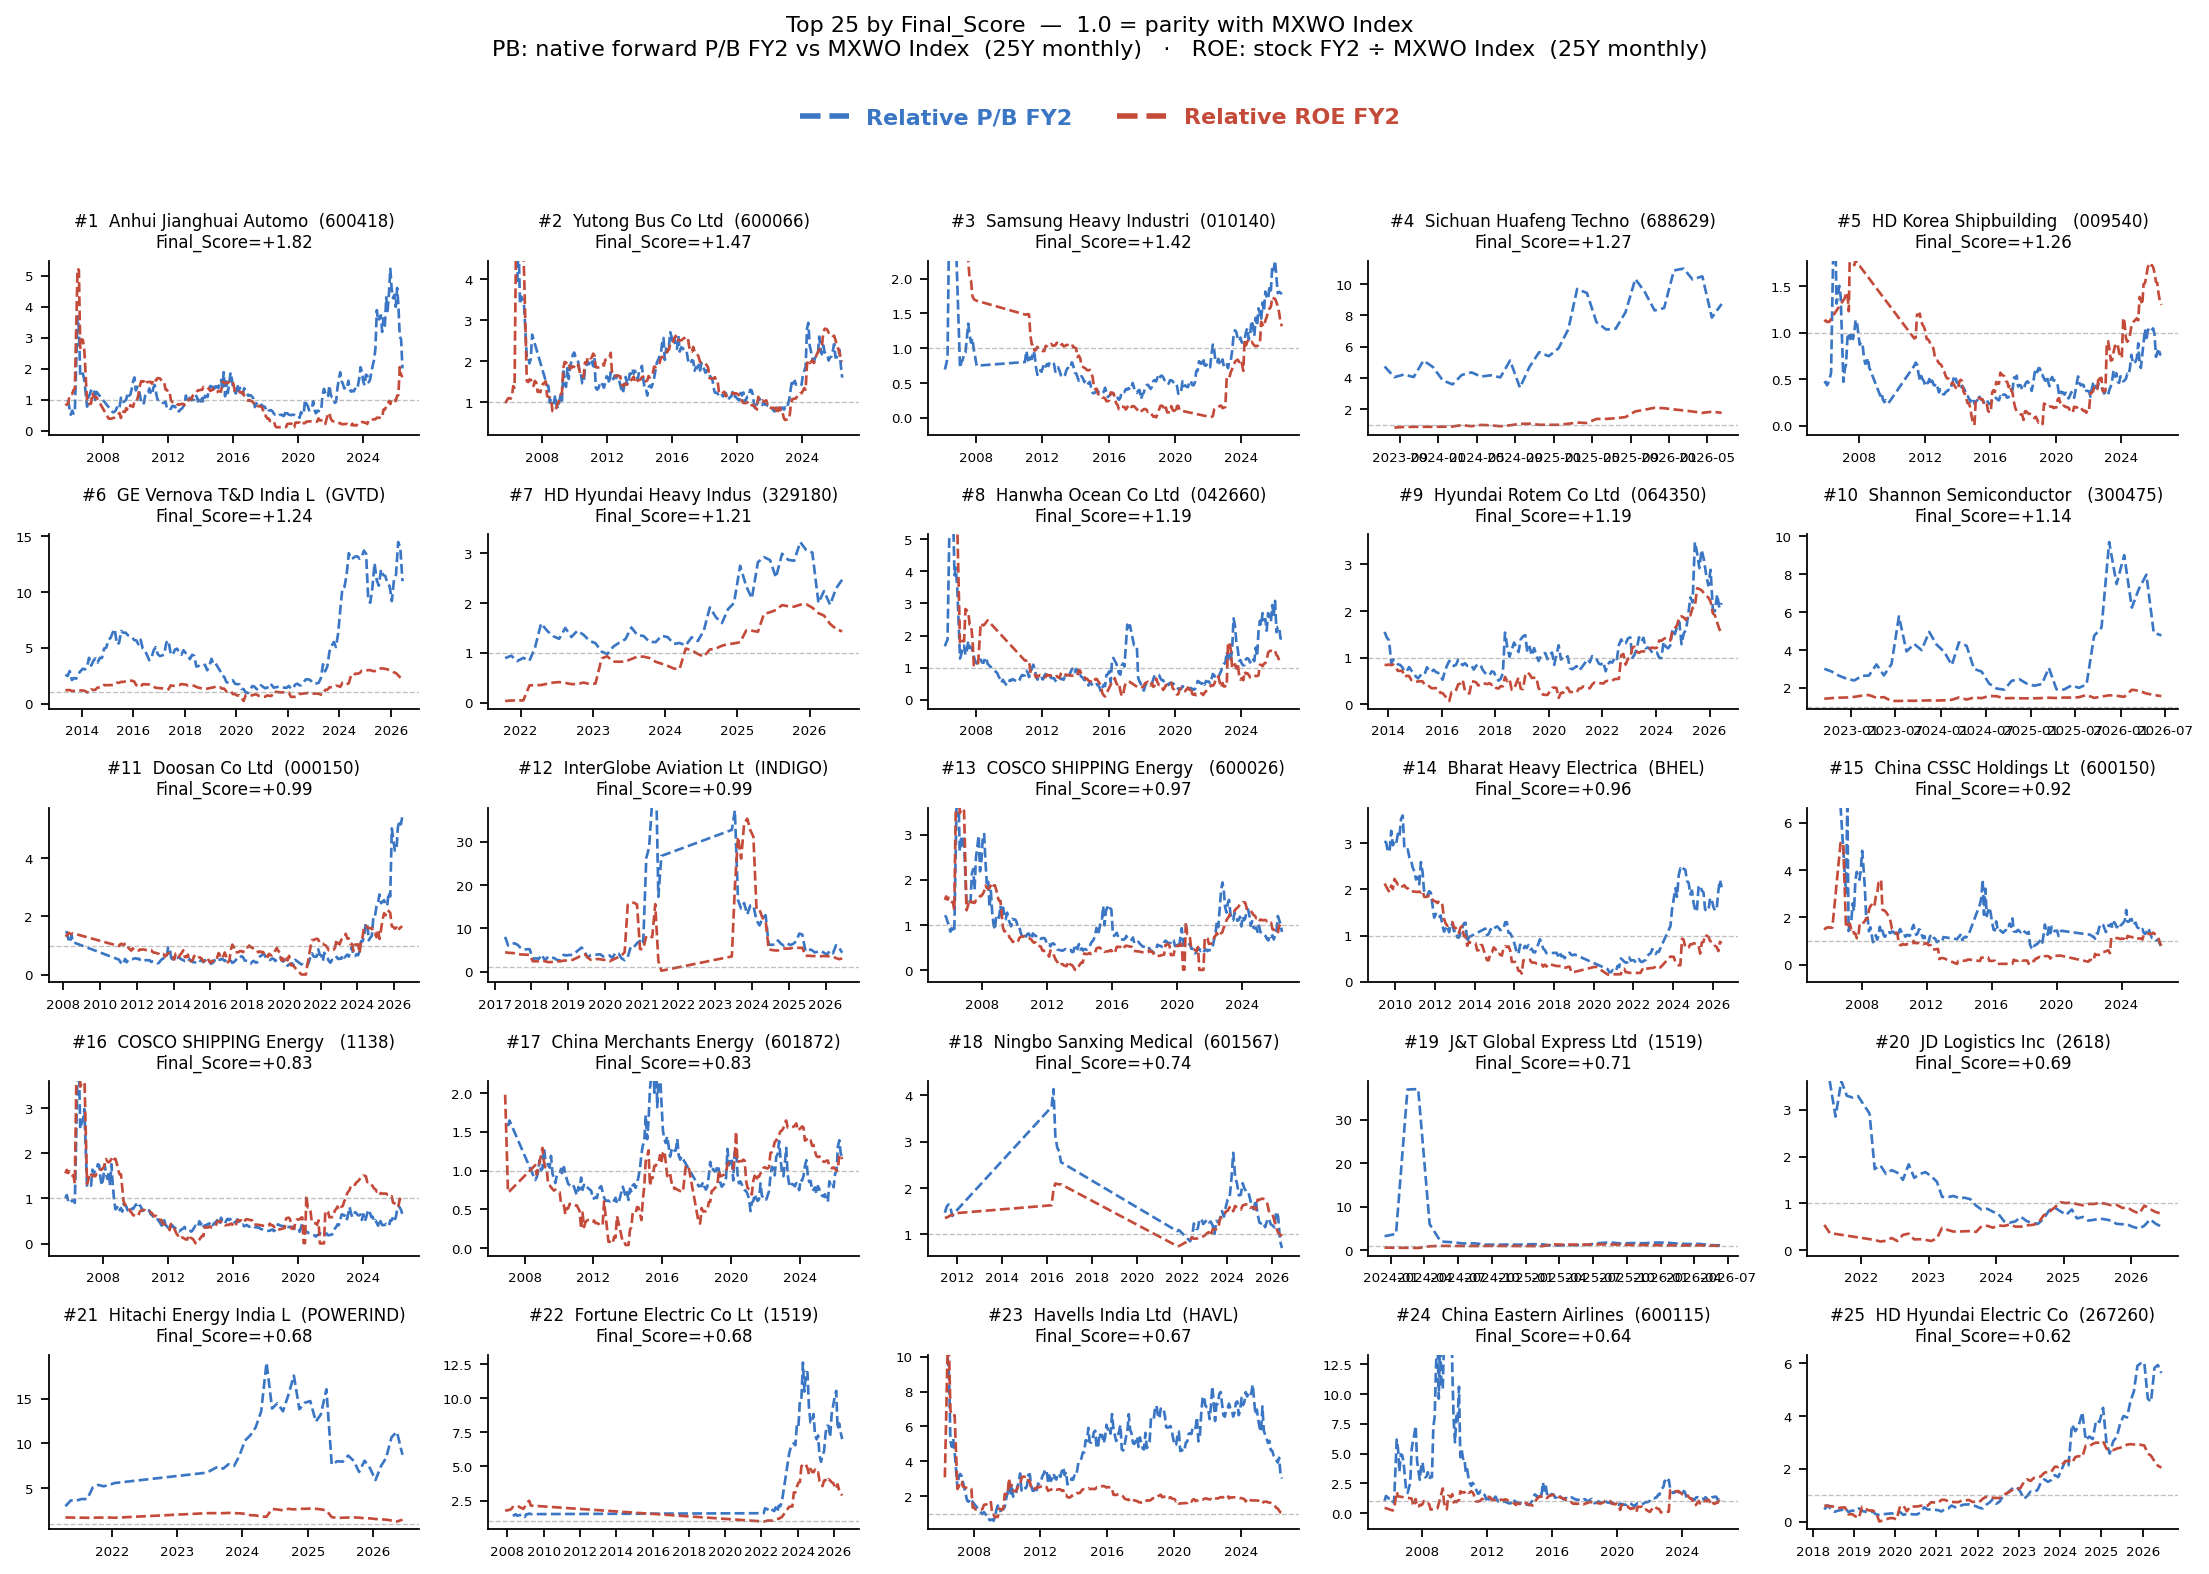
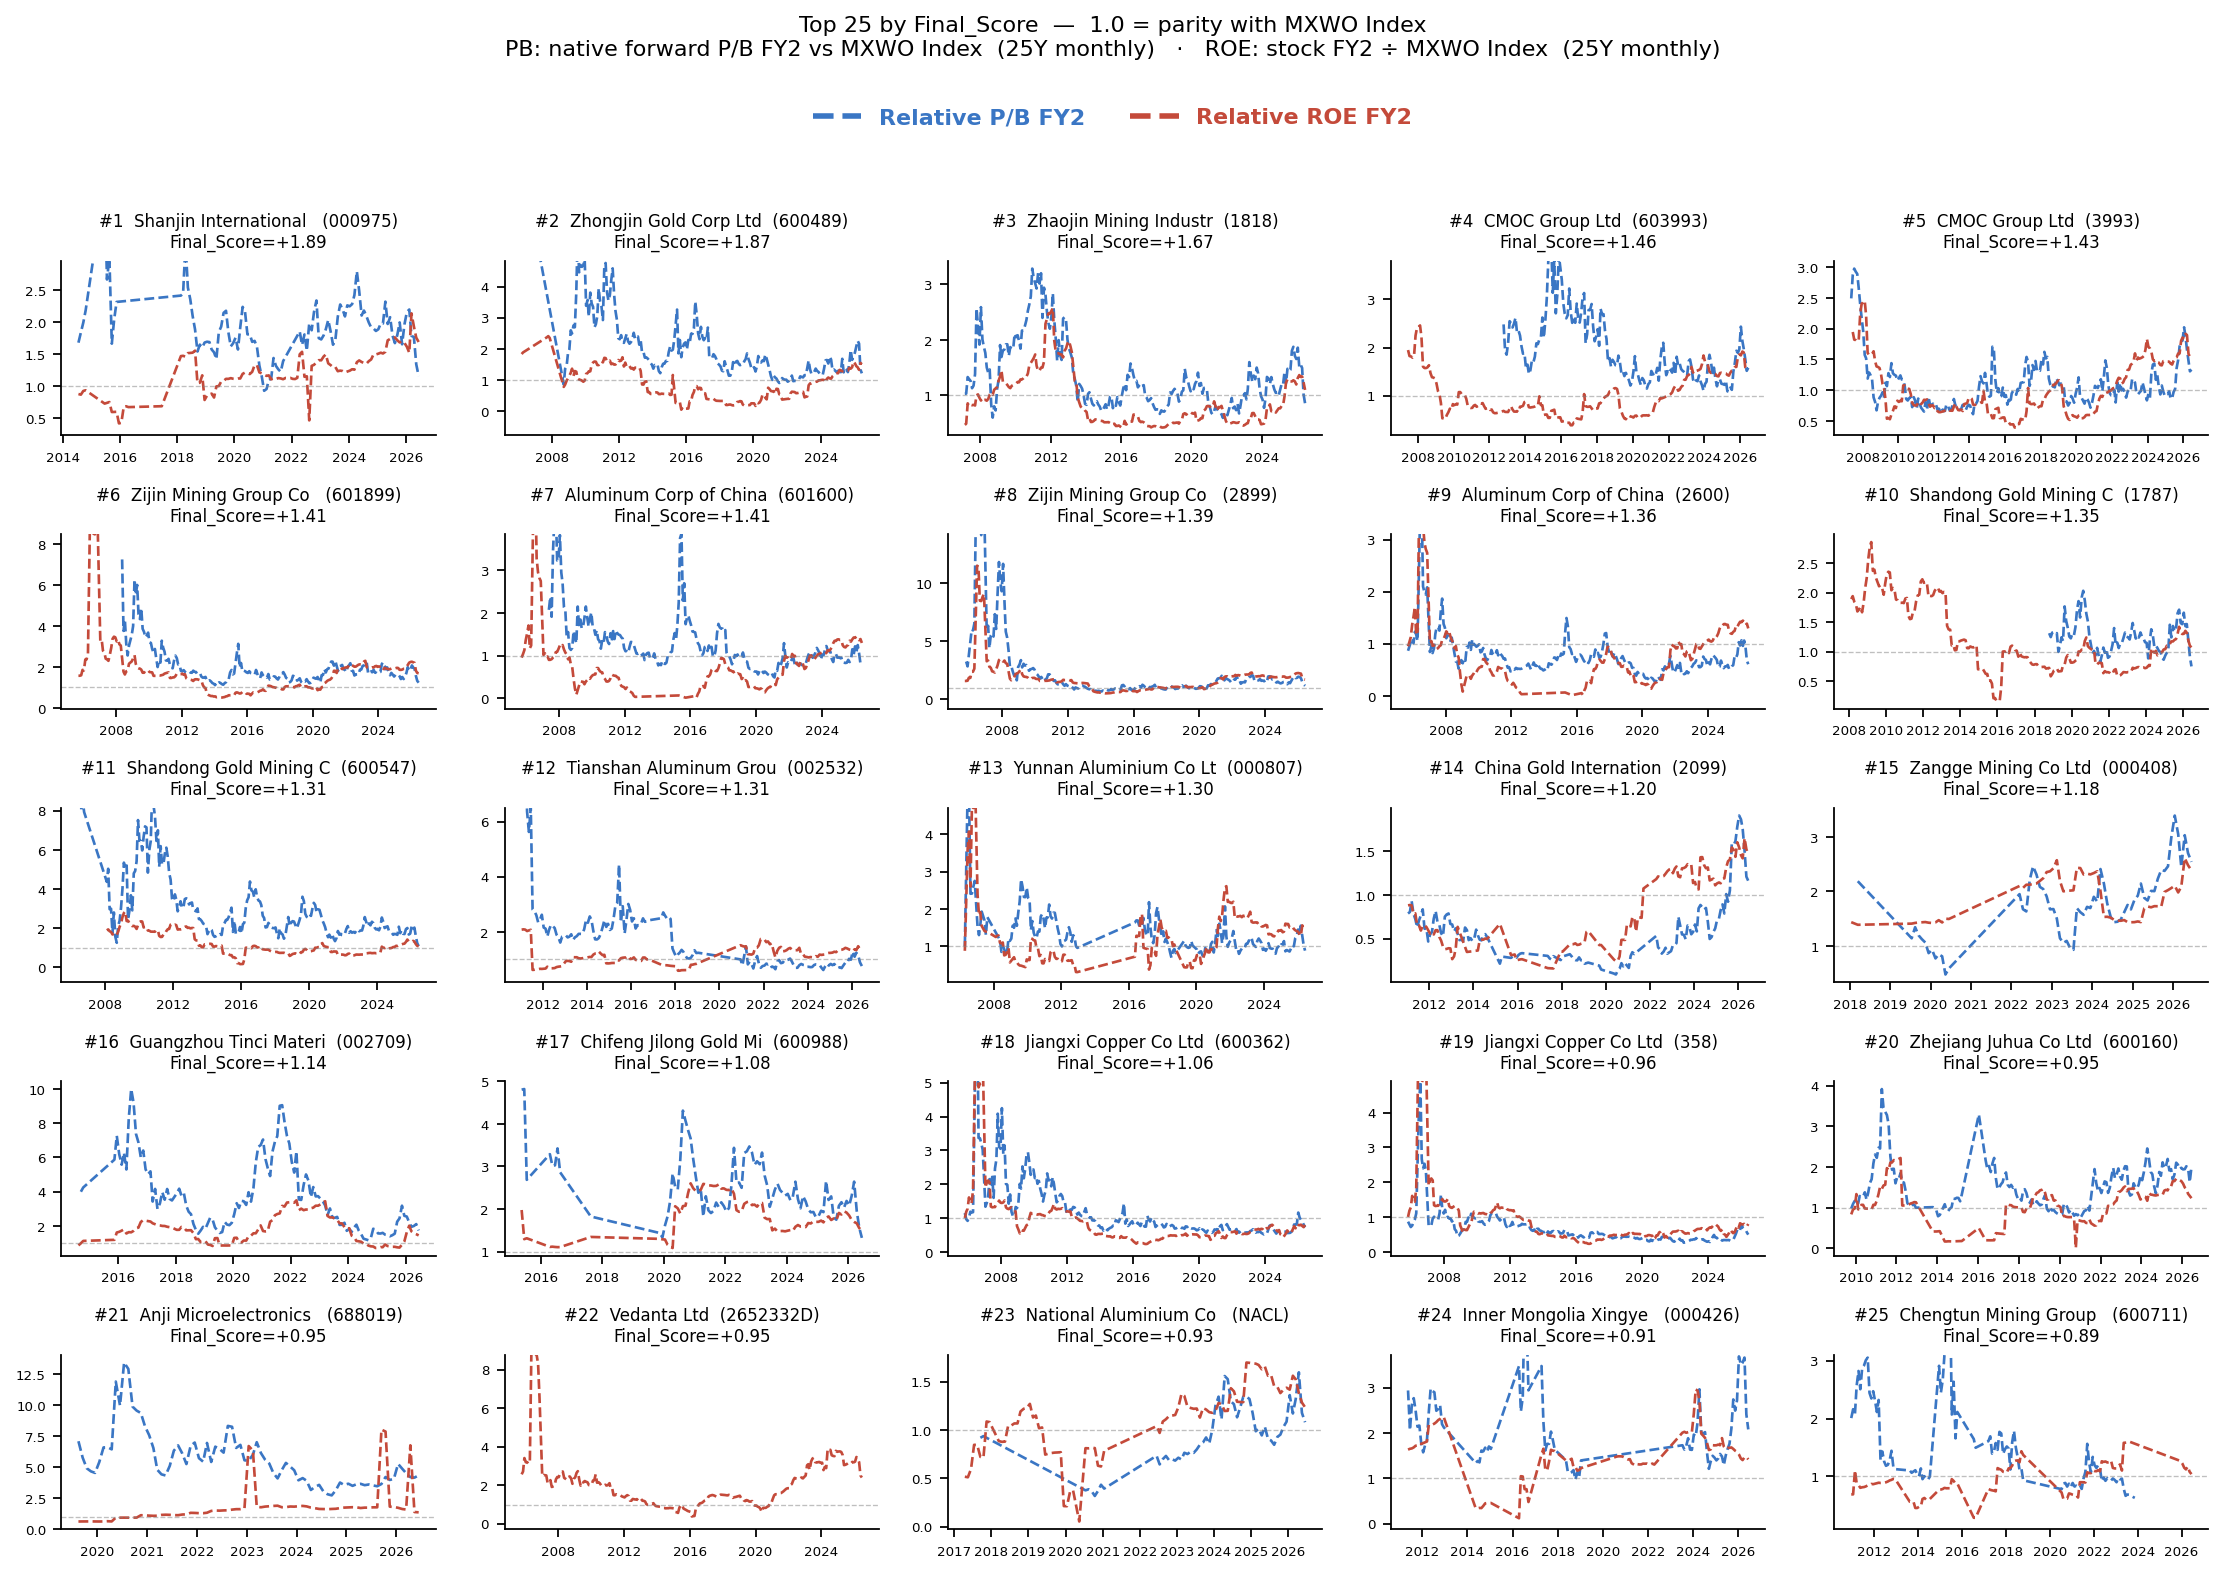
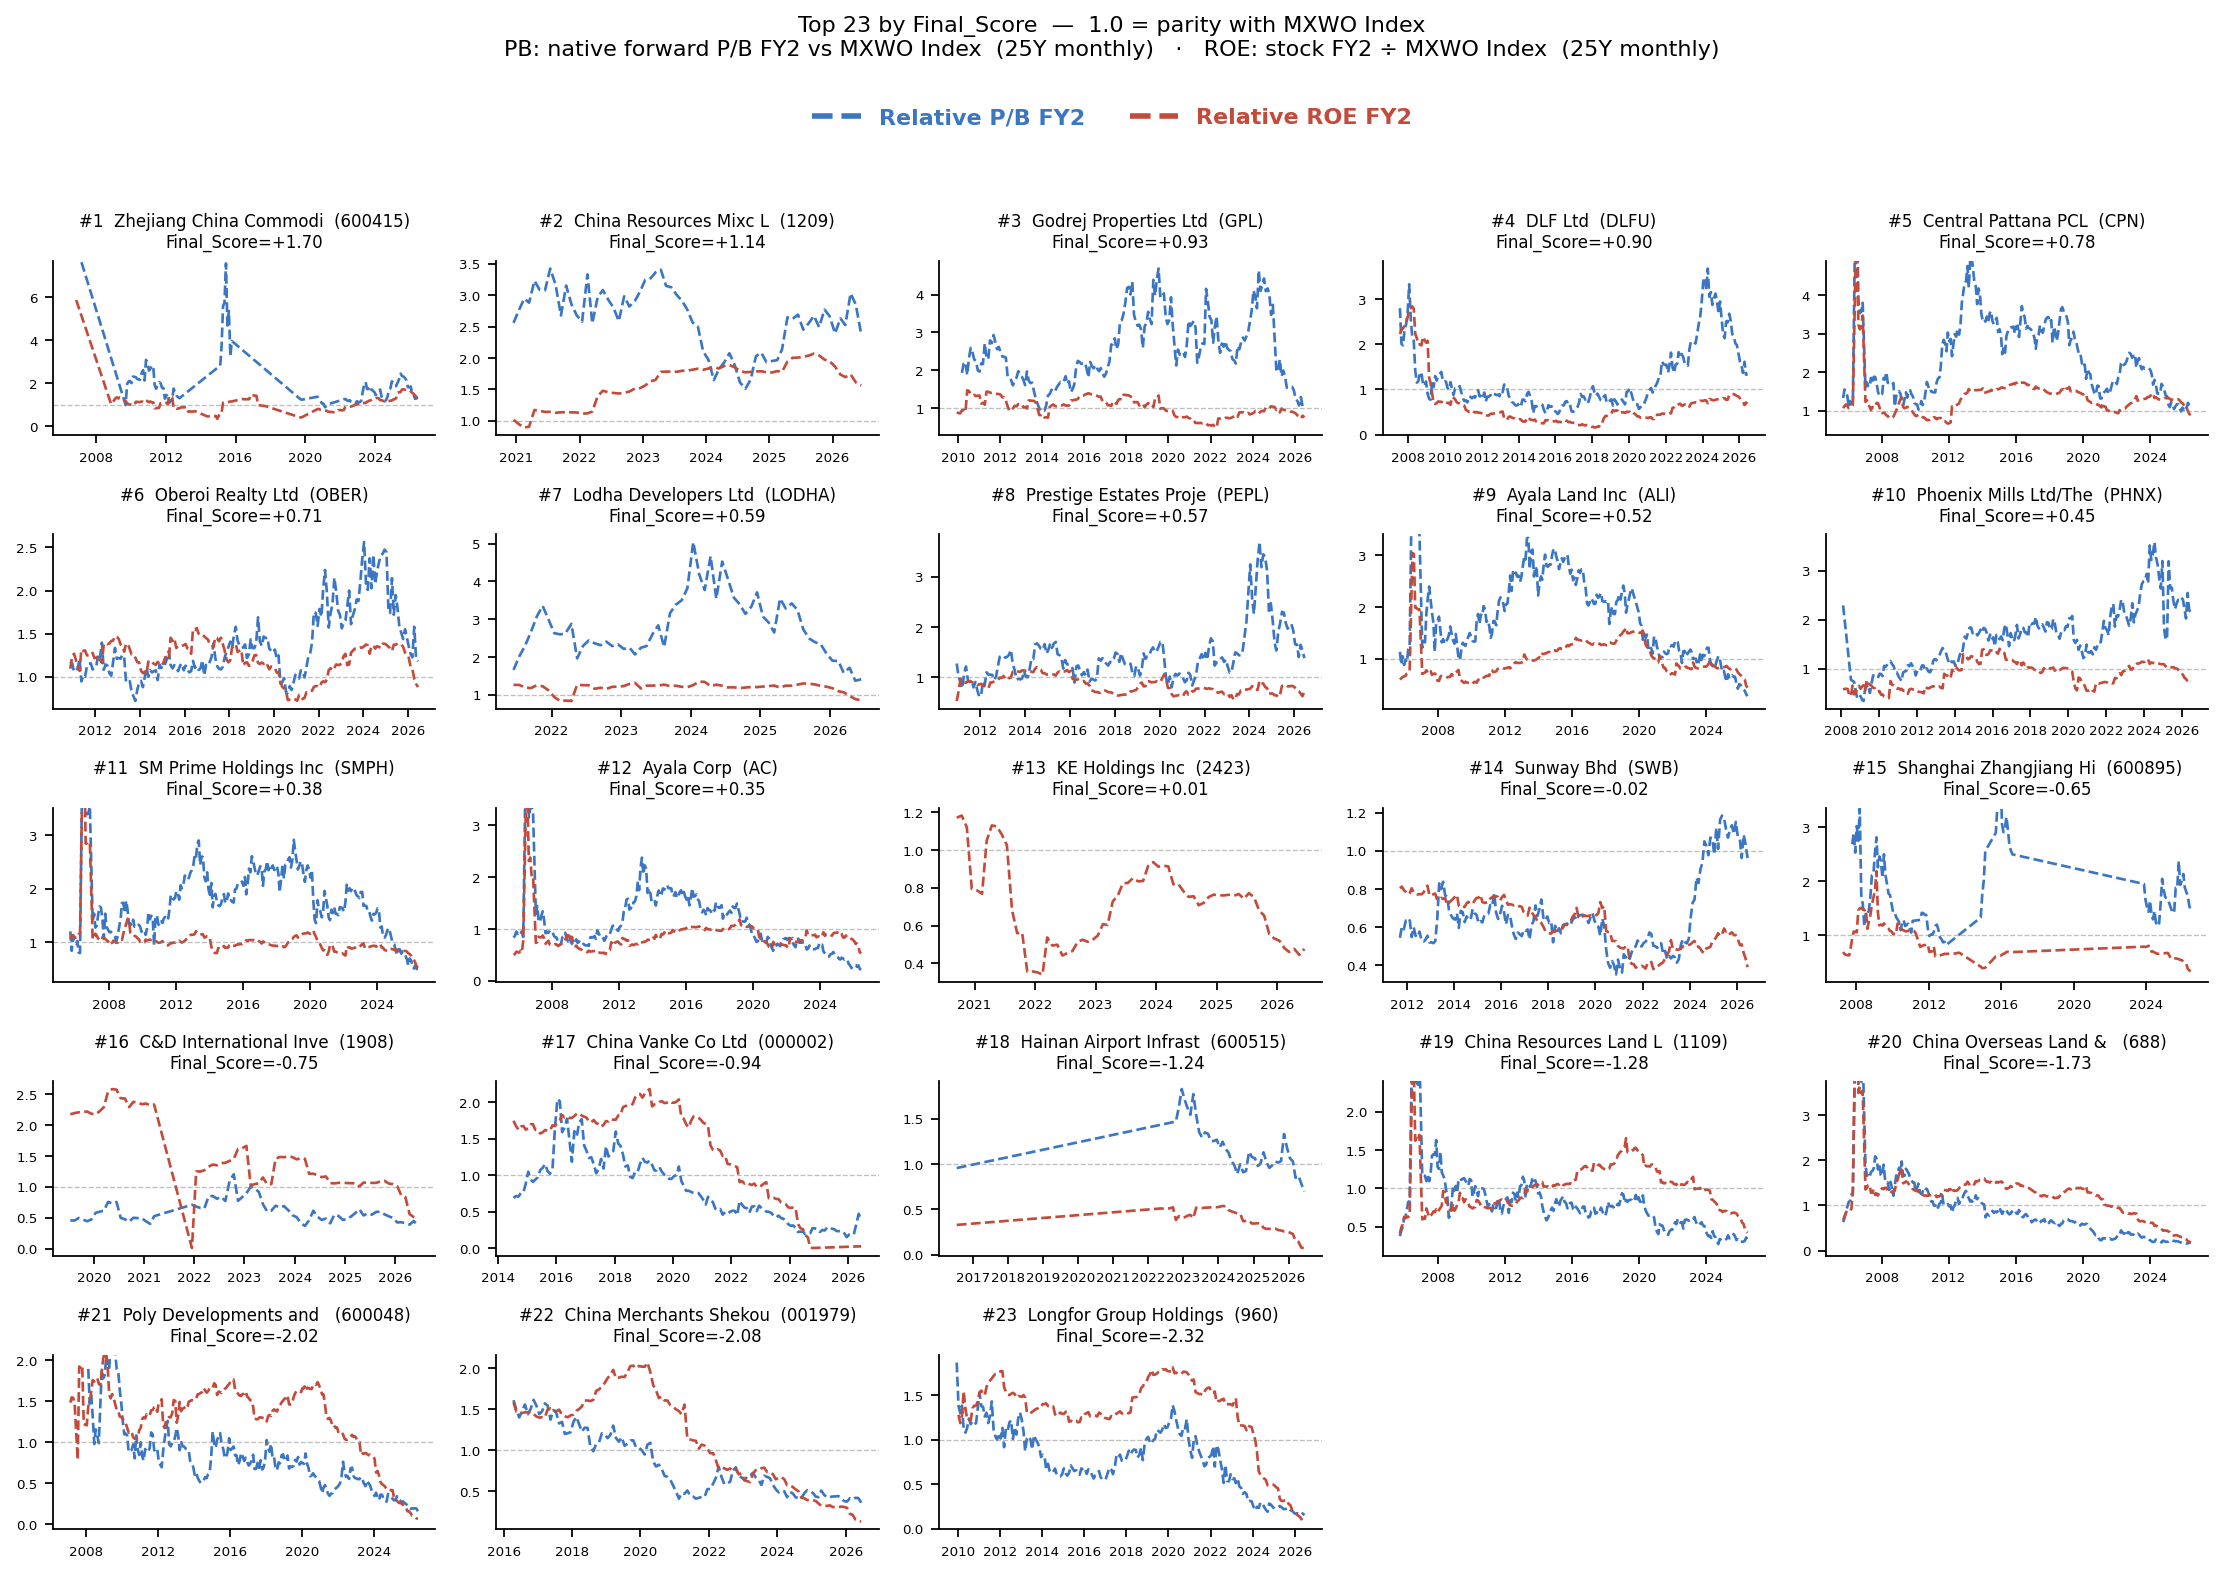
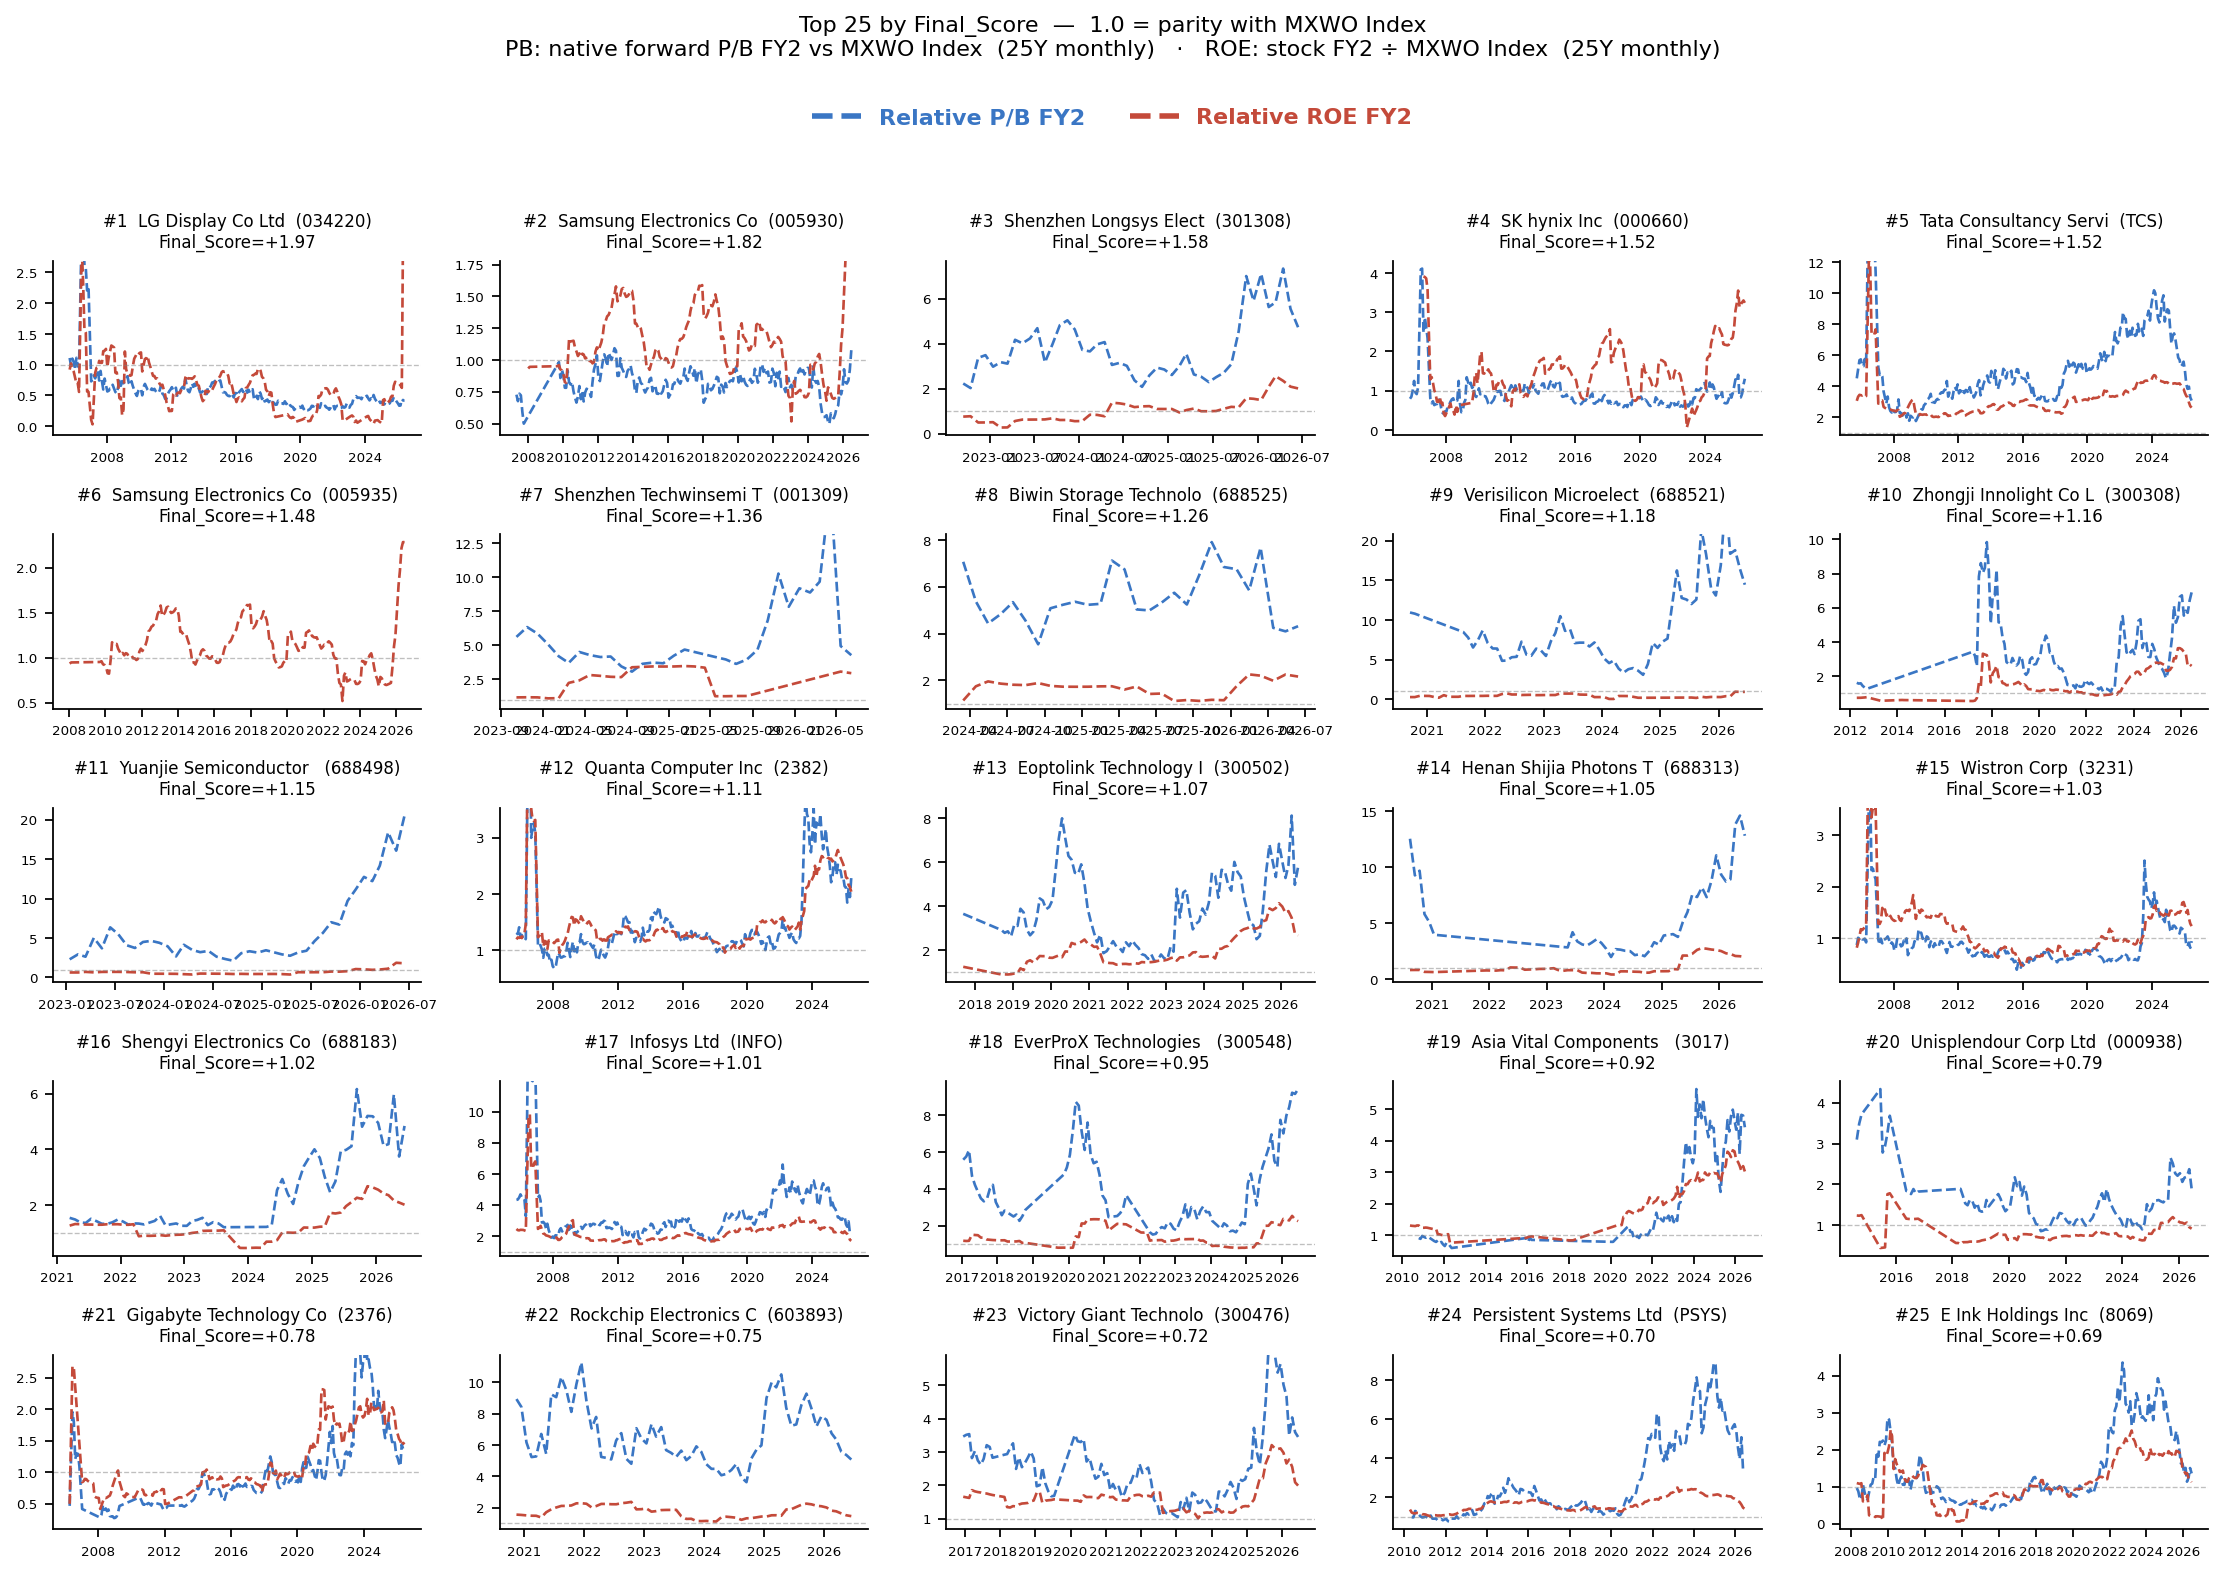
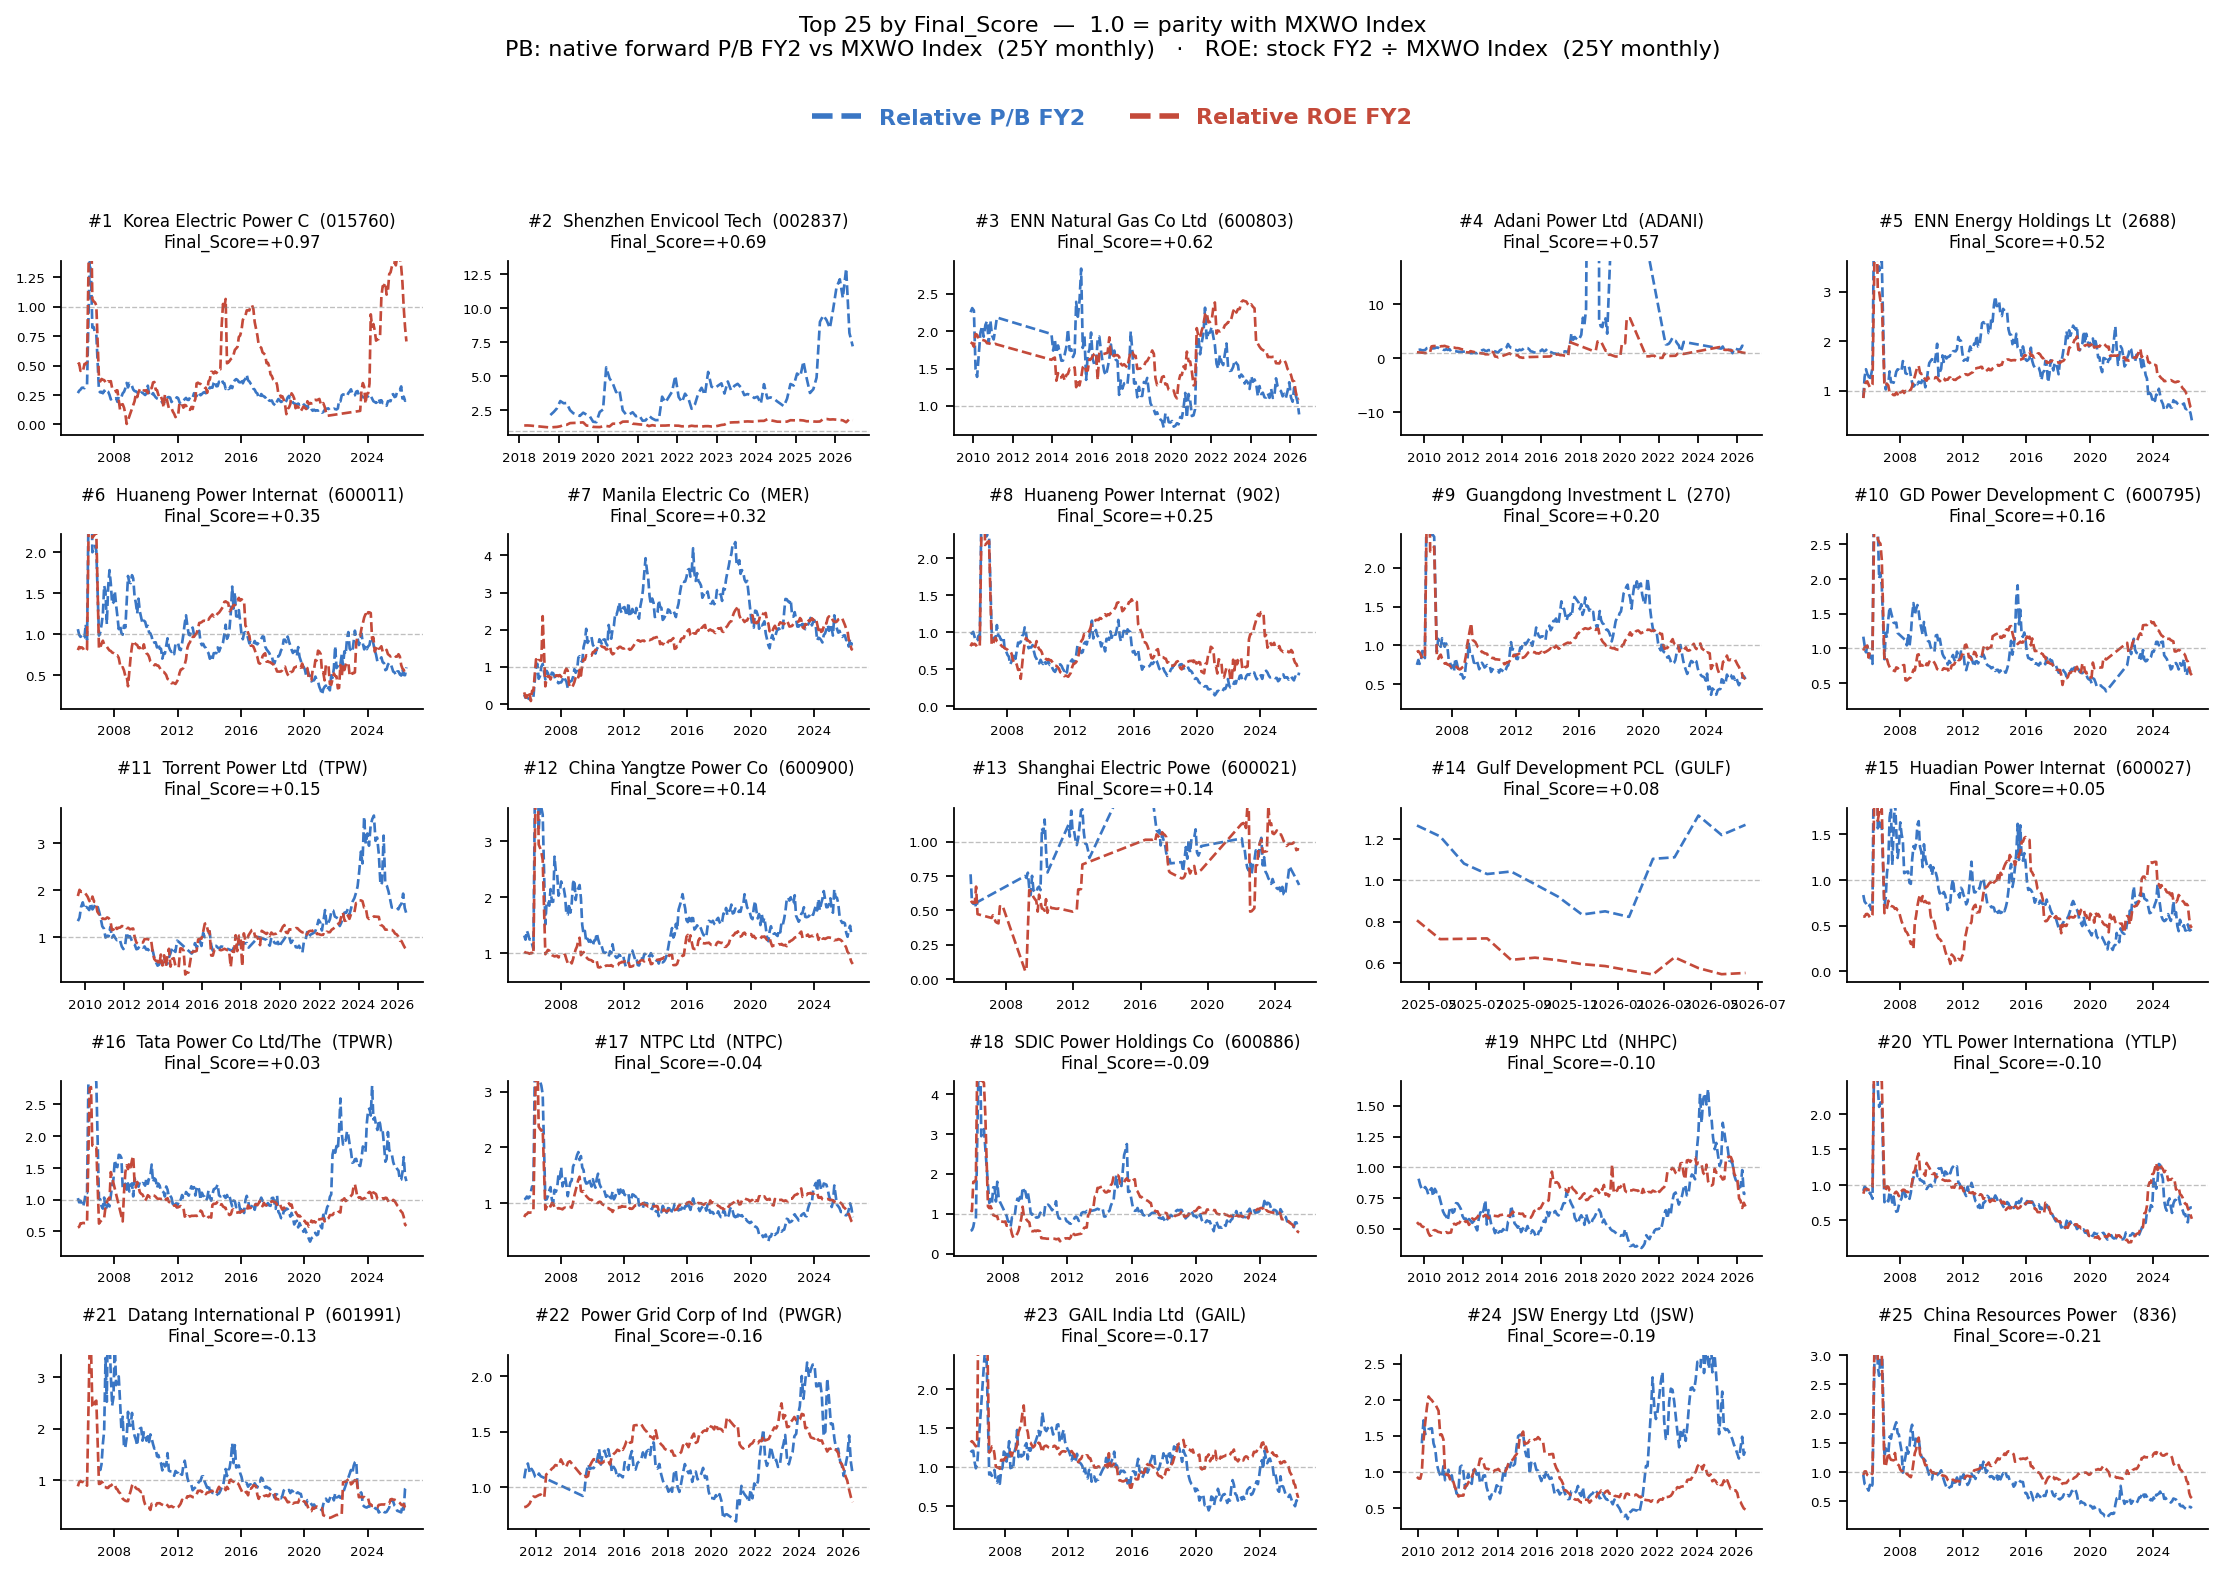
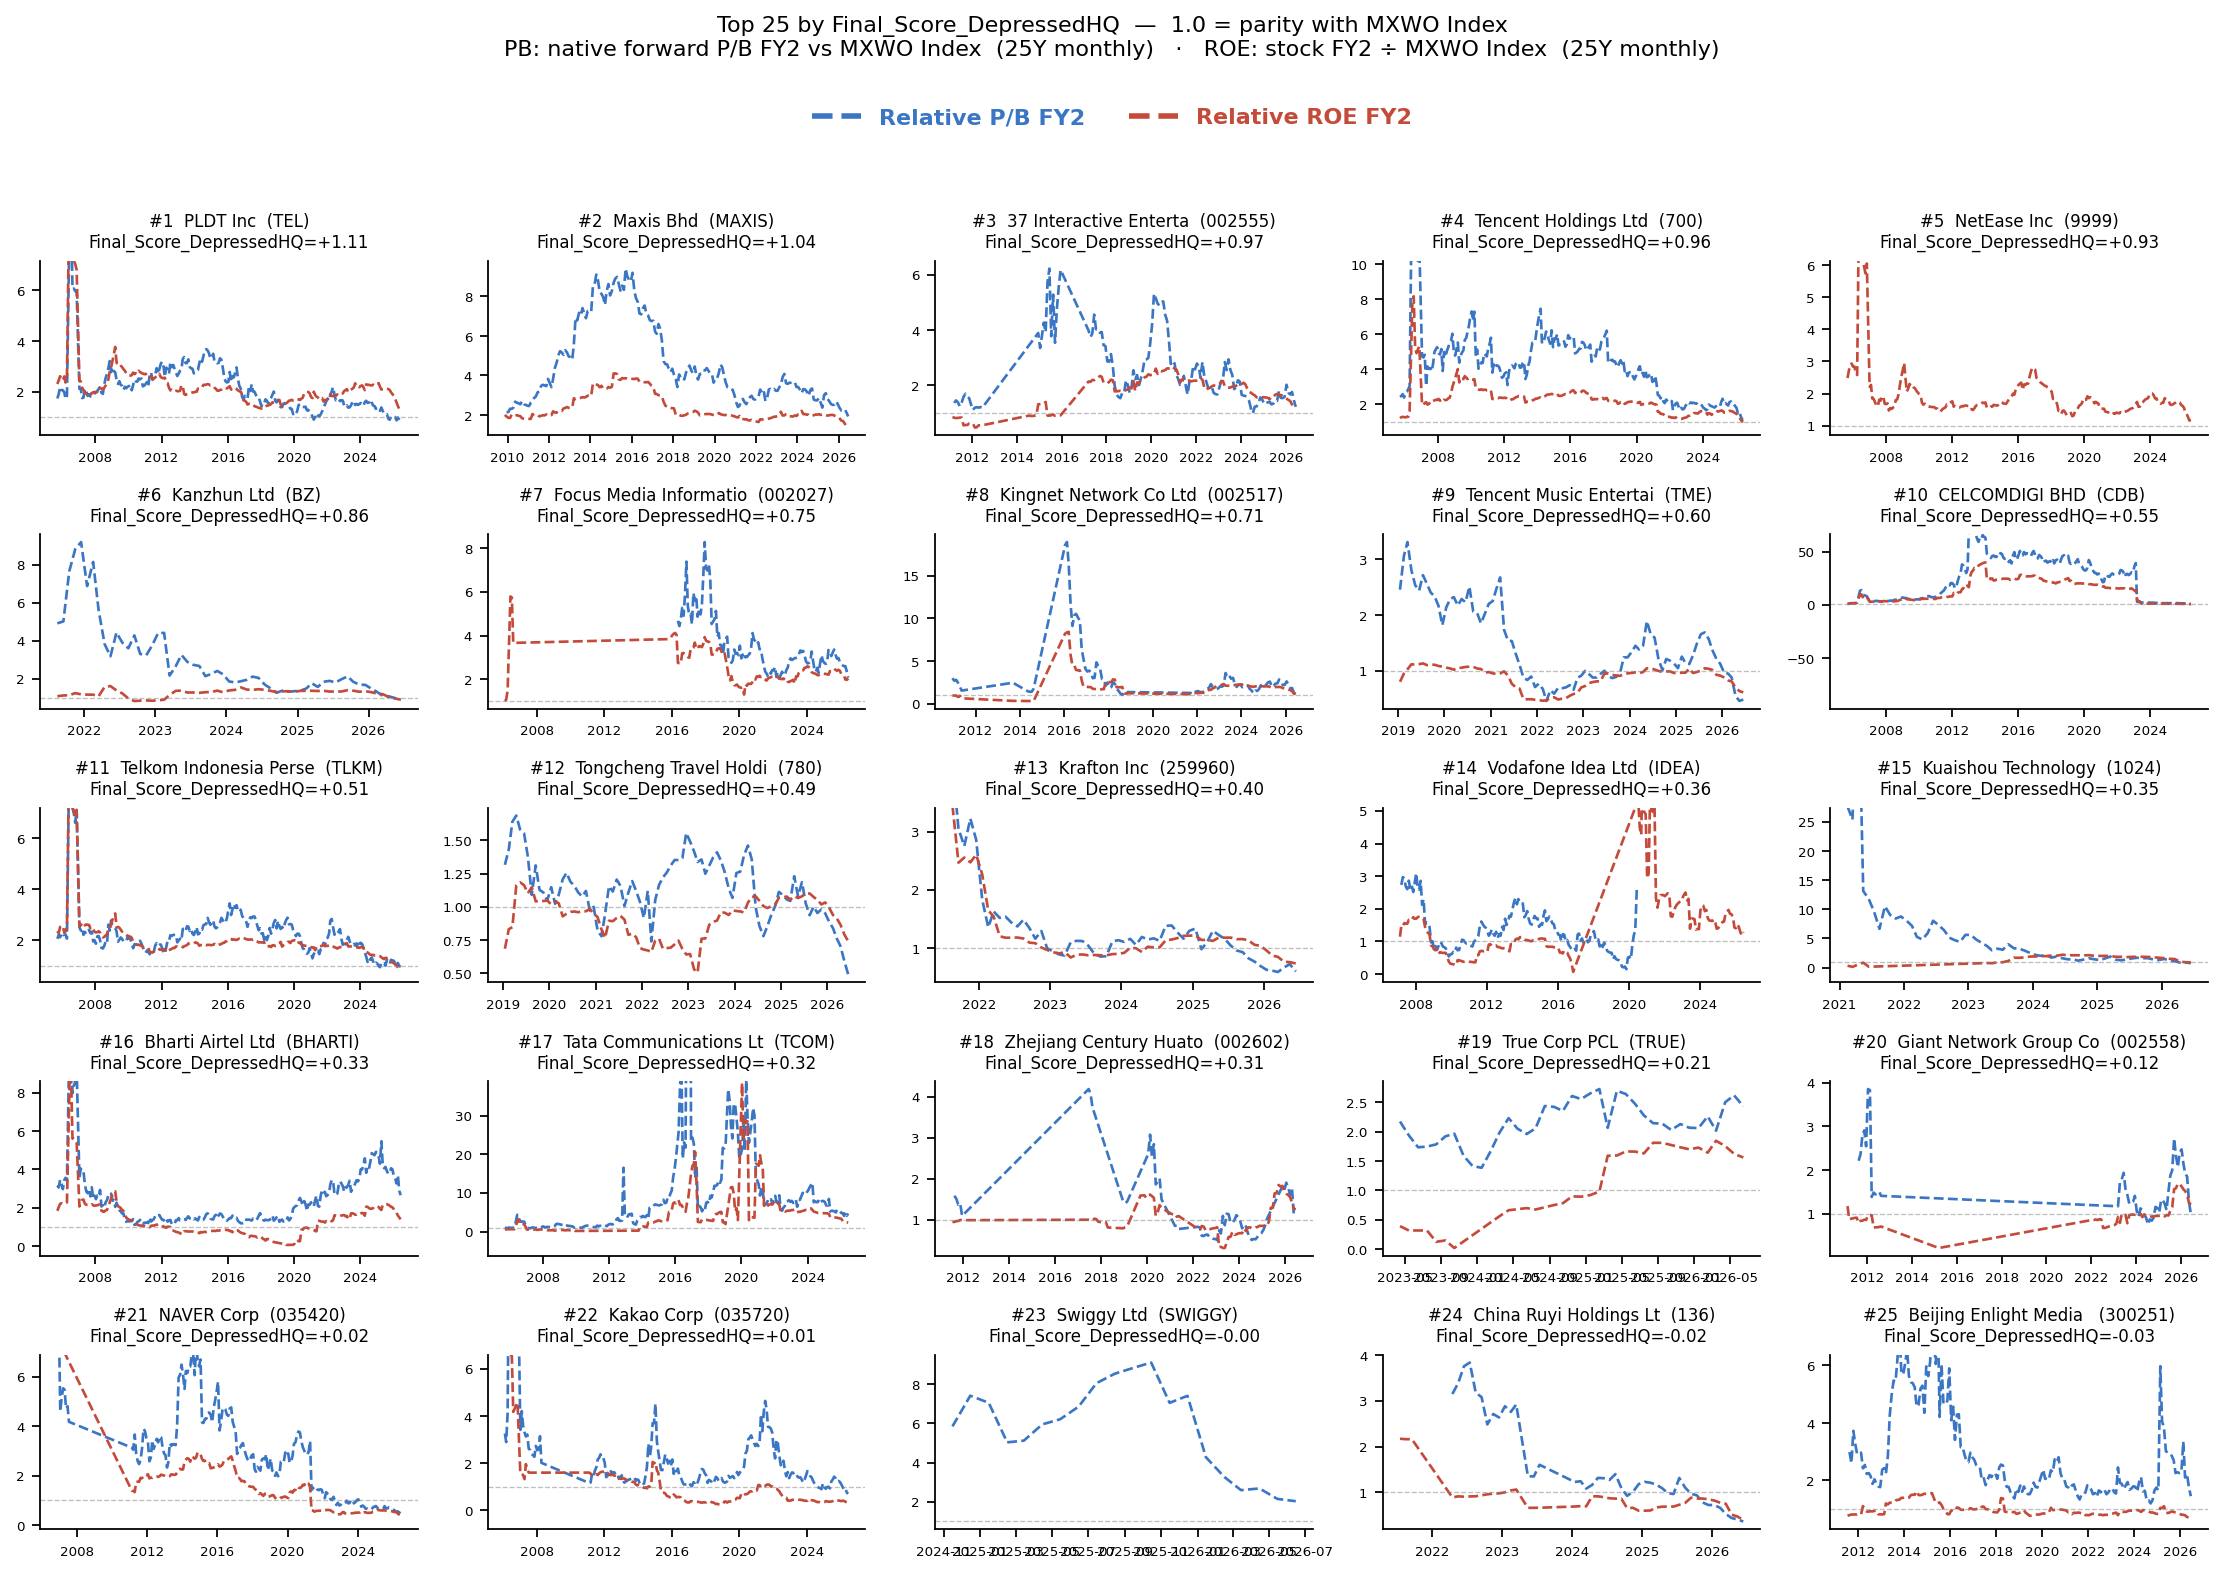
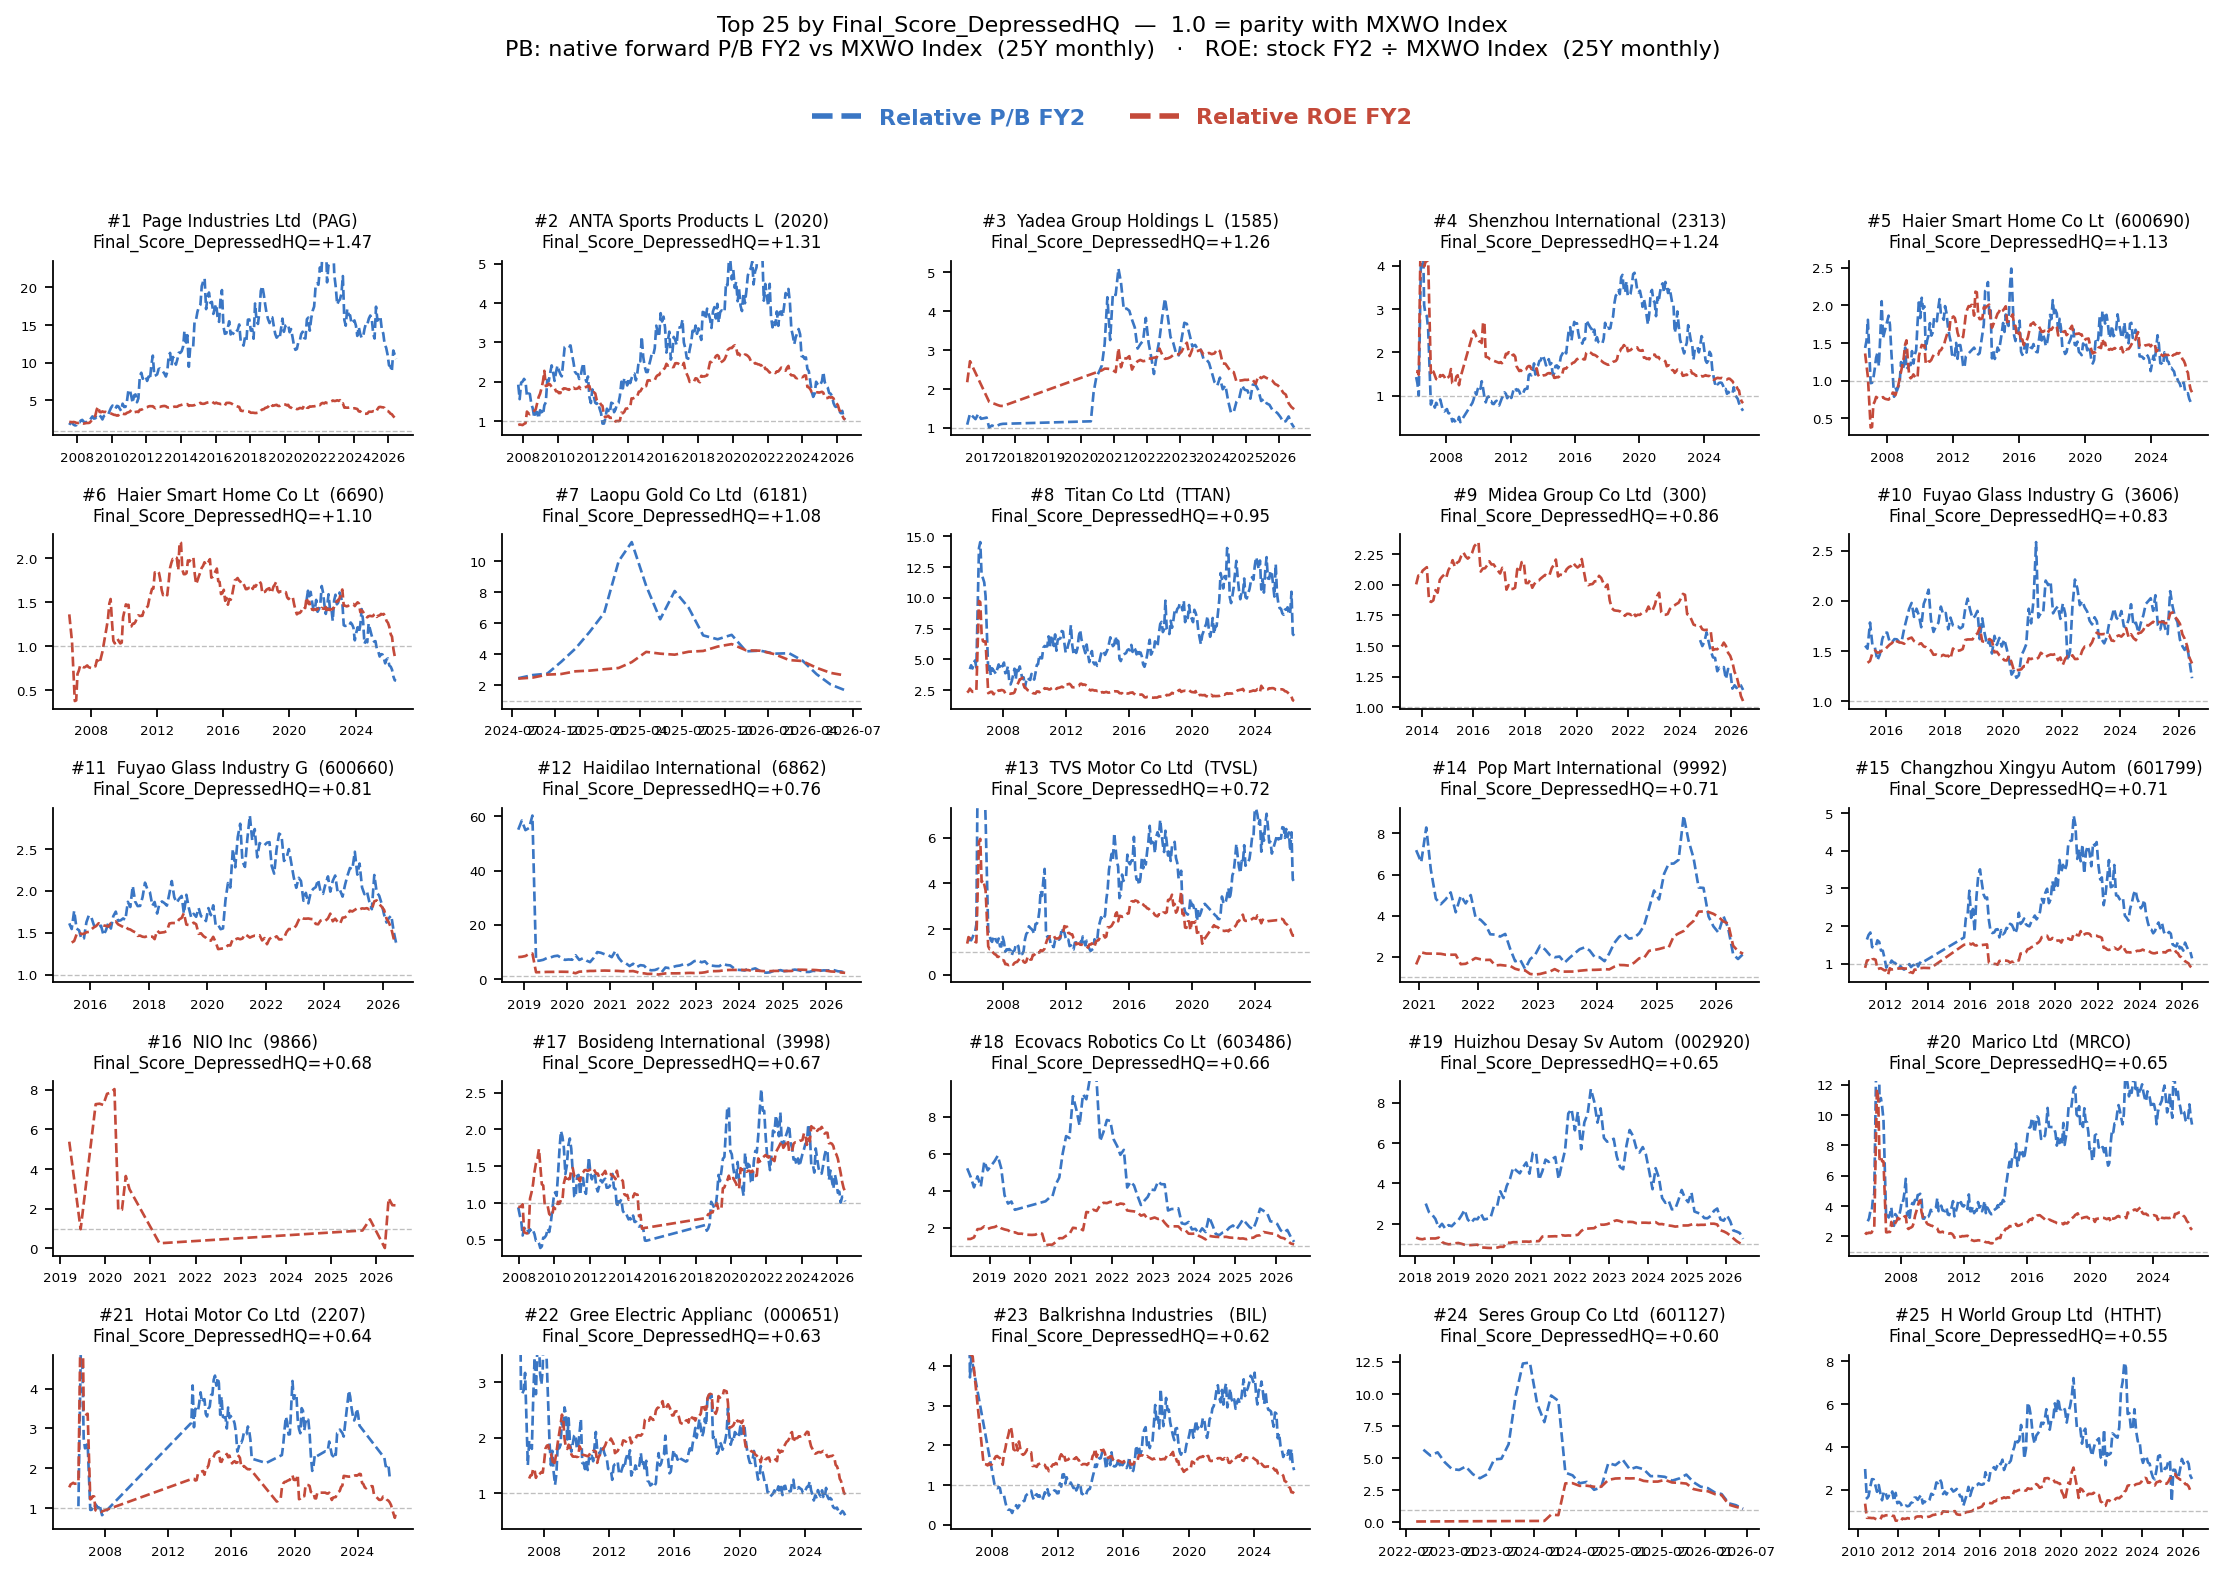
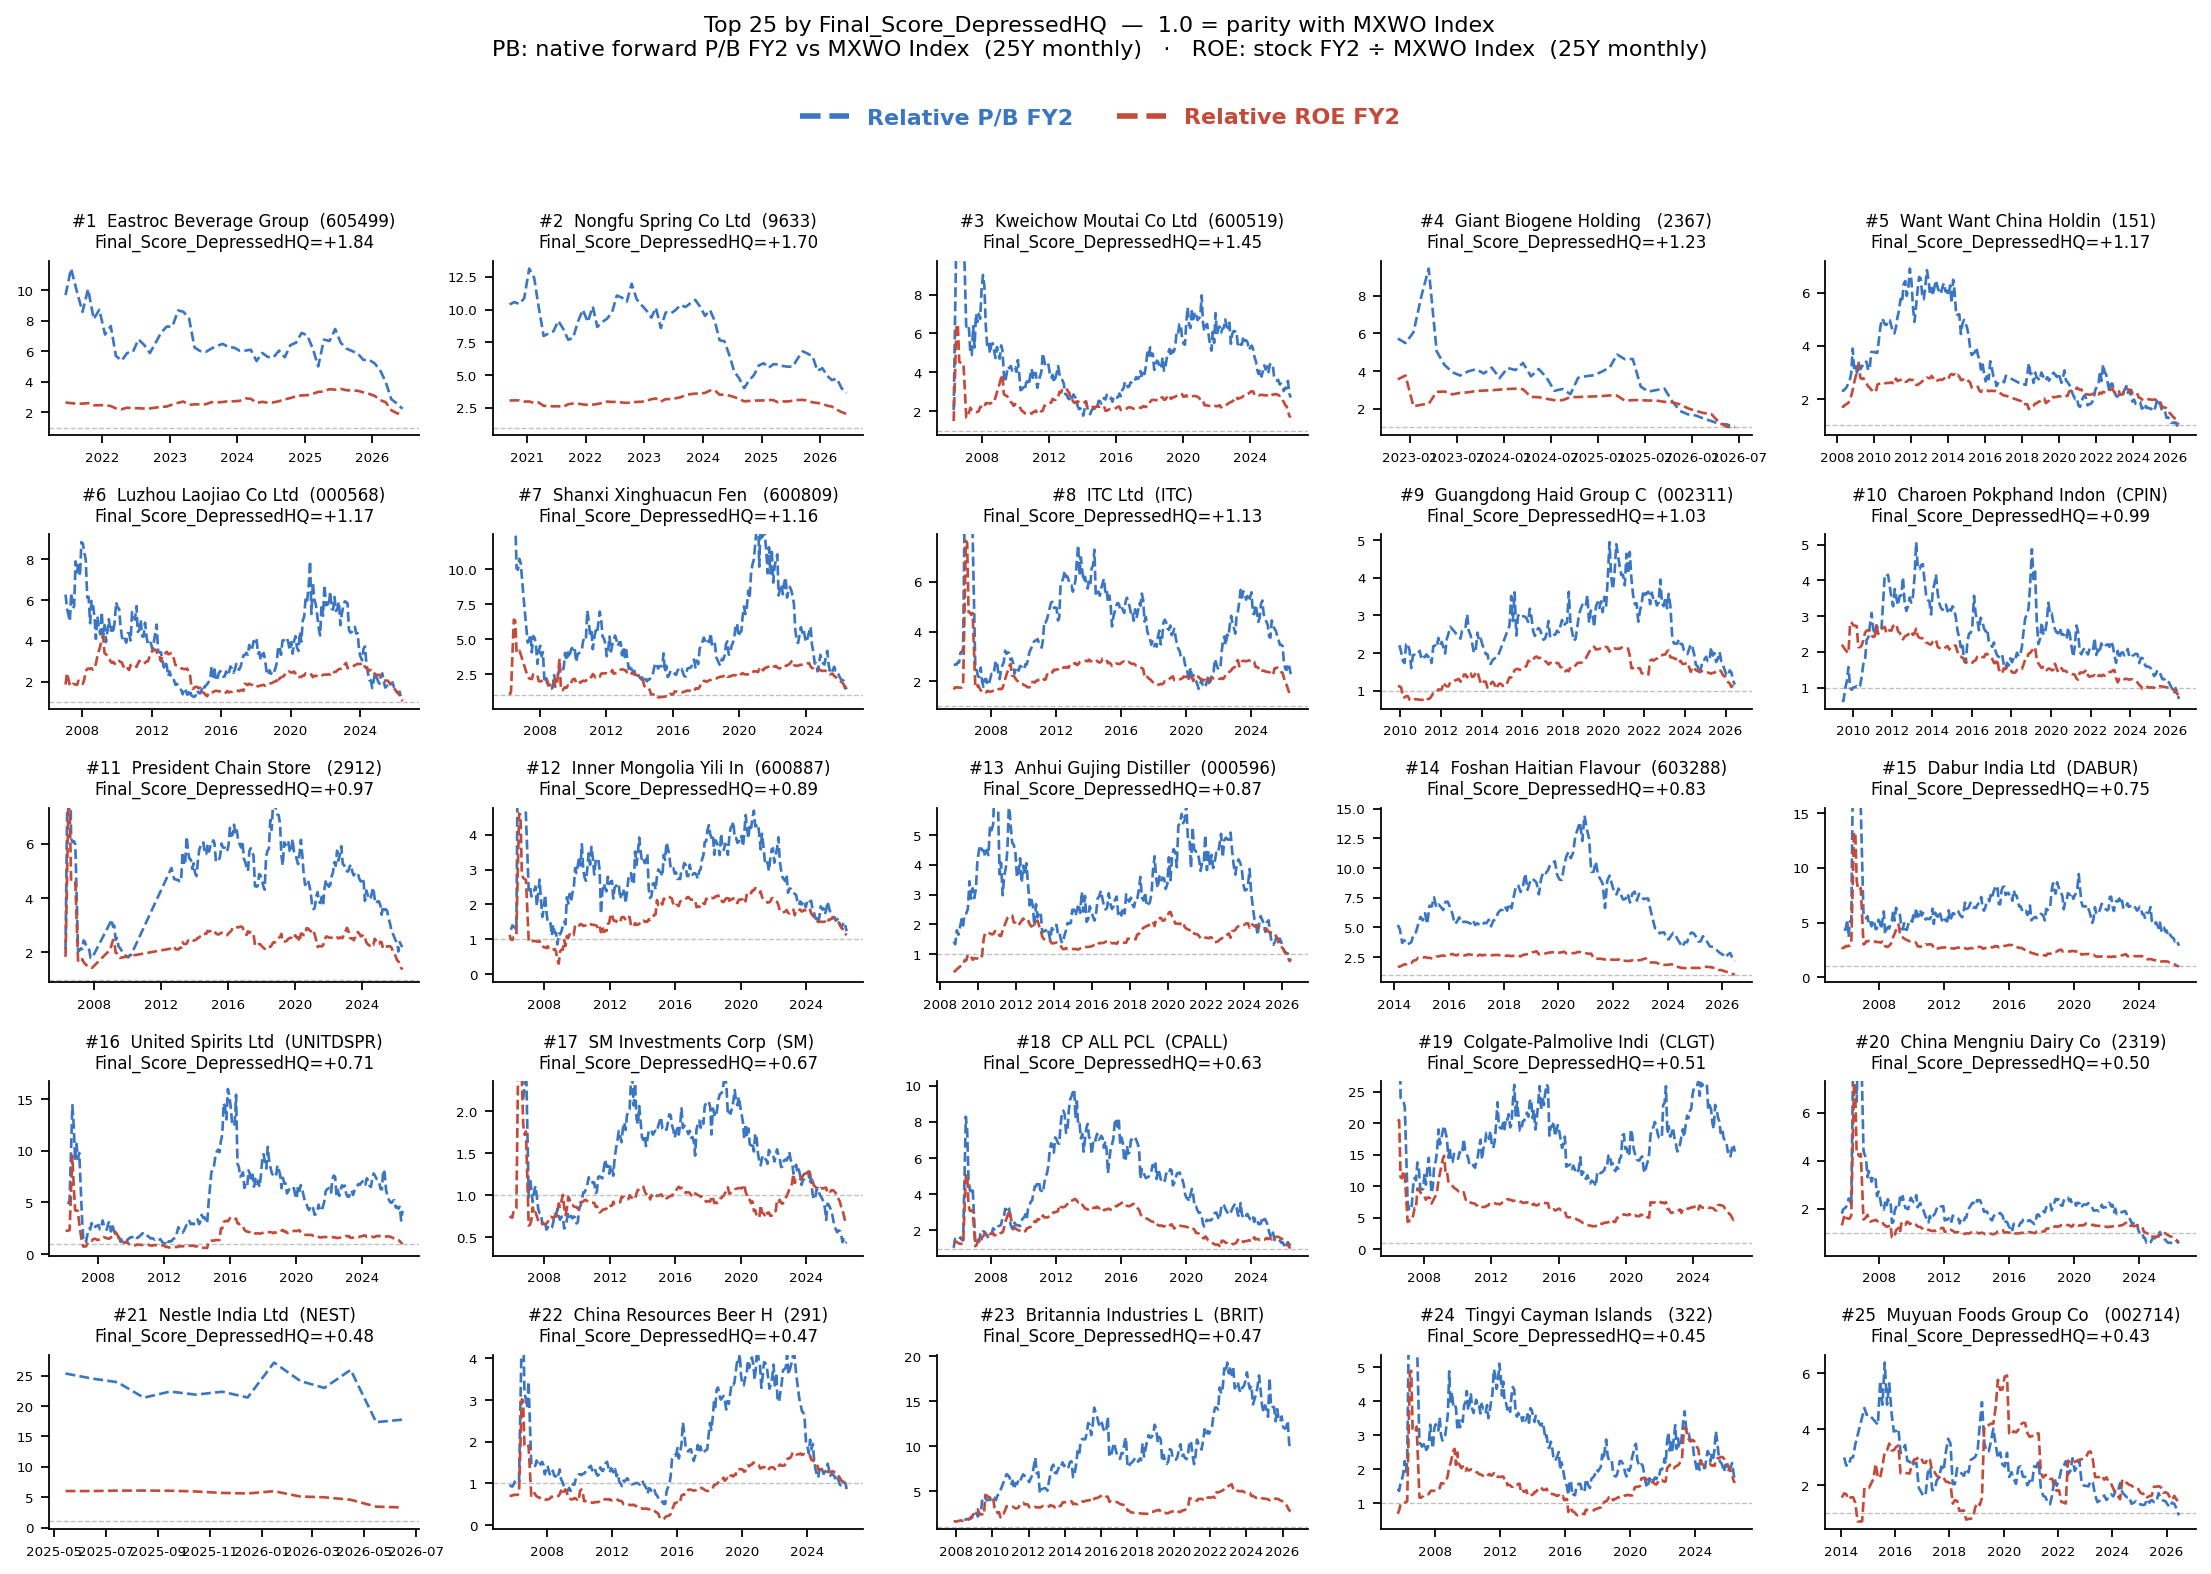
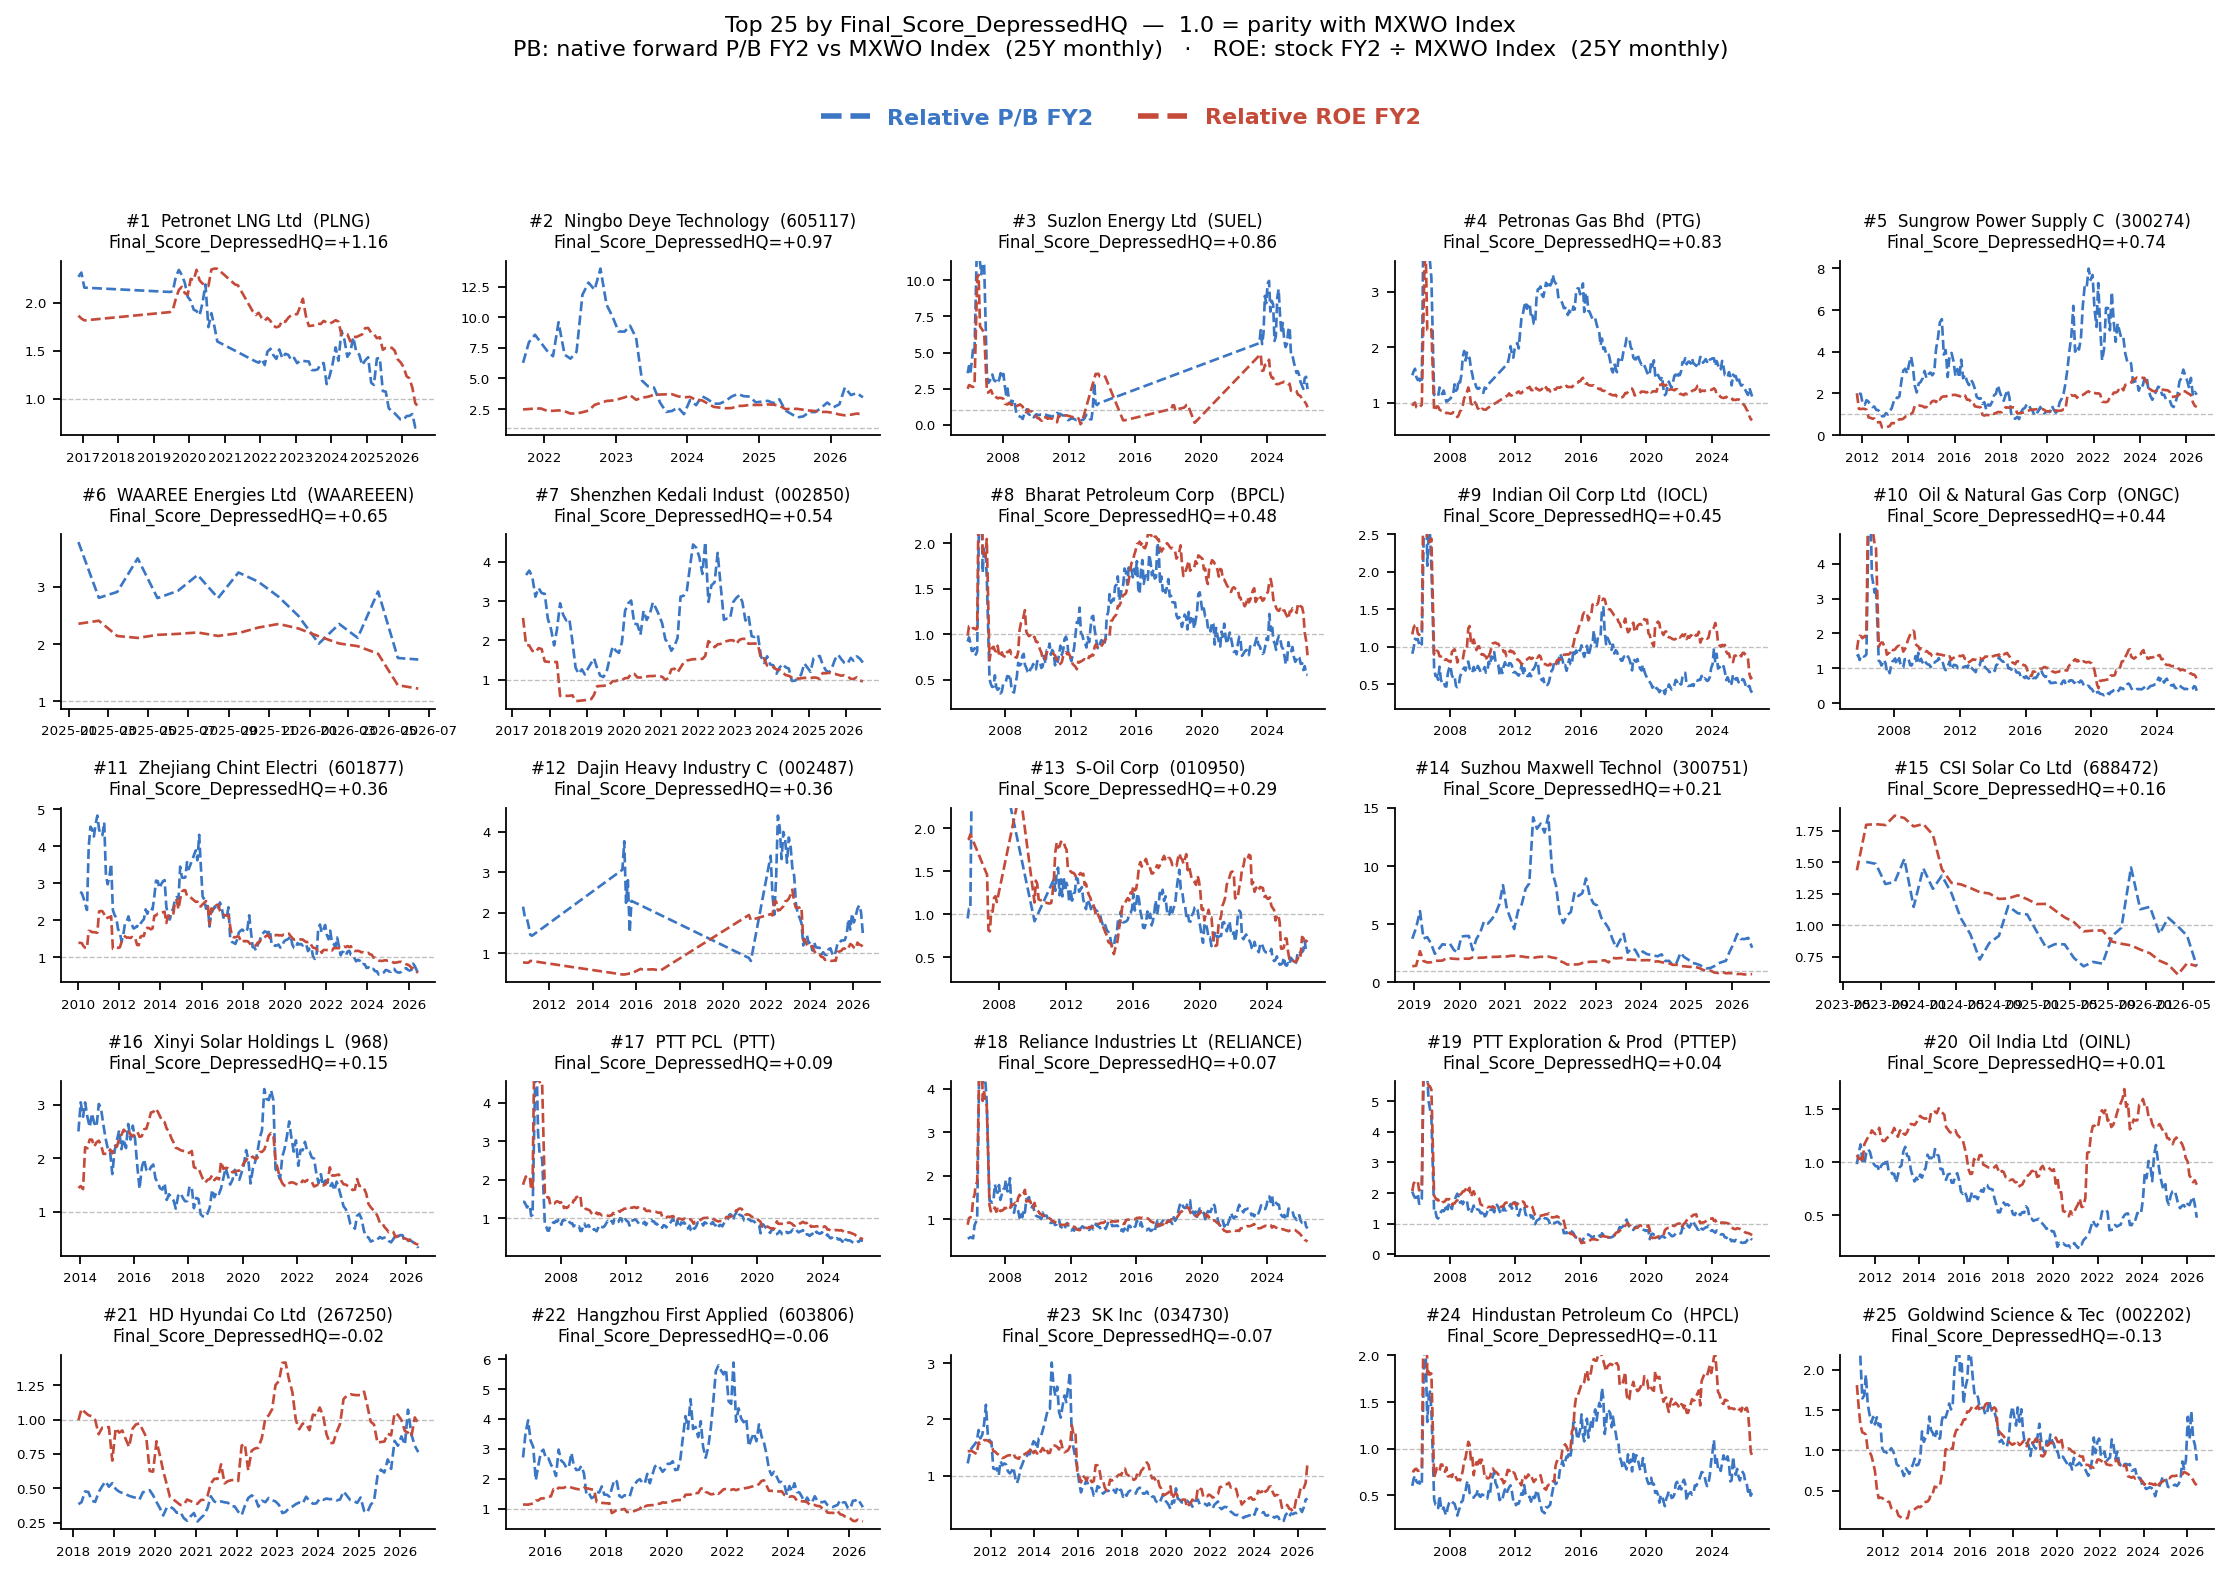
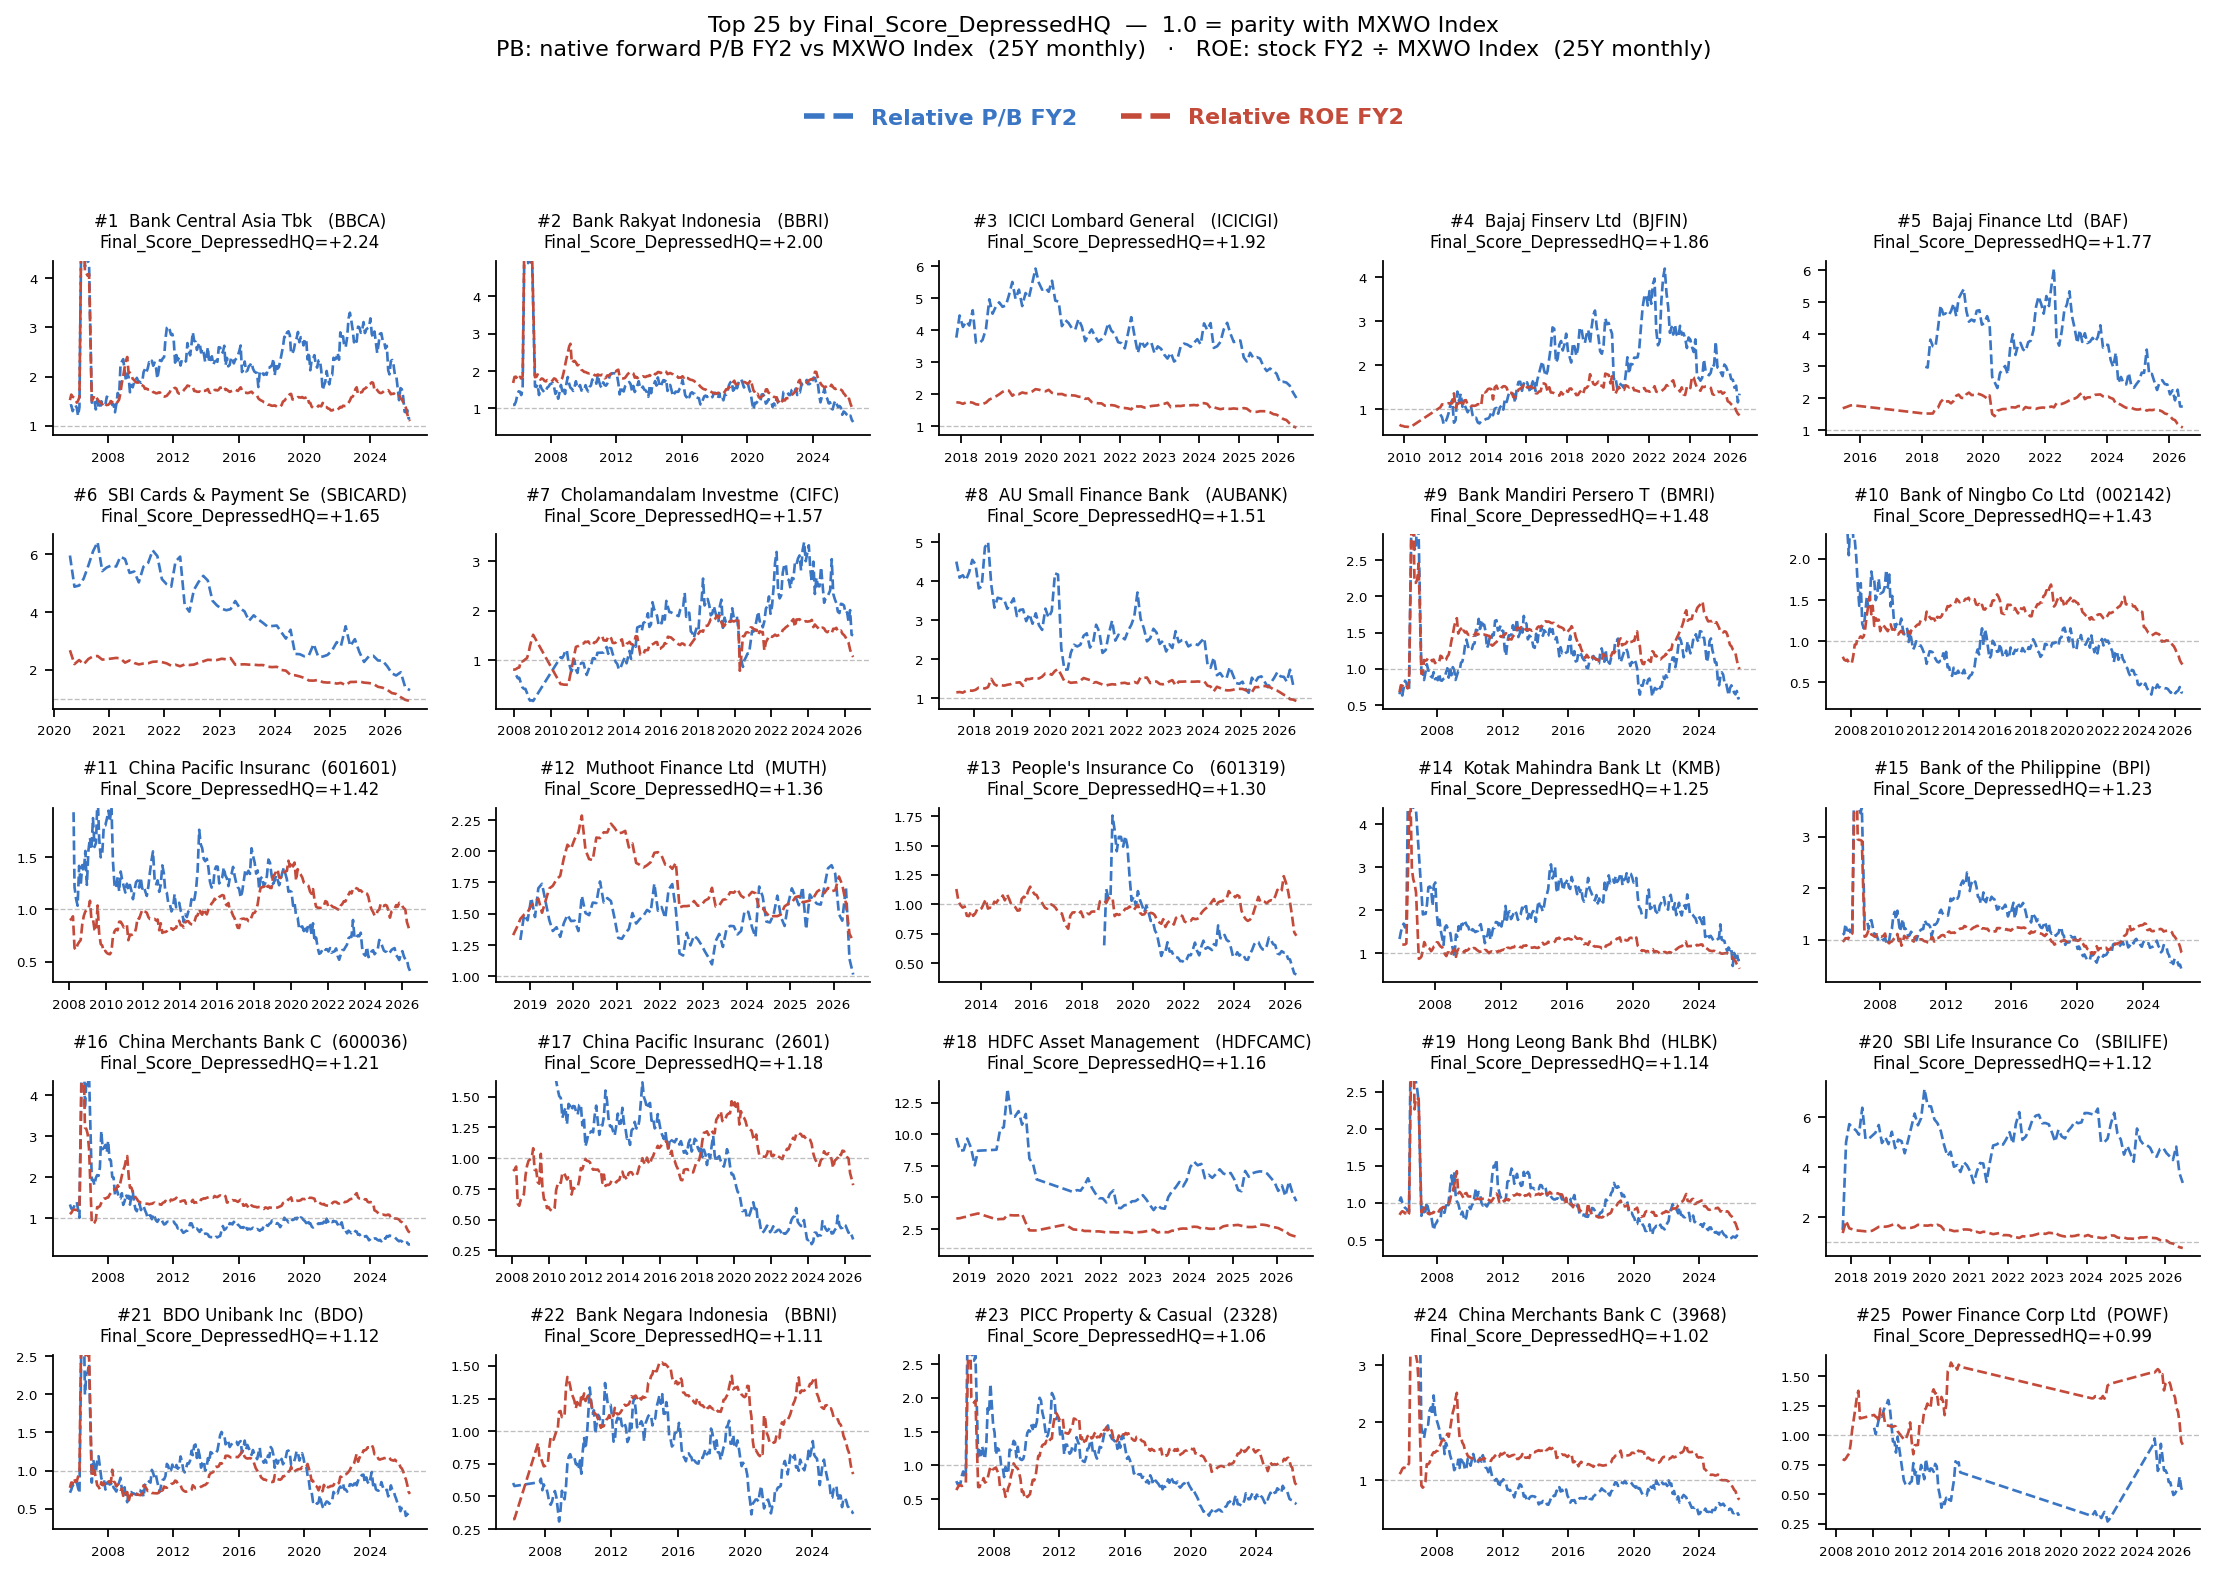
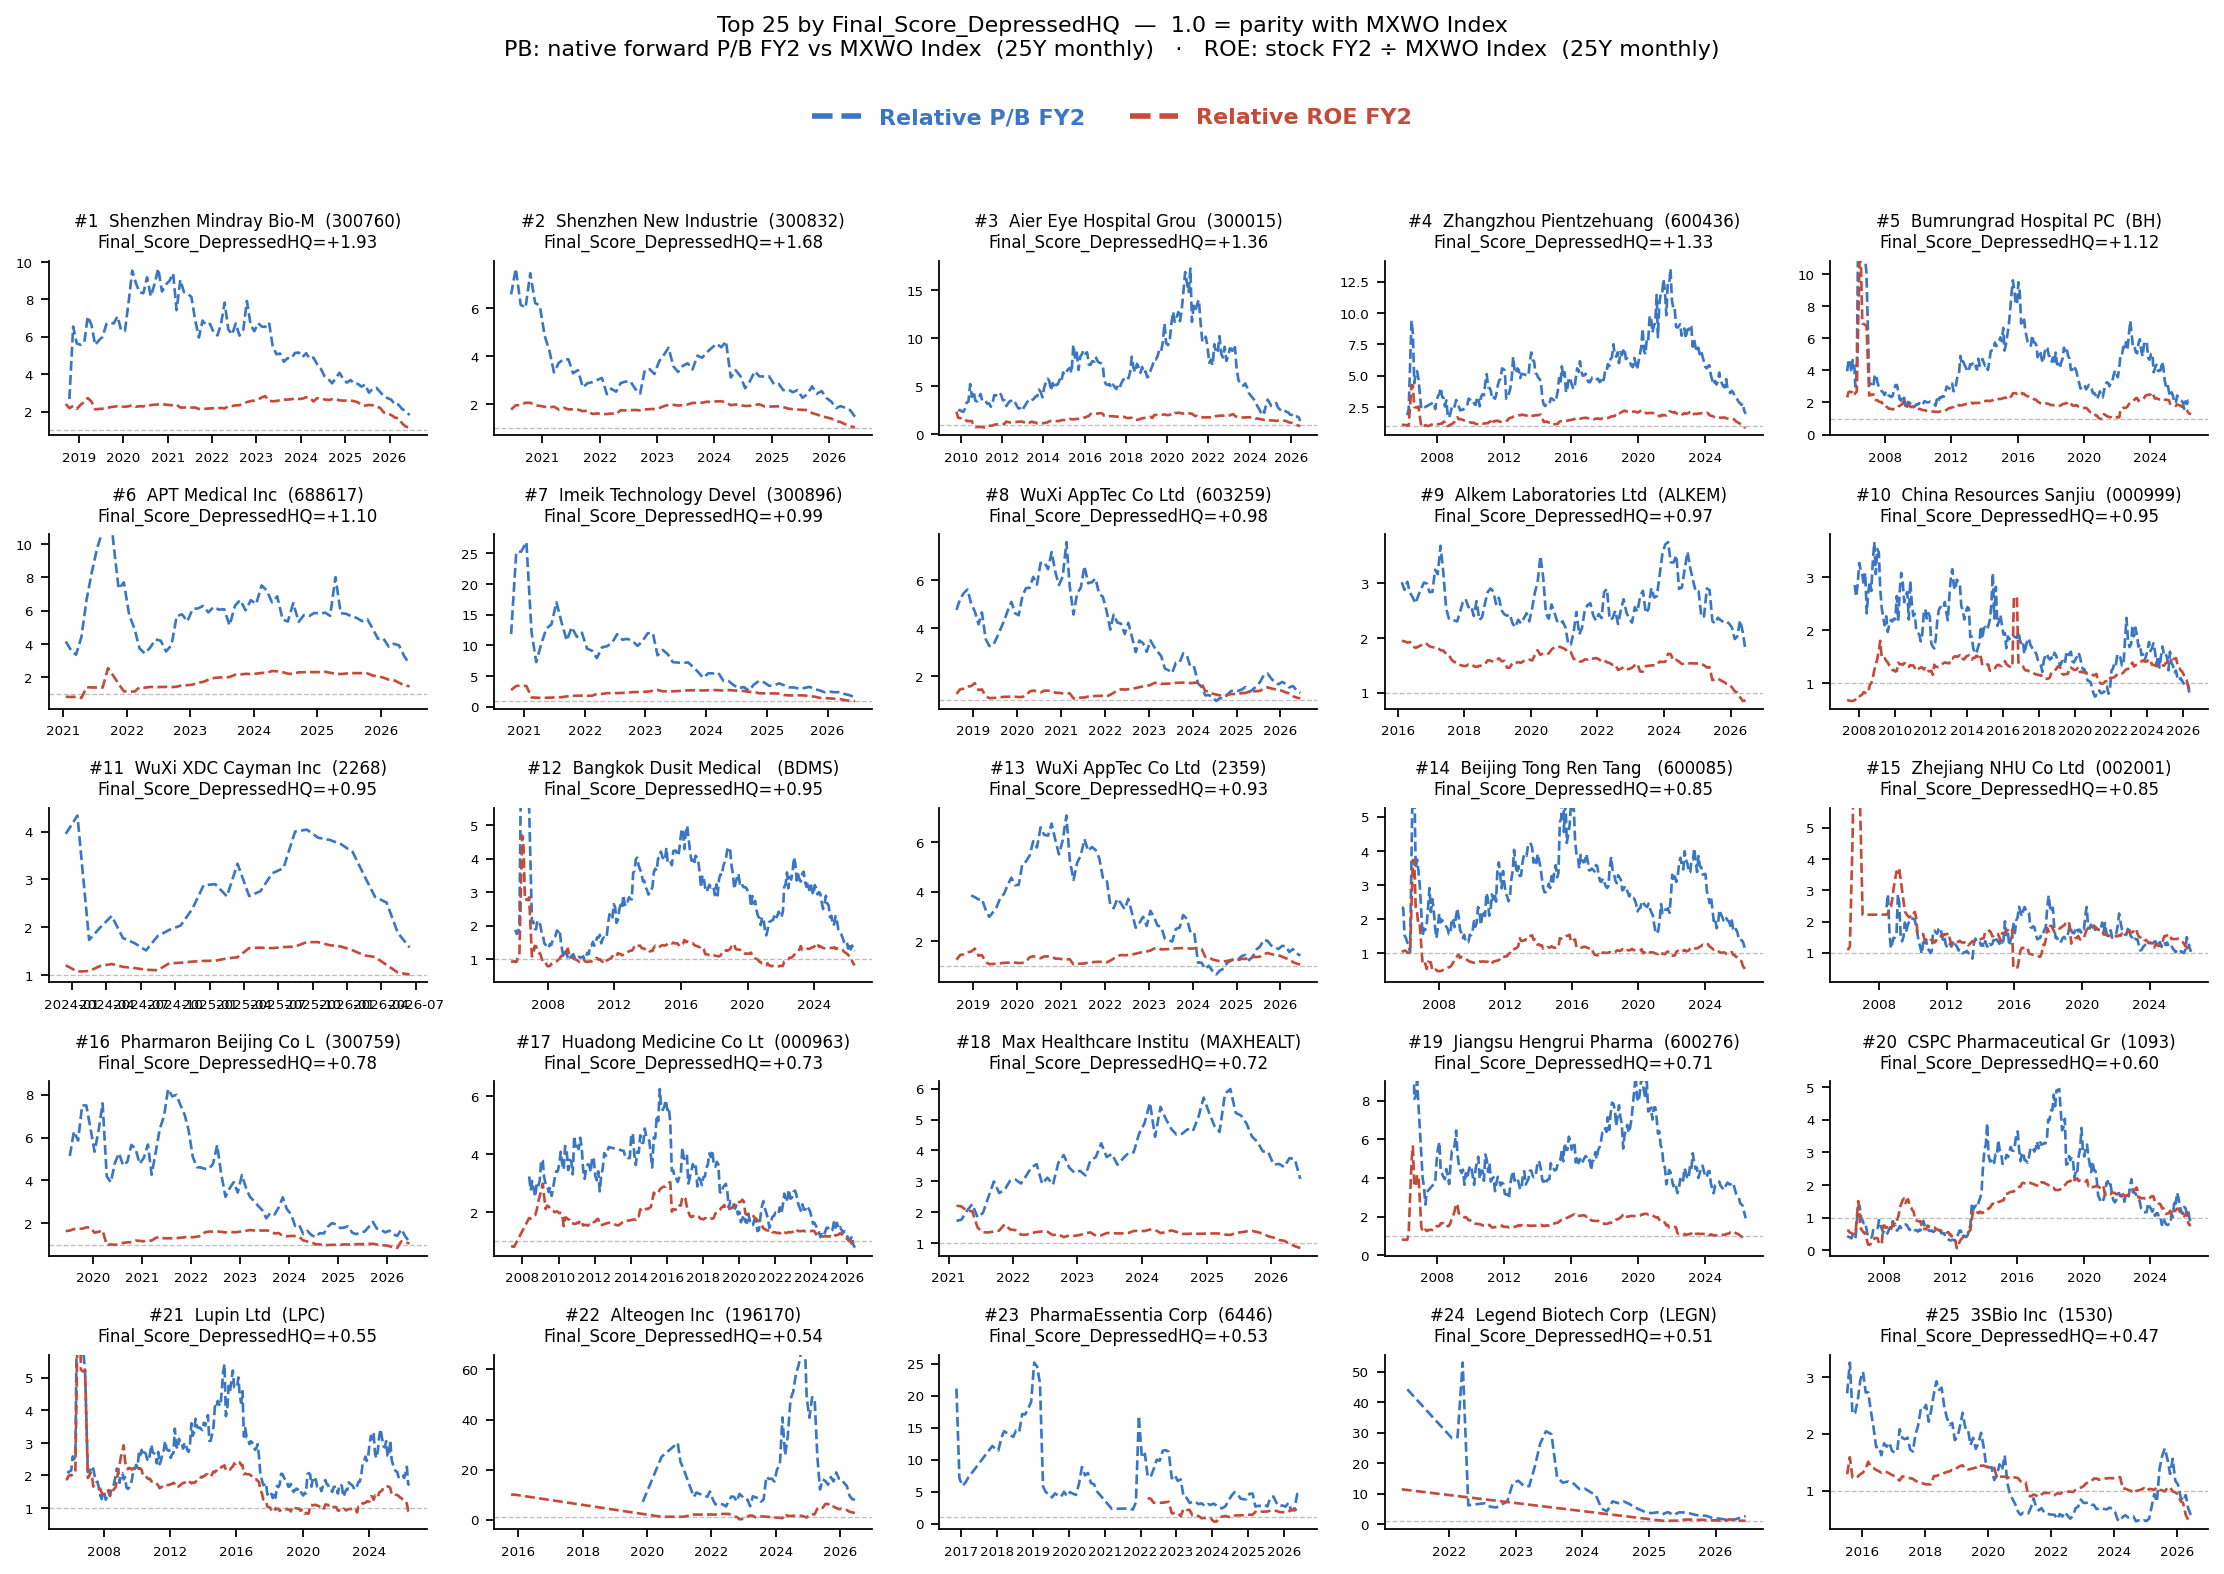
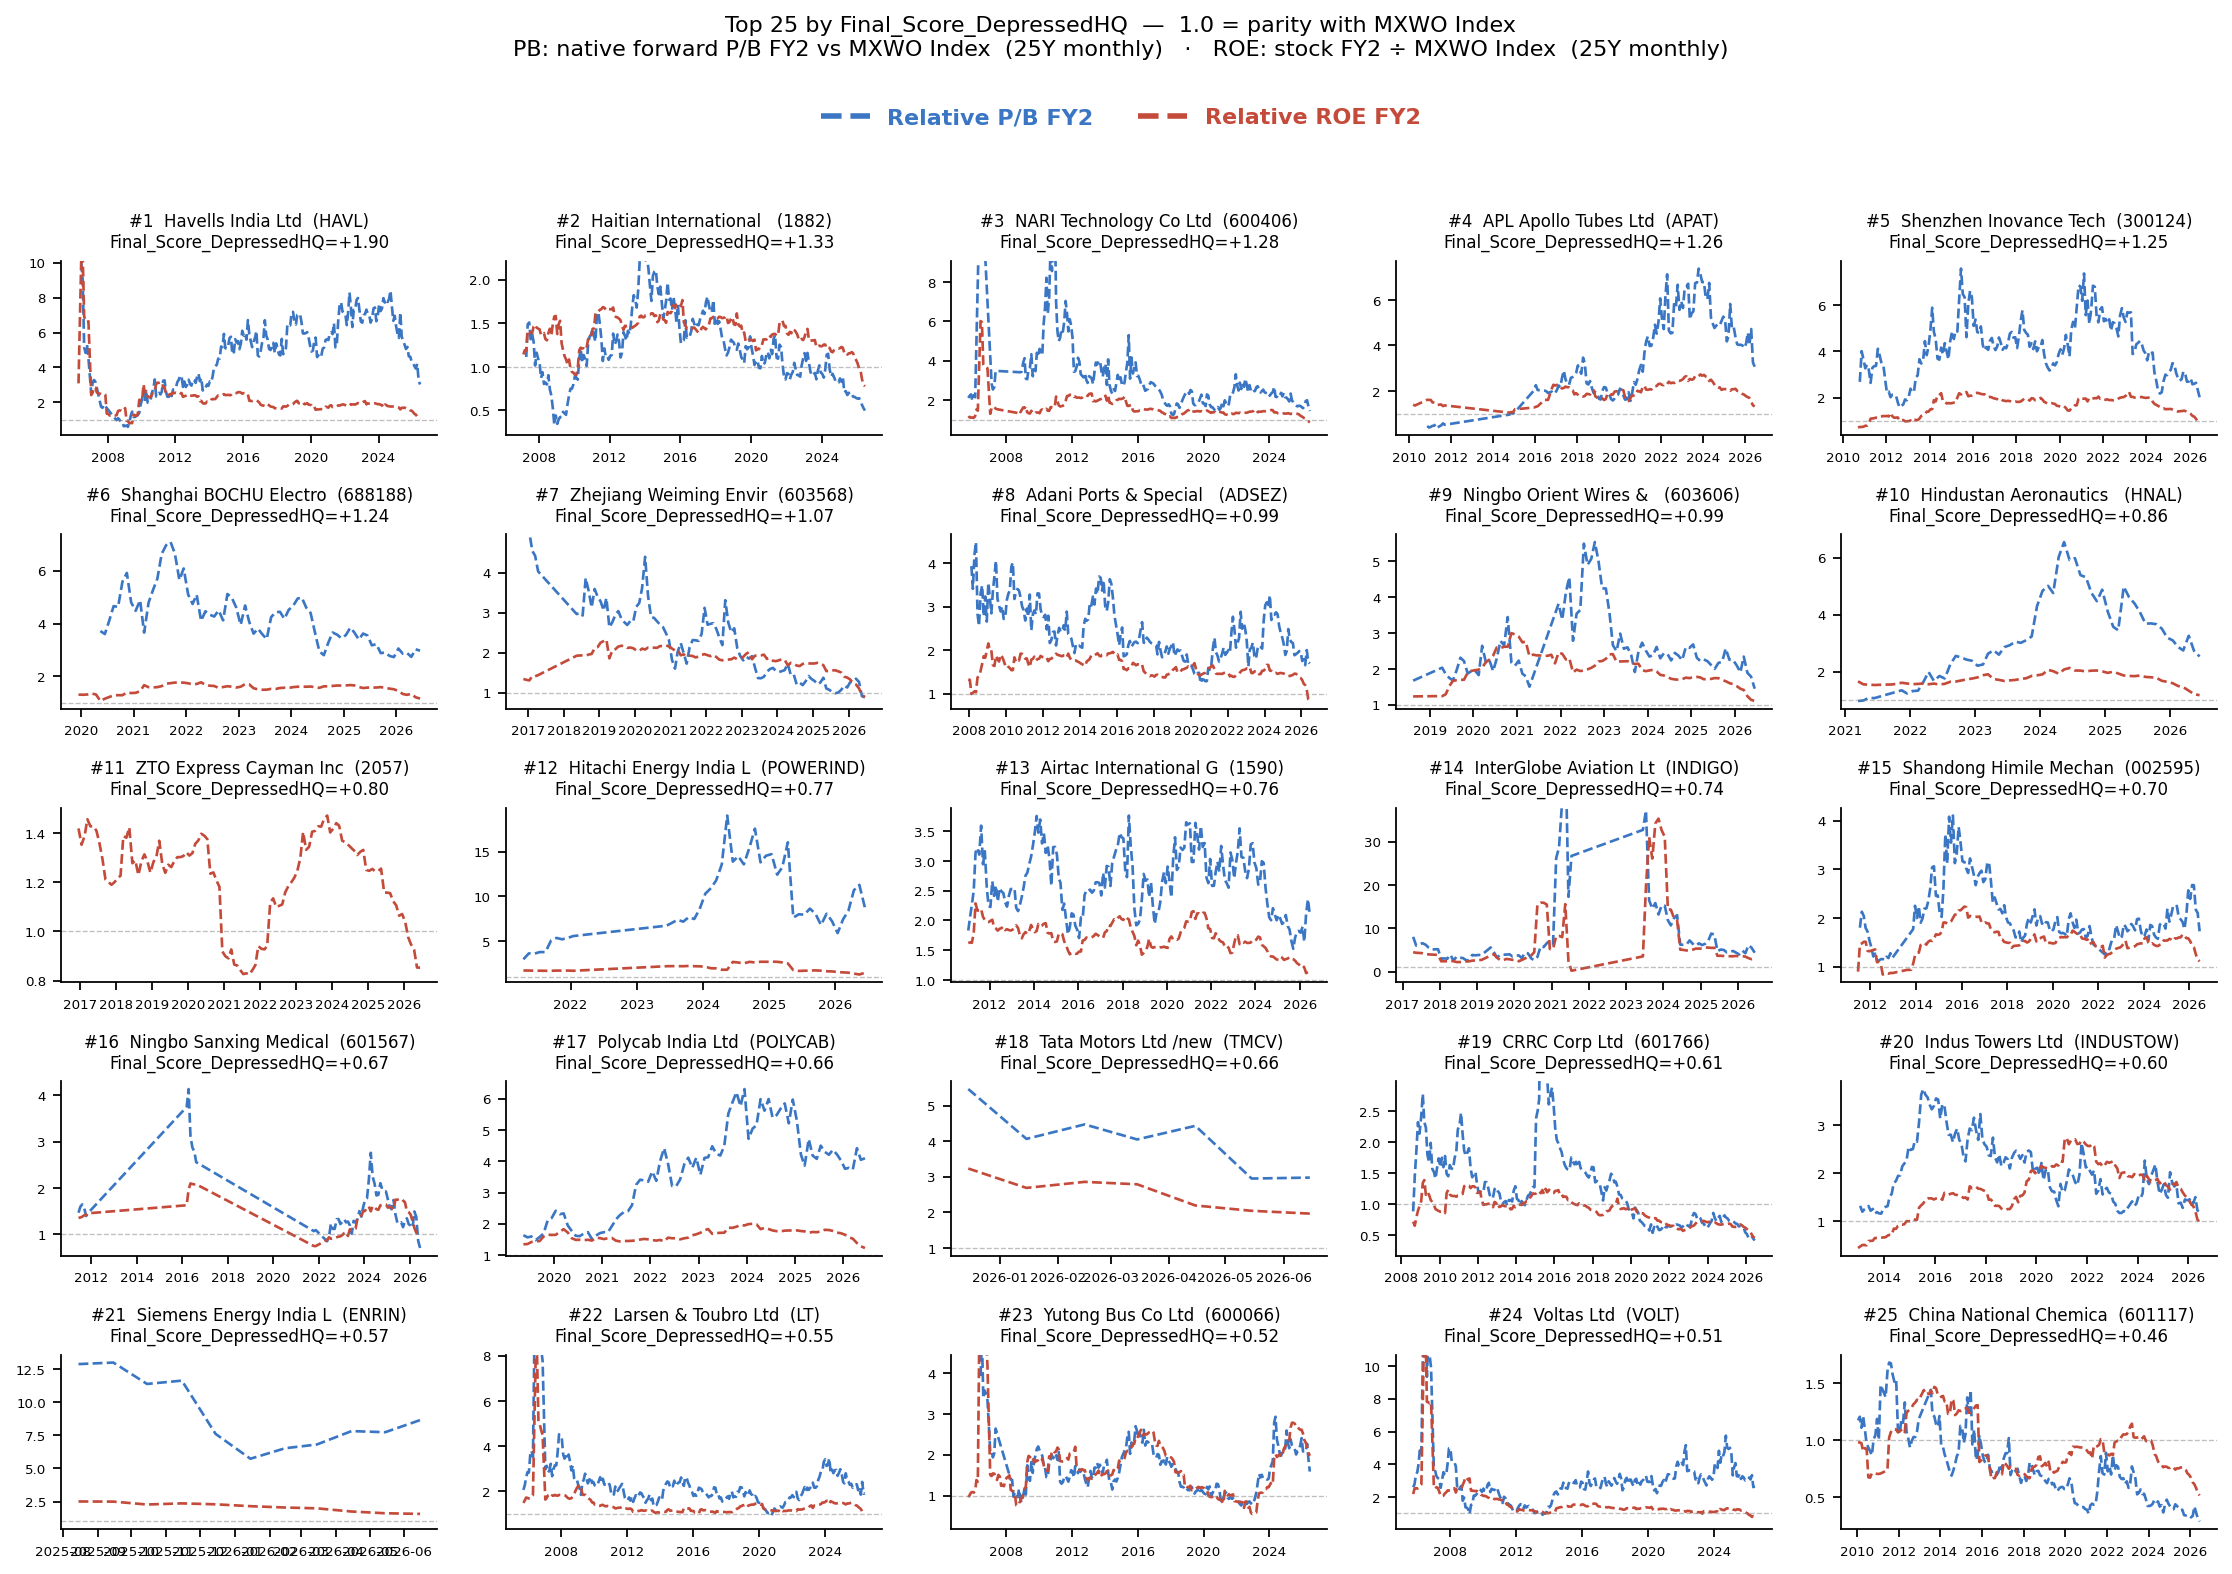
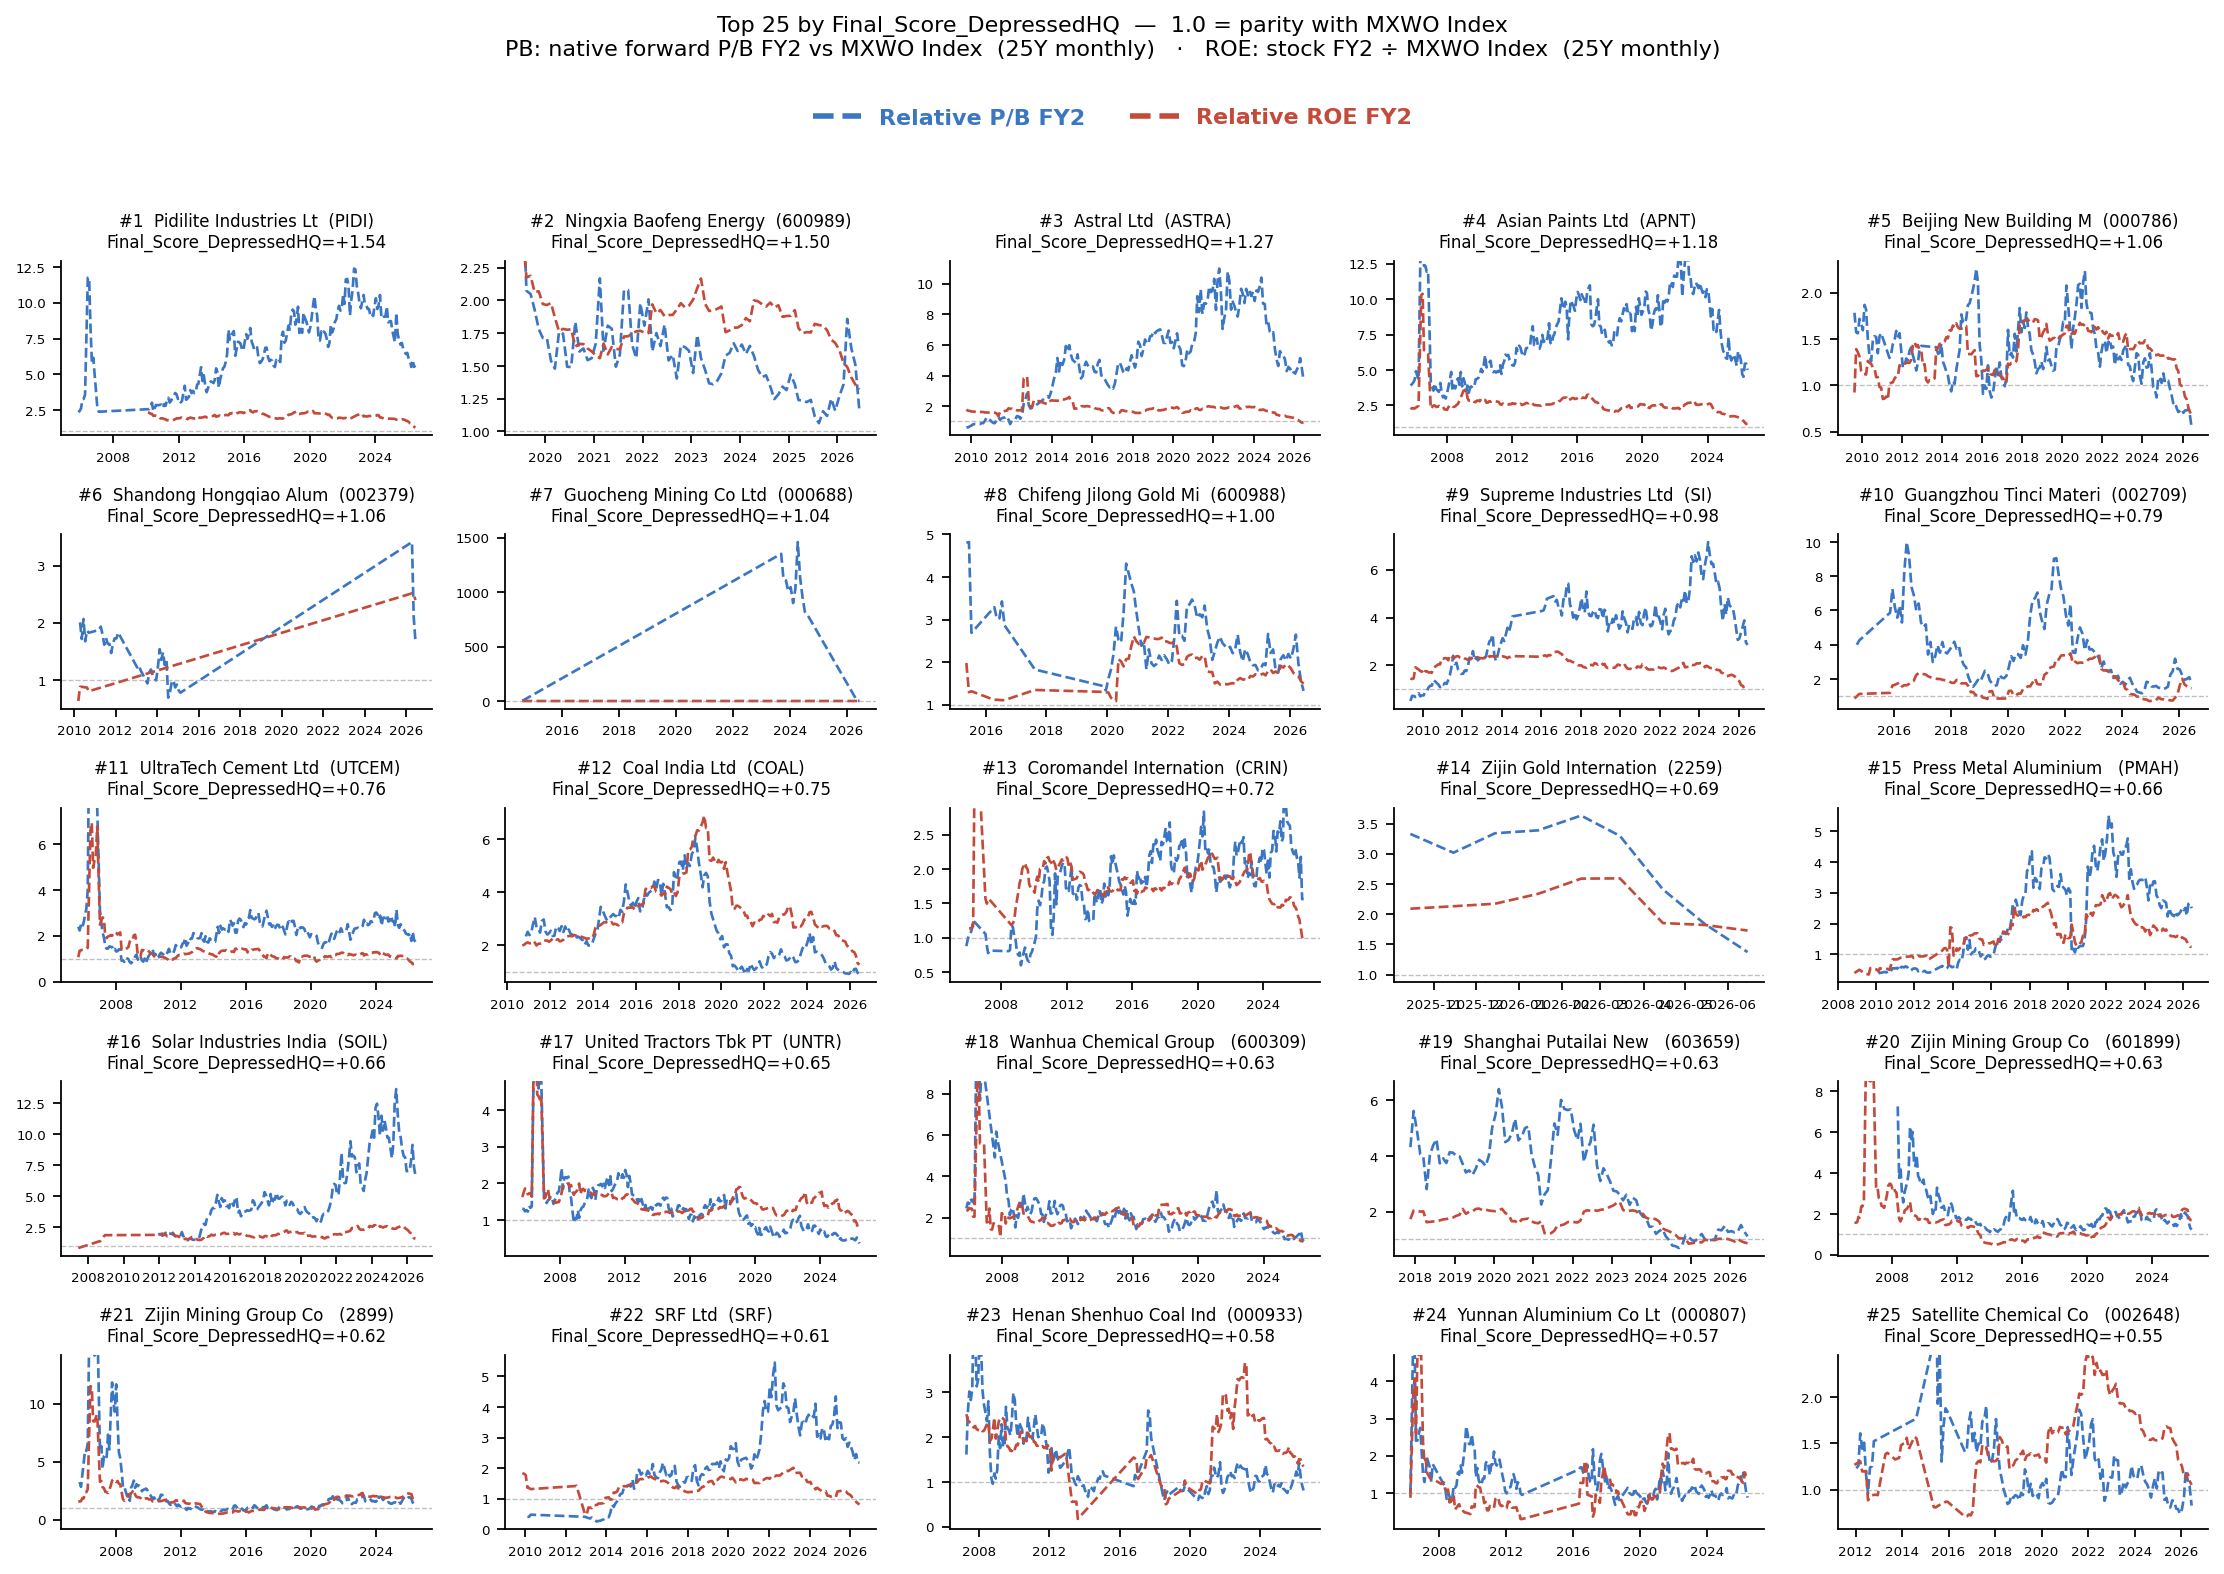
Top 100 Relative PB / Relative ROE FY2 Panels
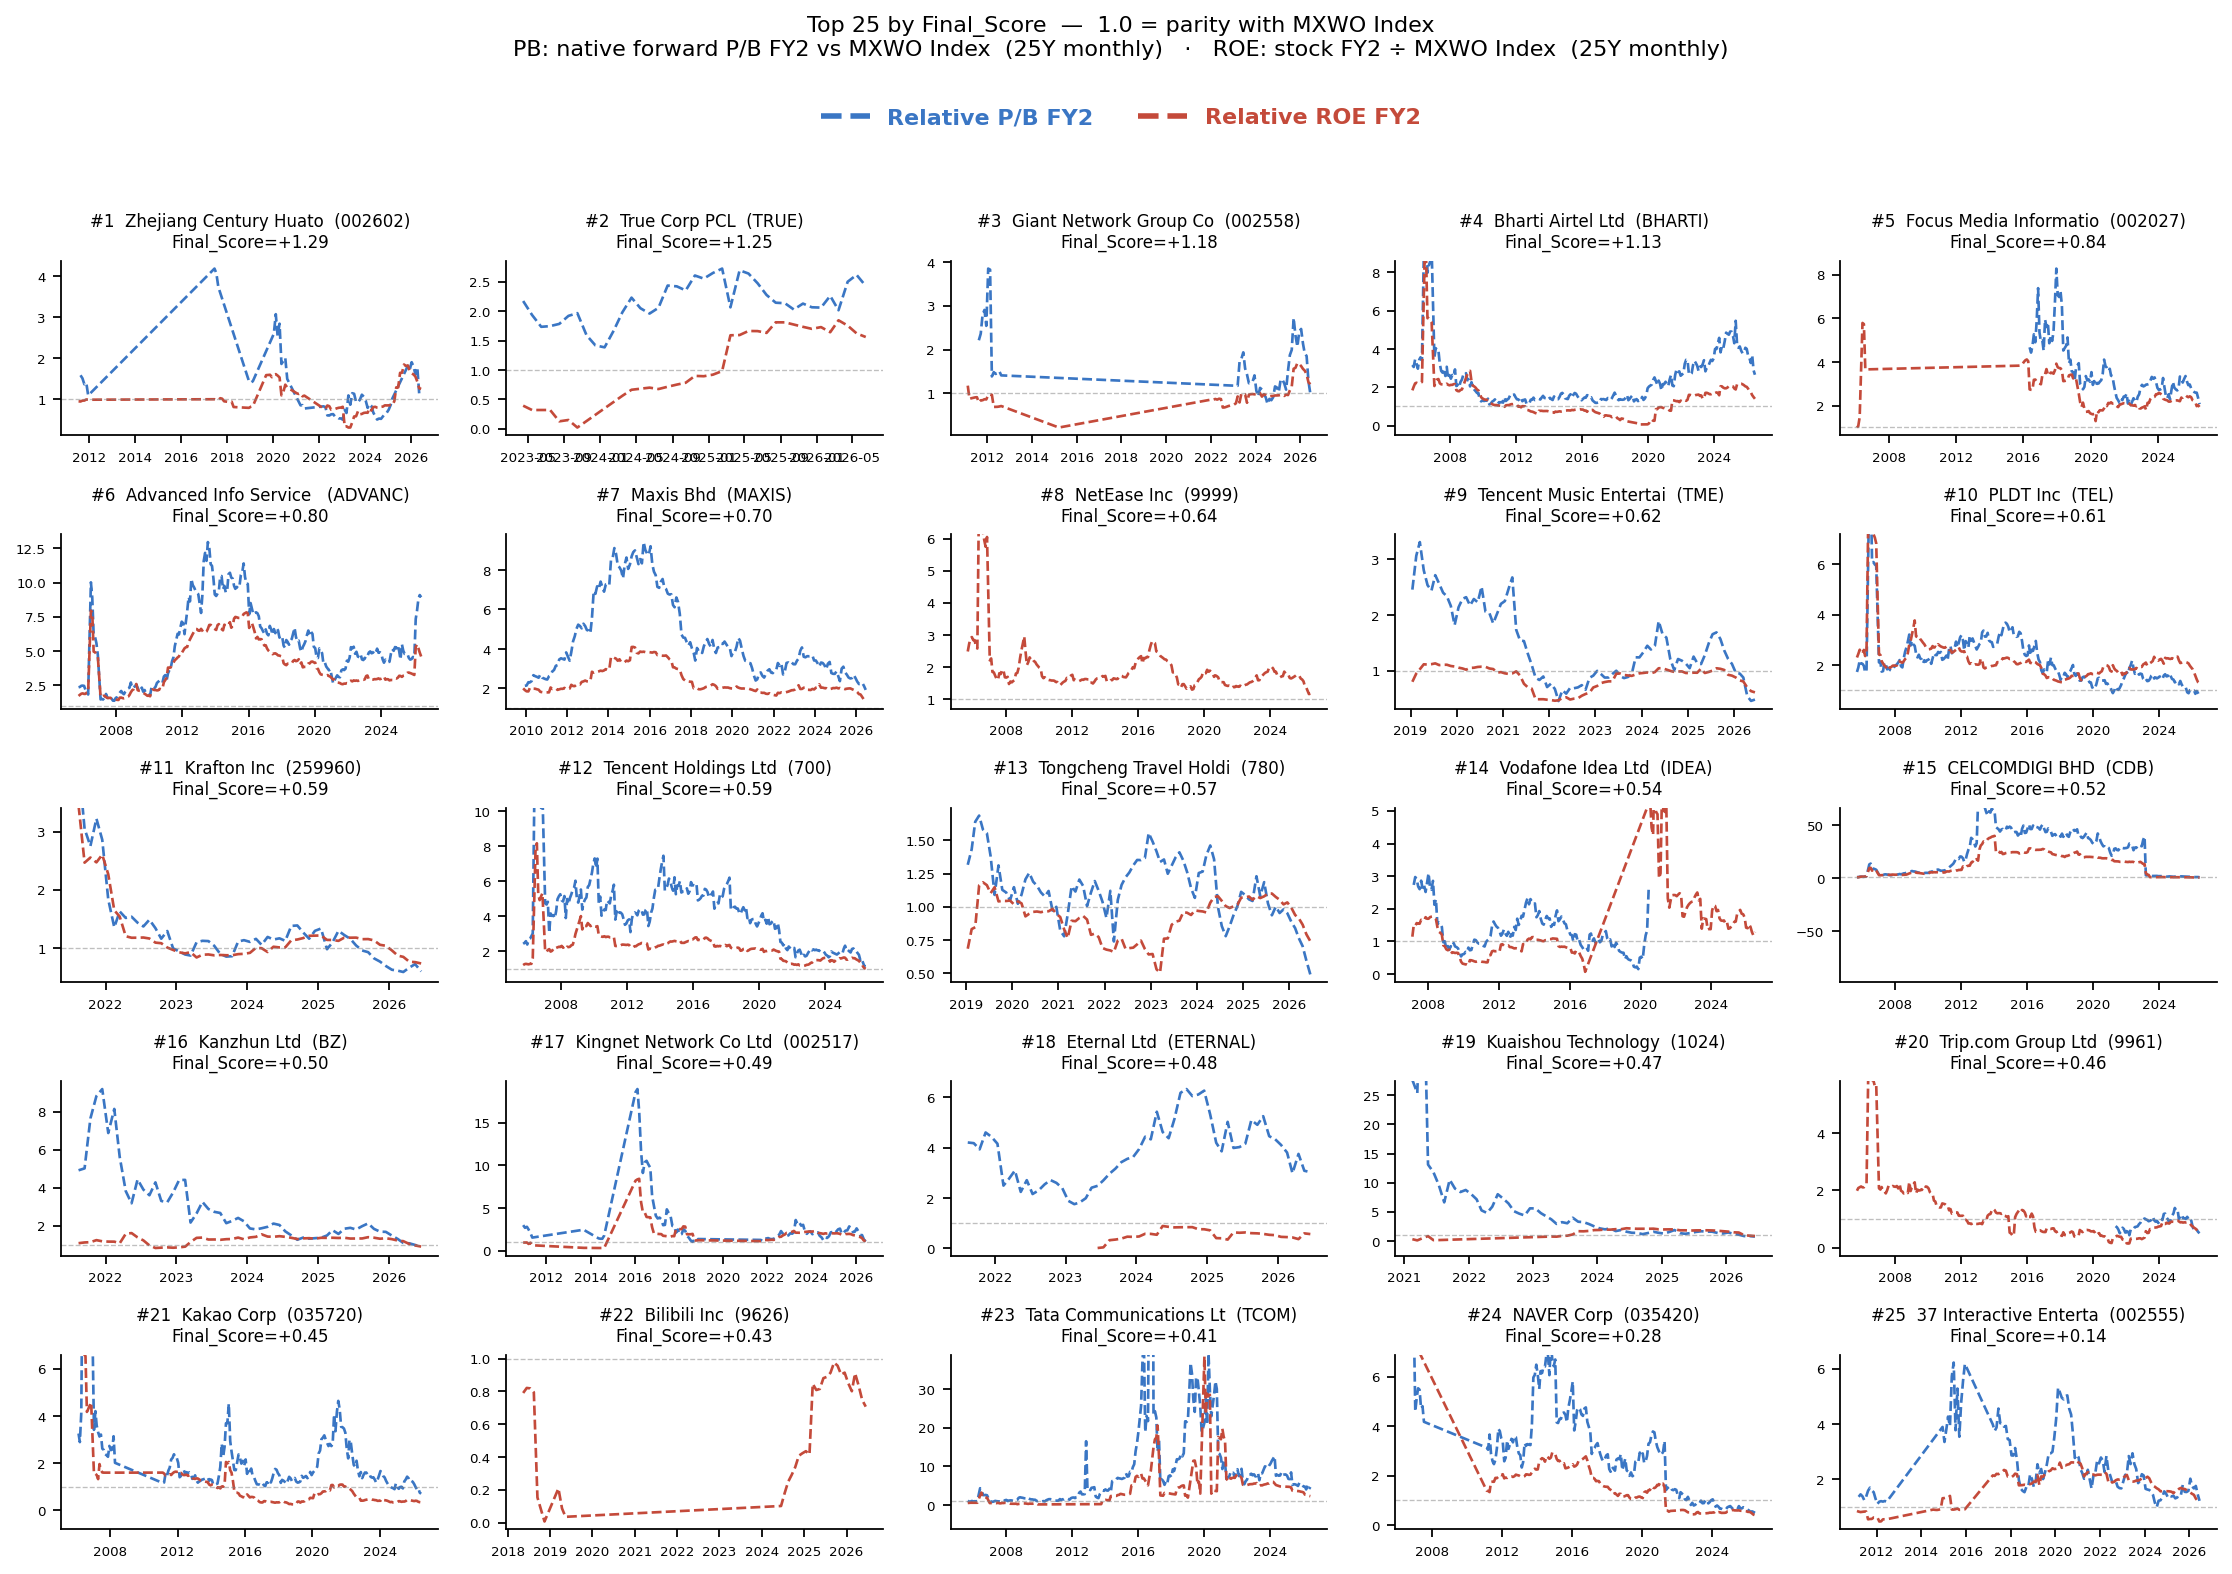
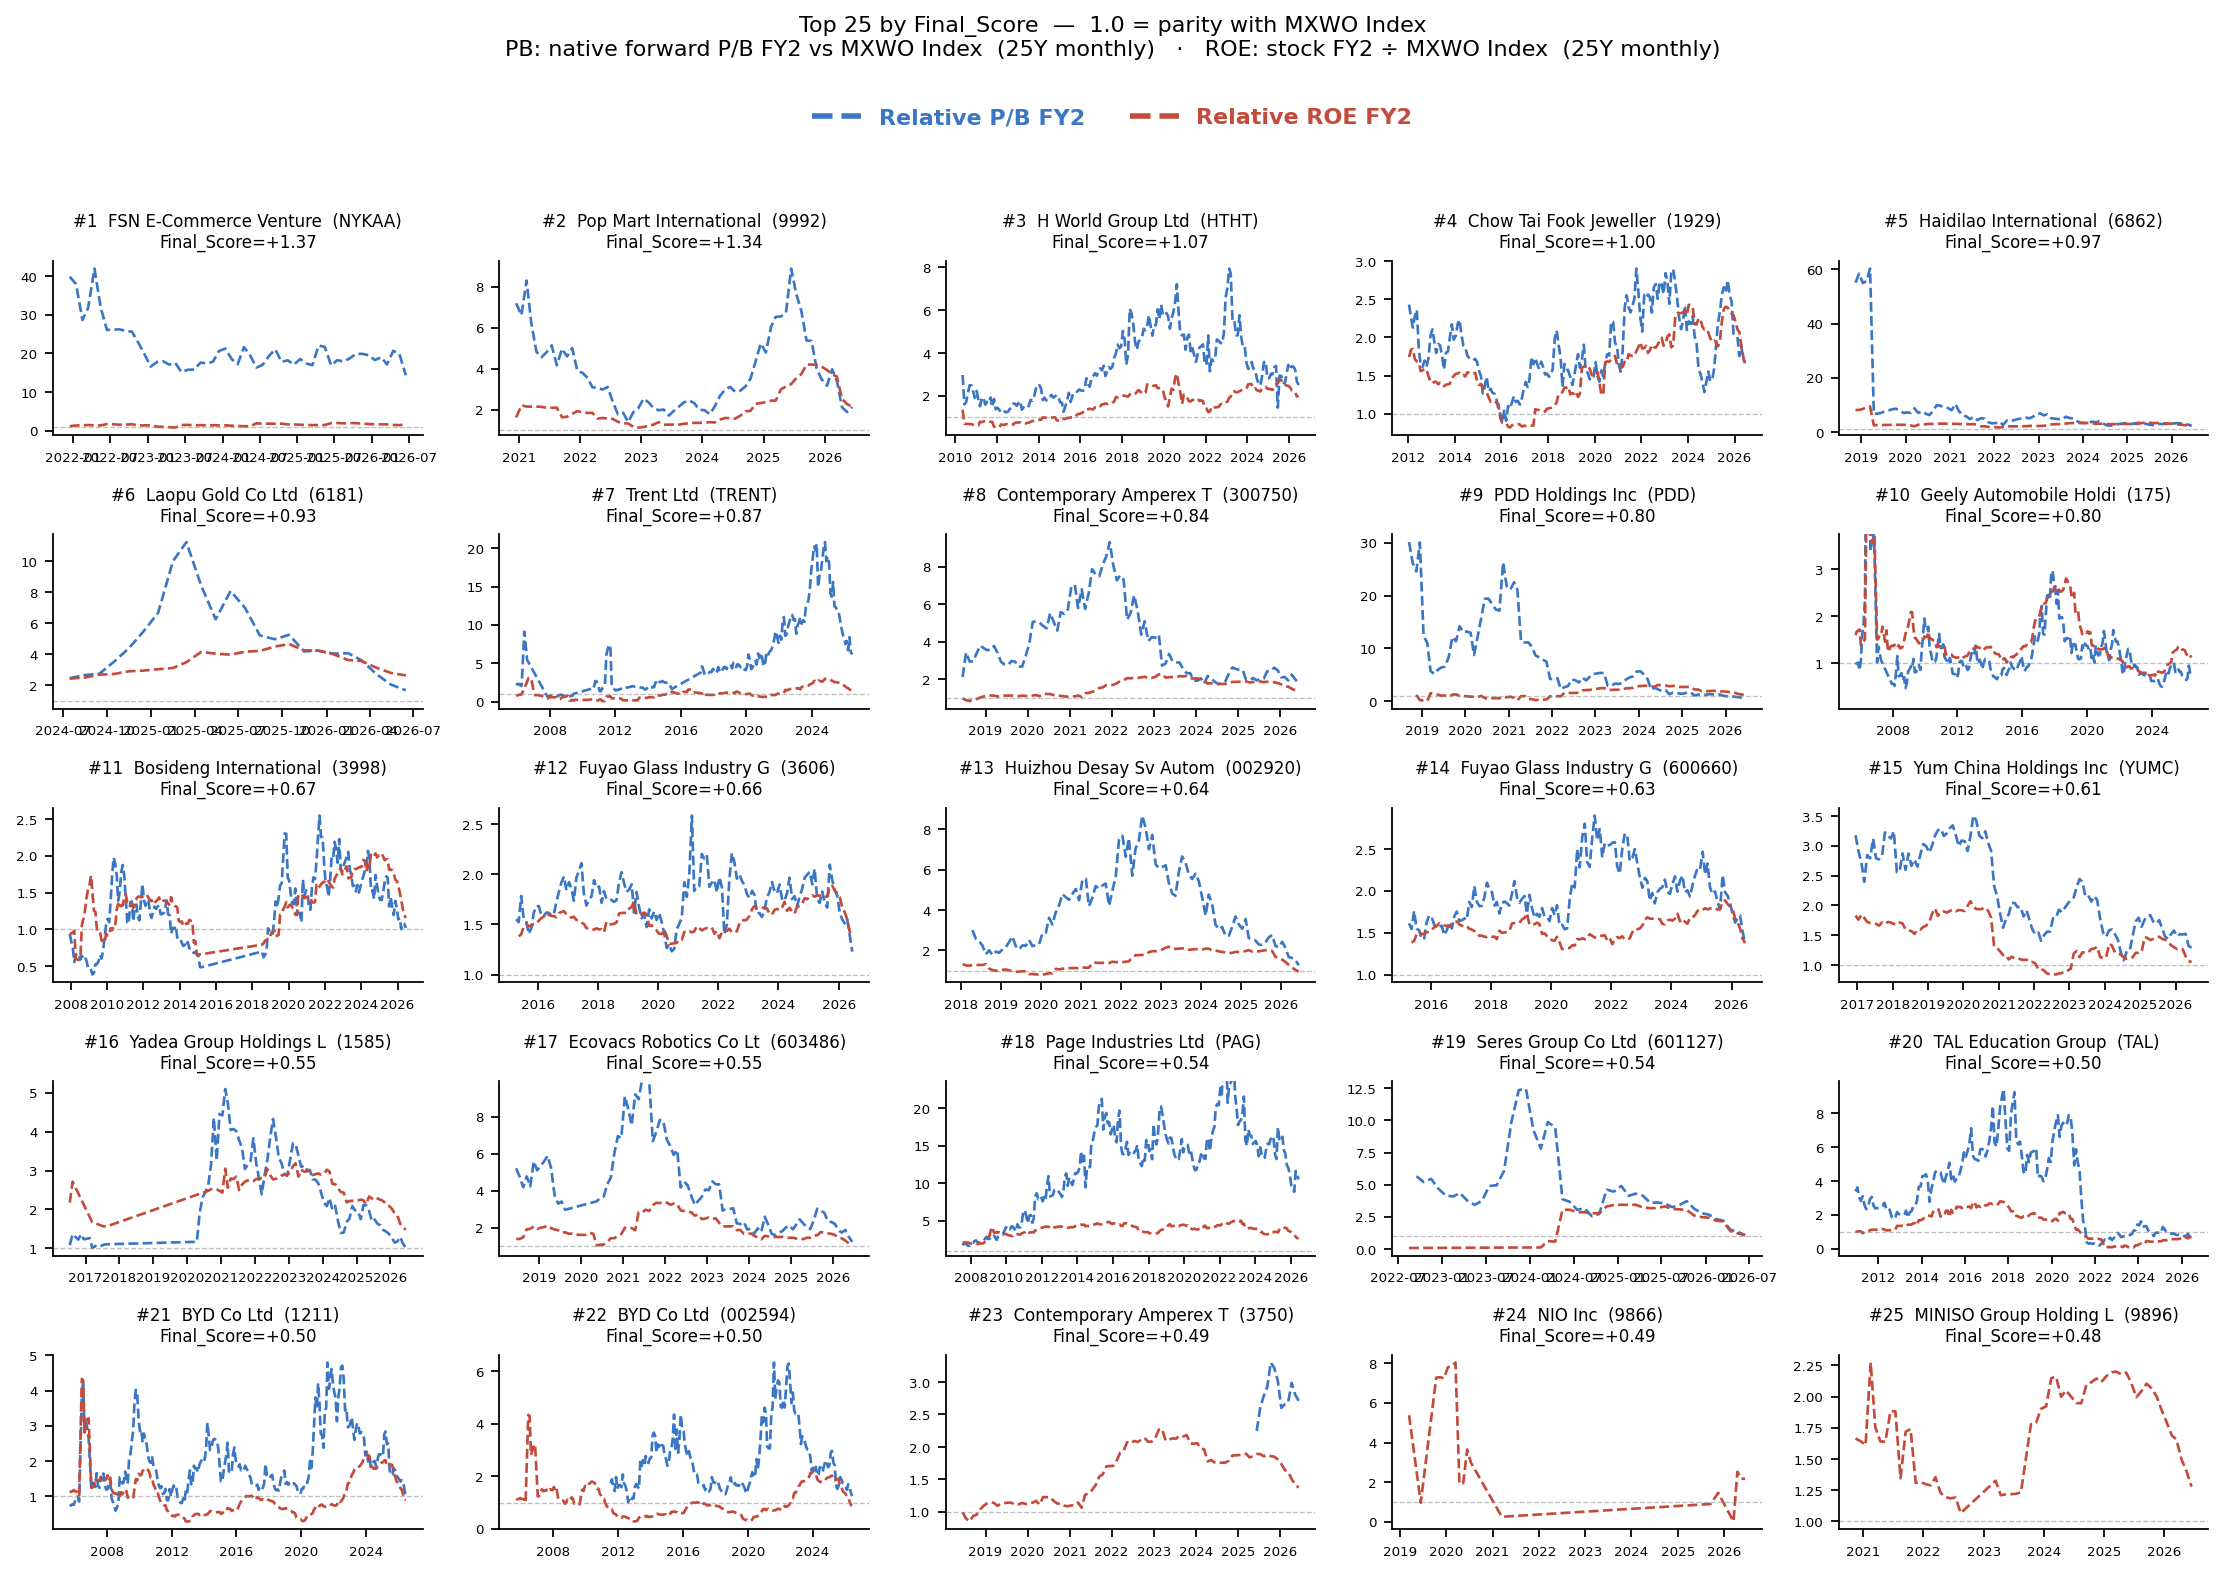
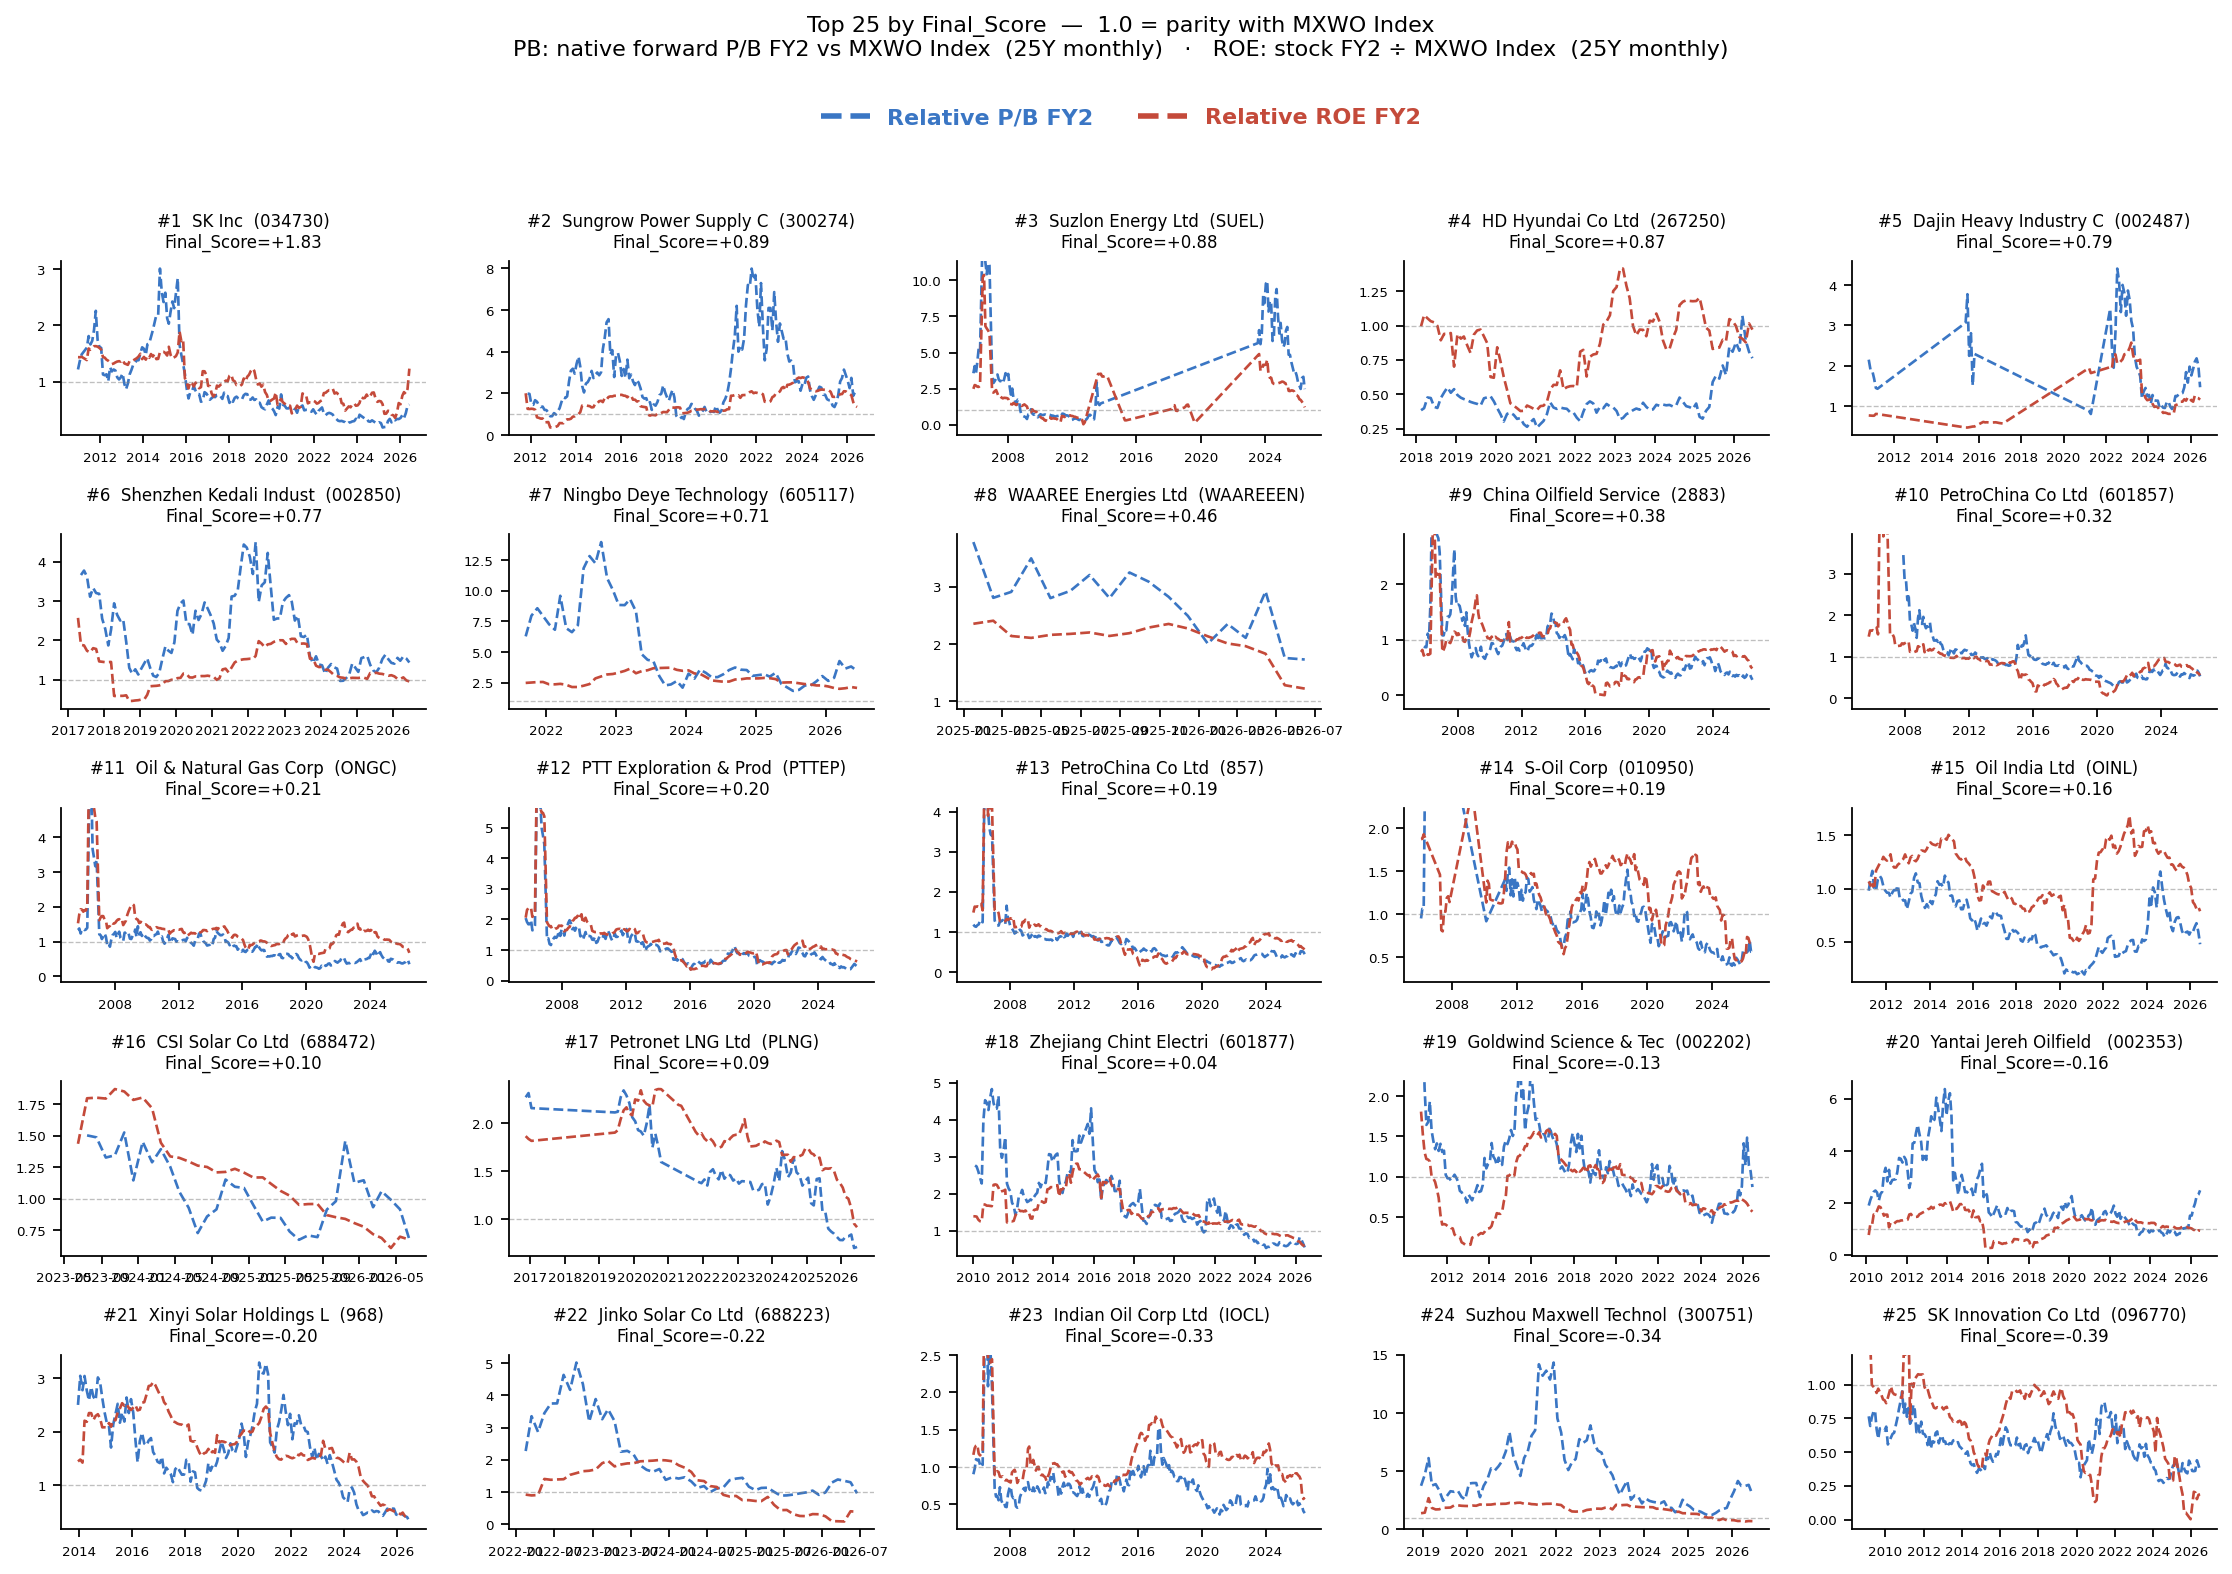
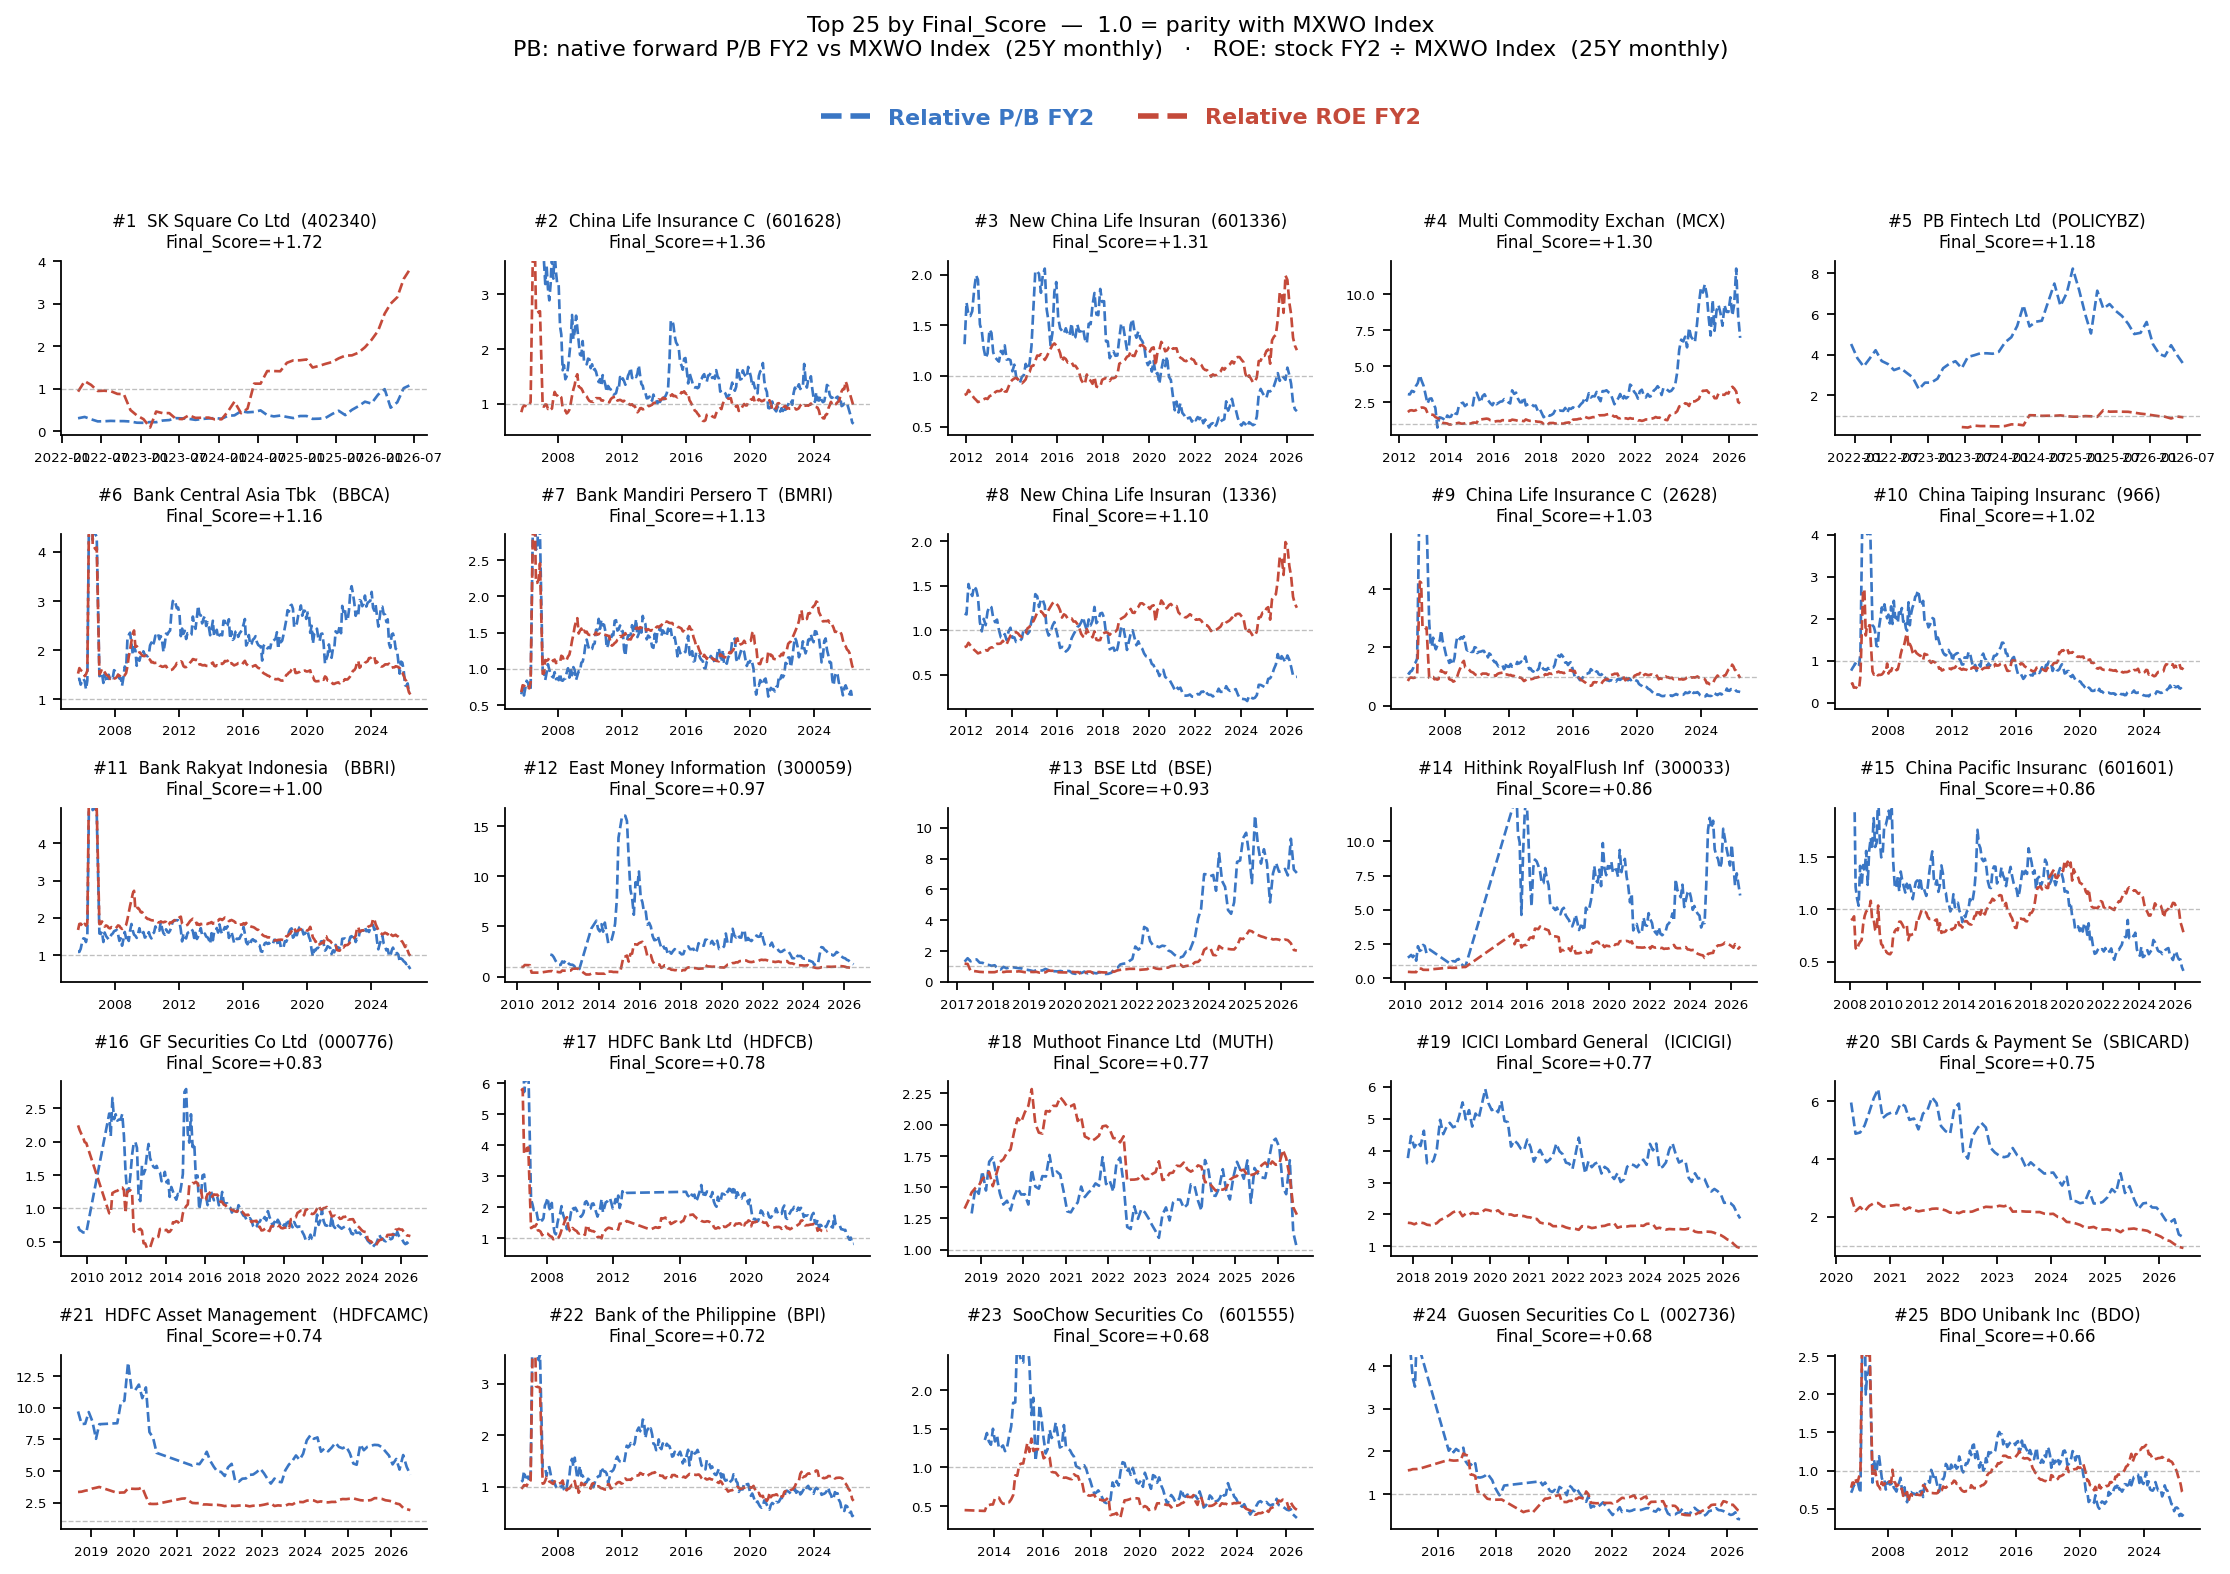
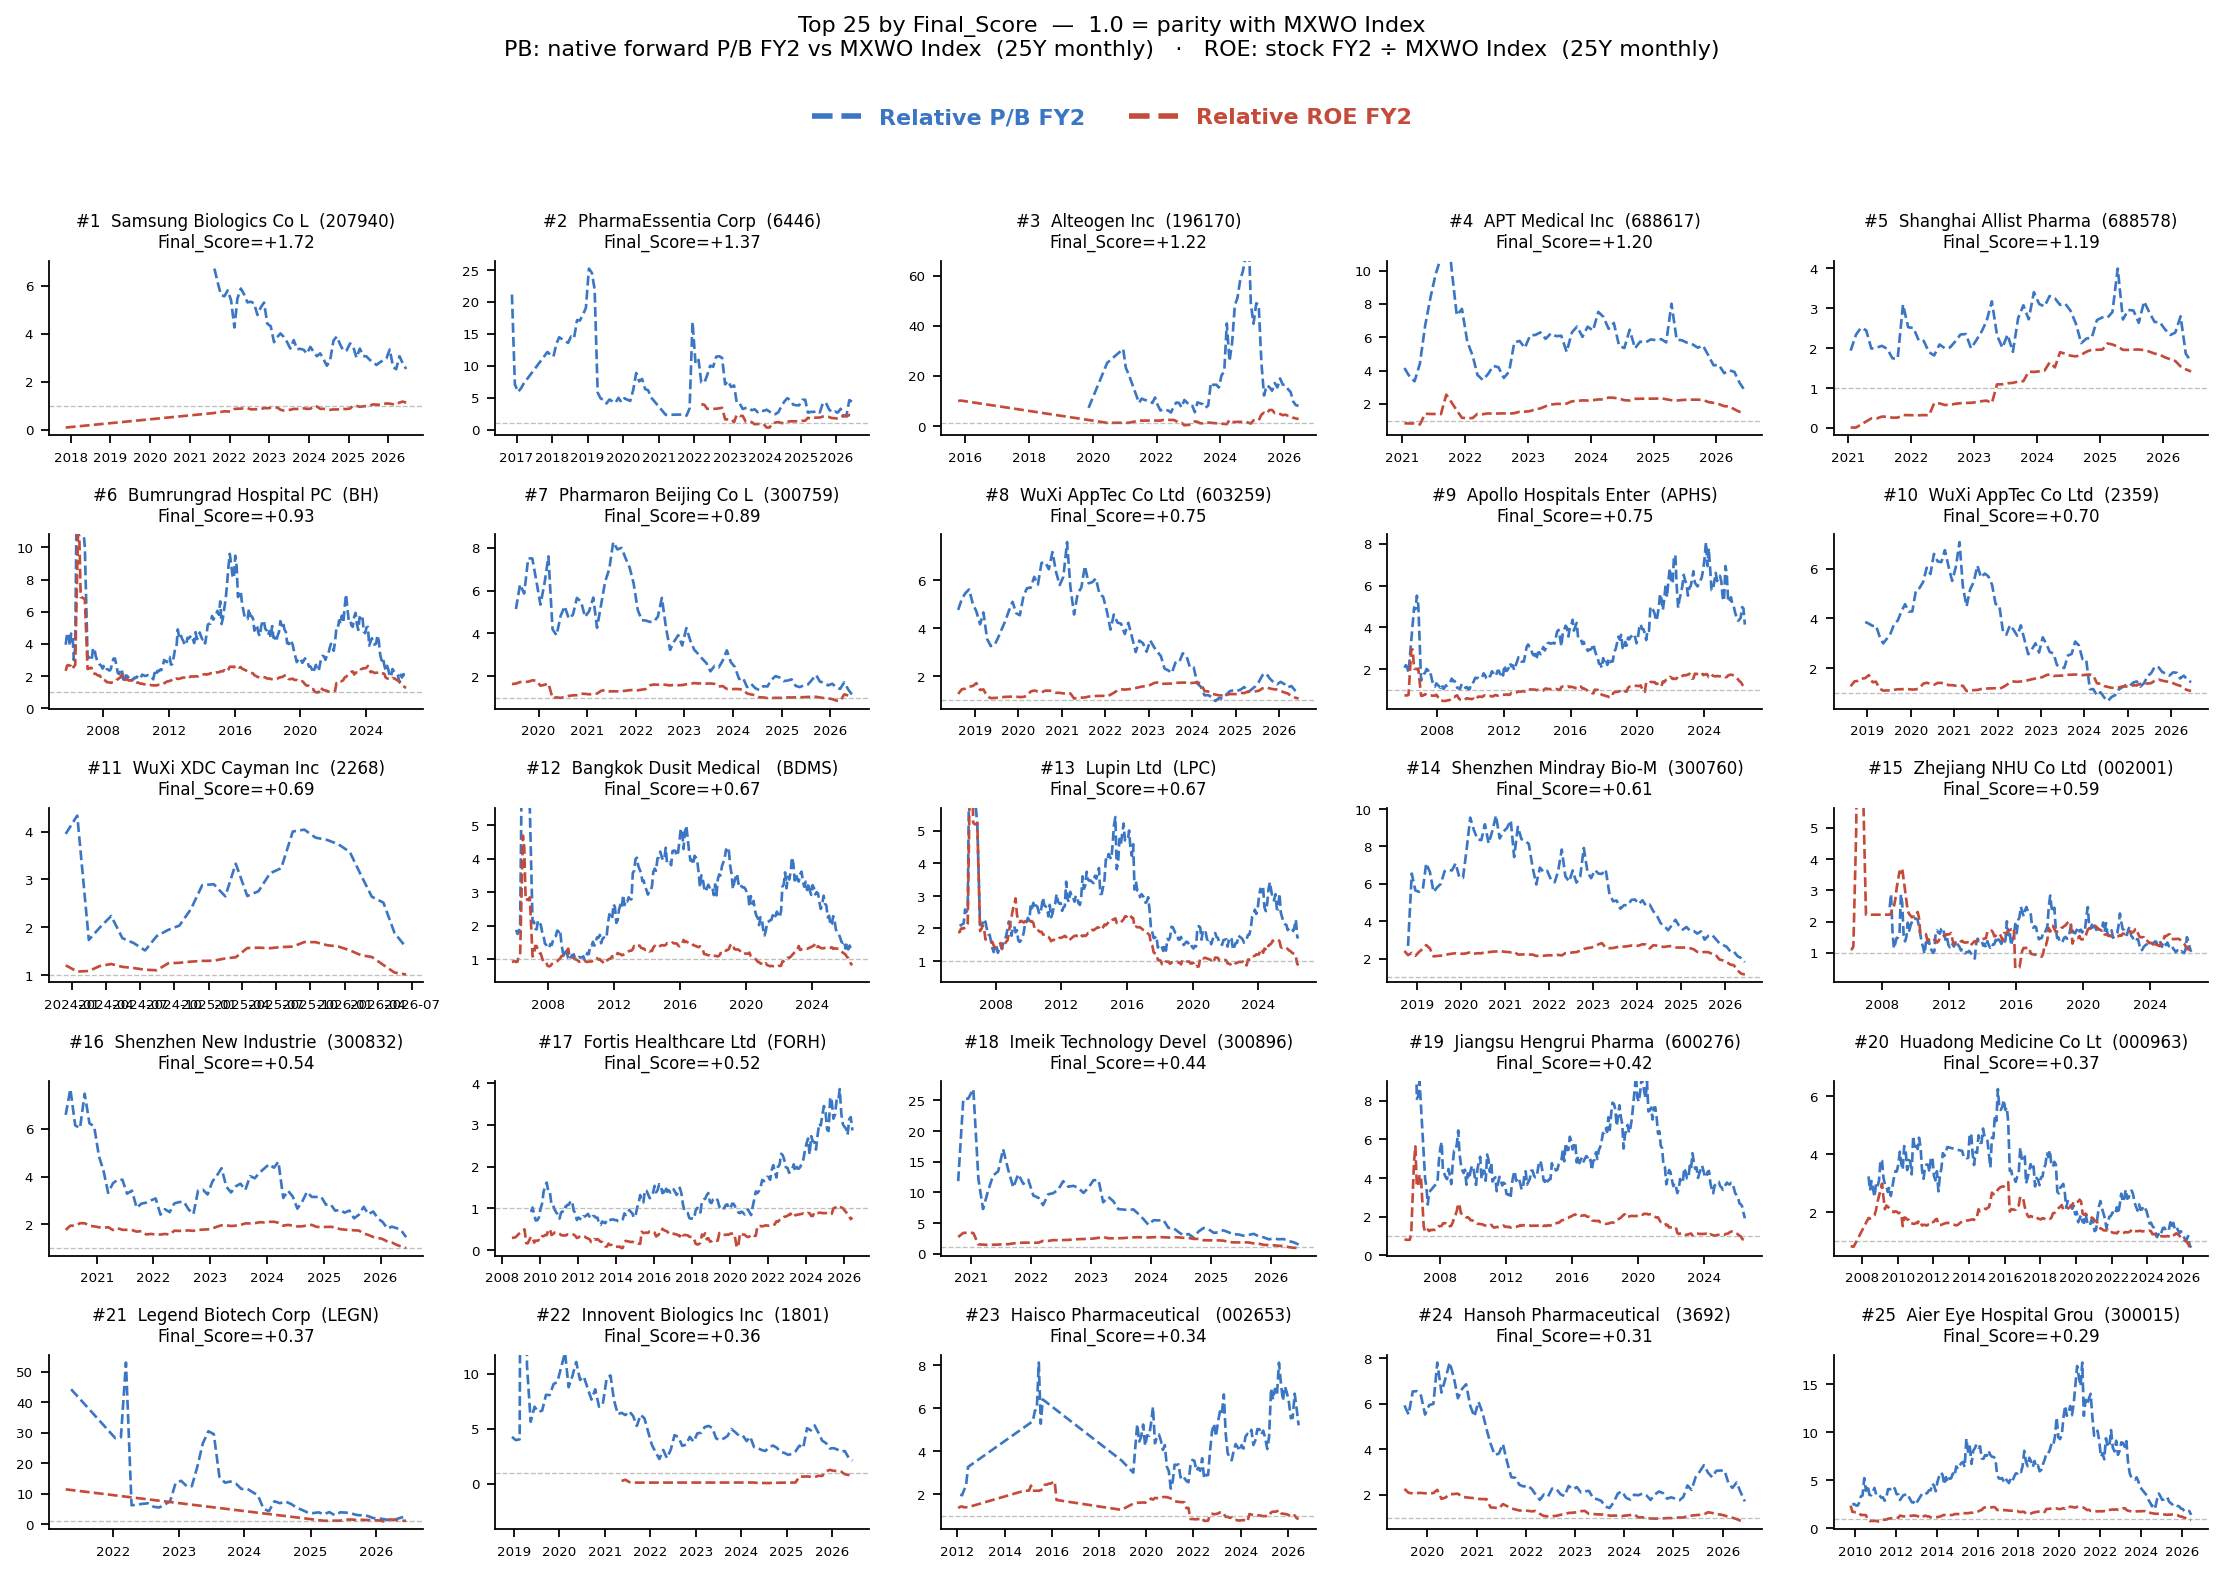
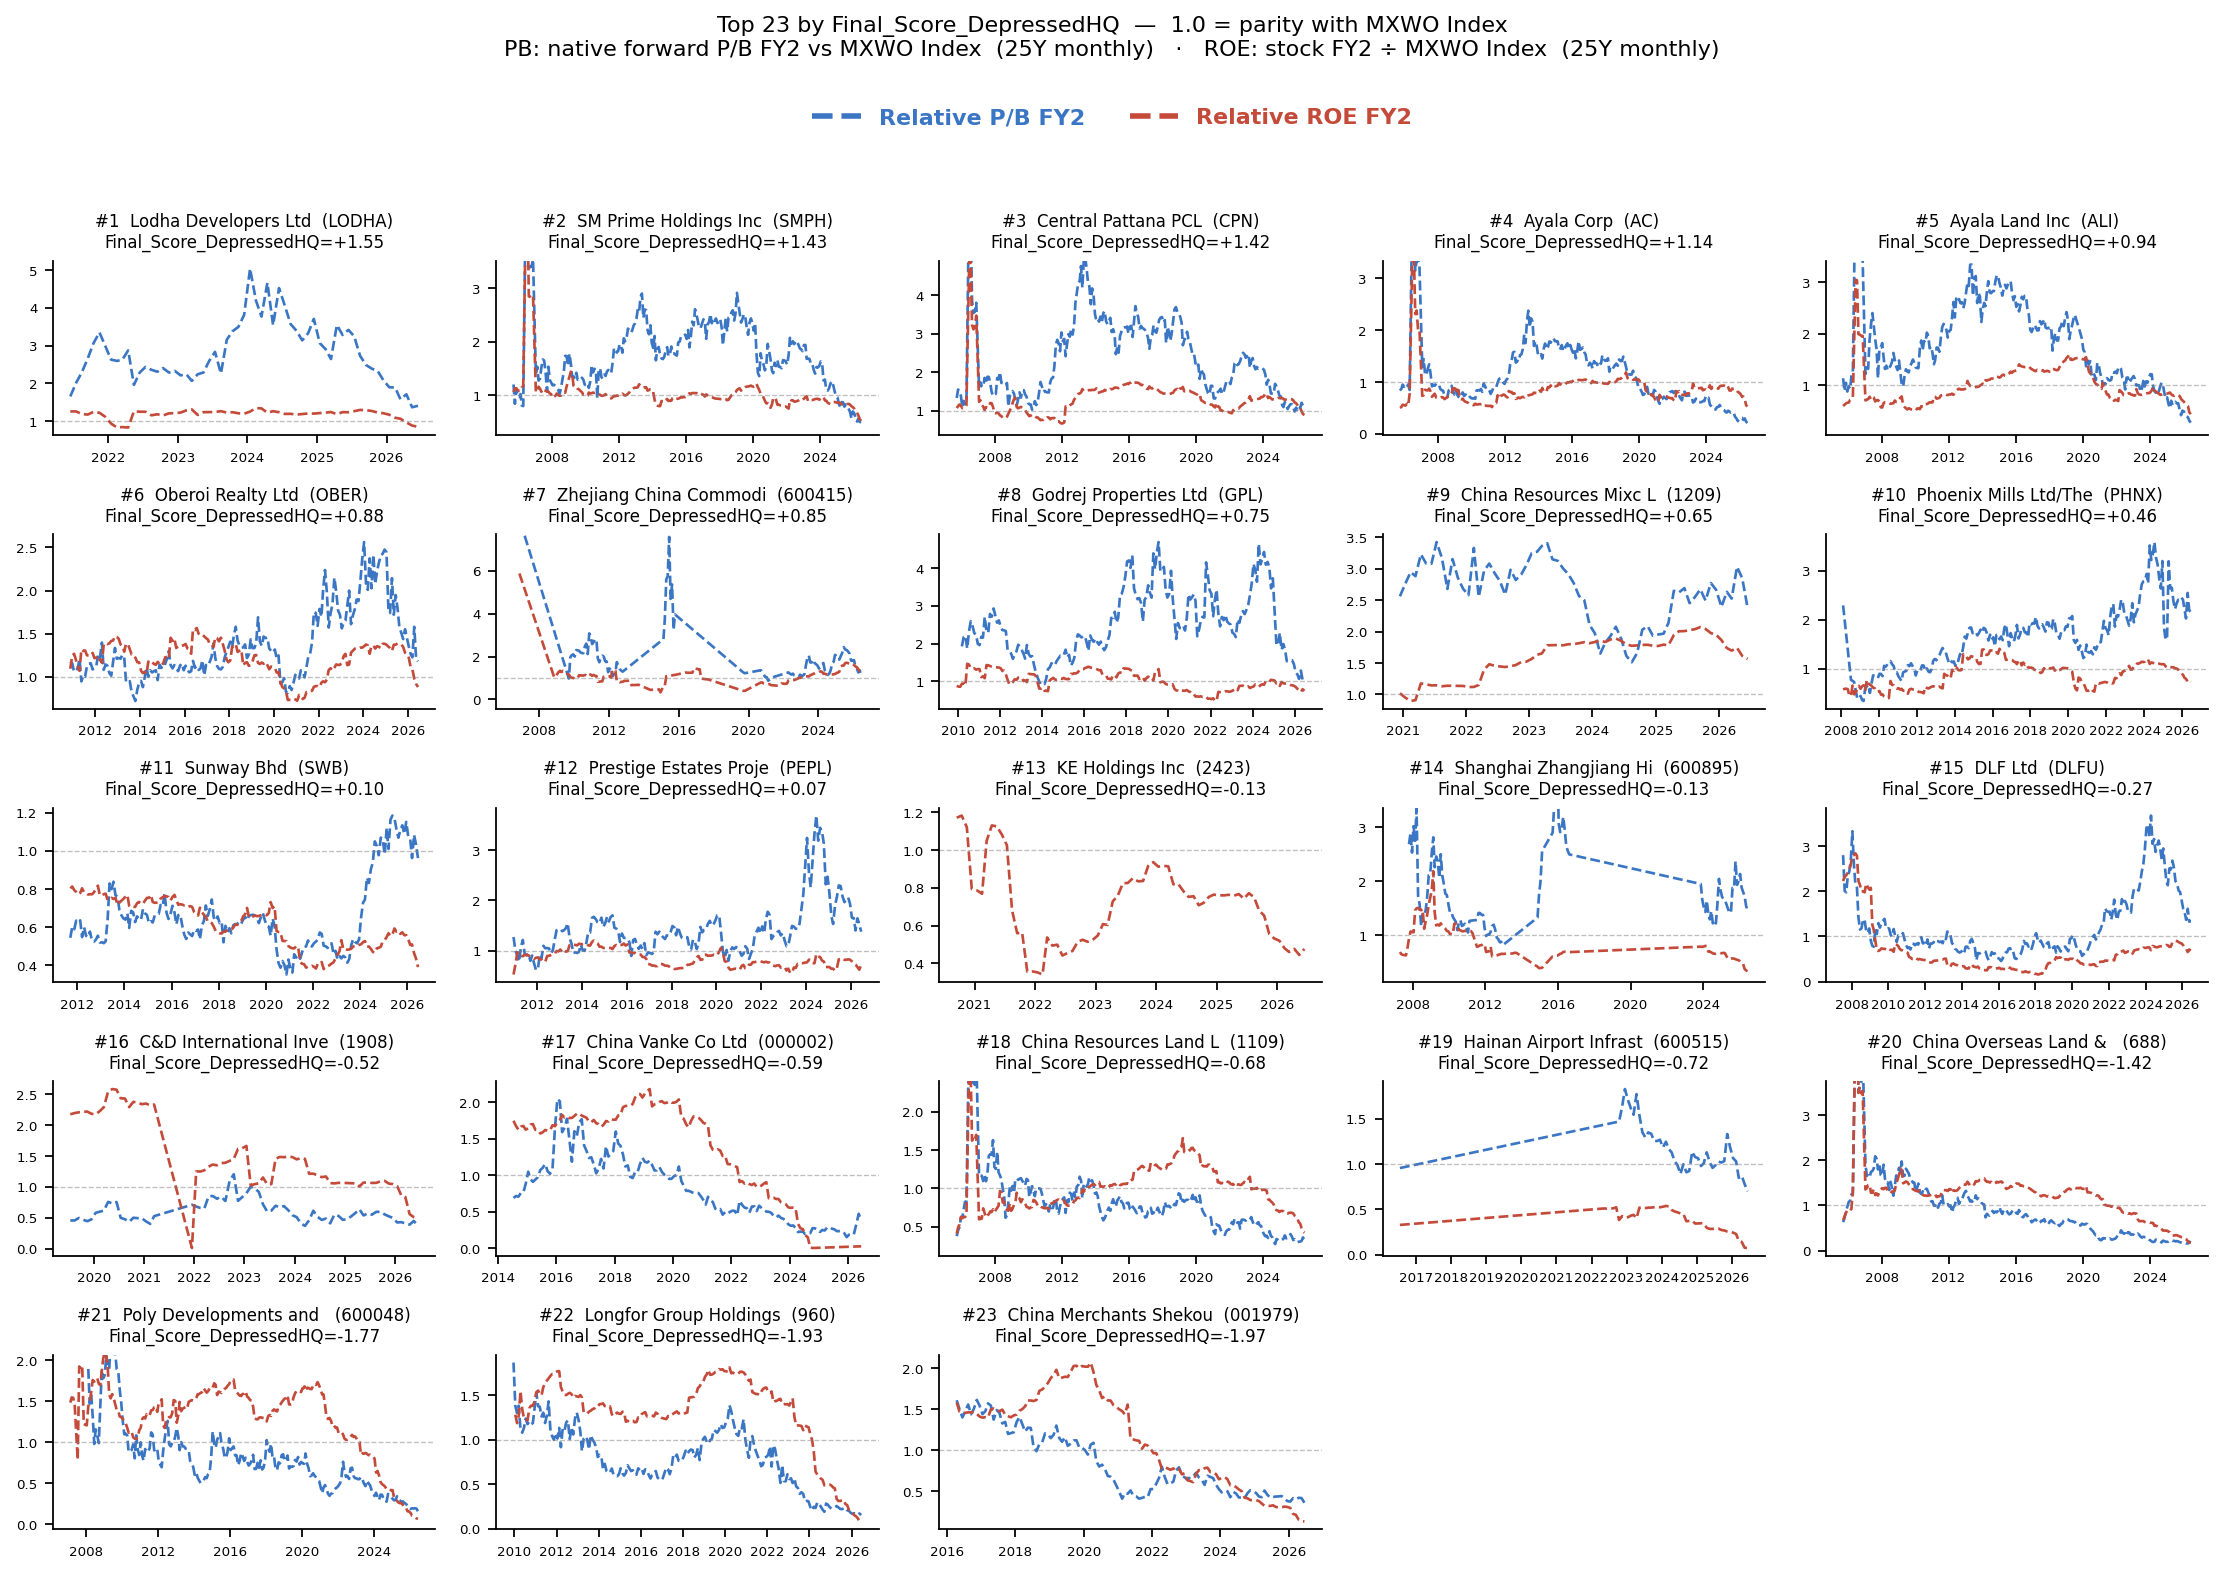
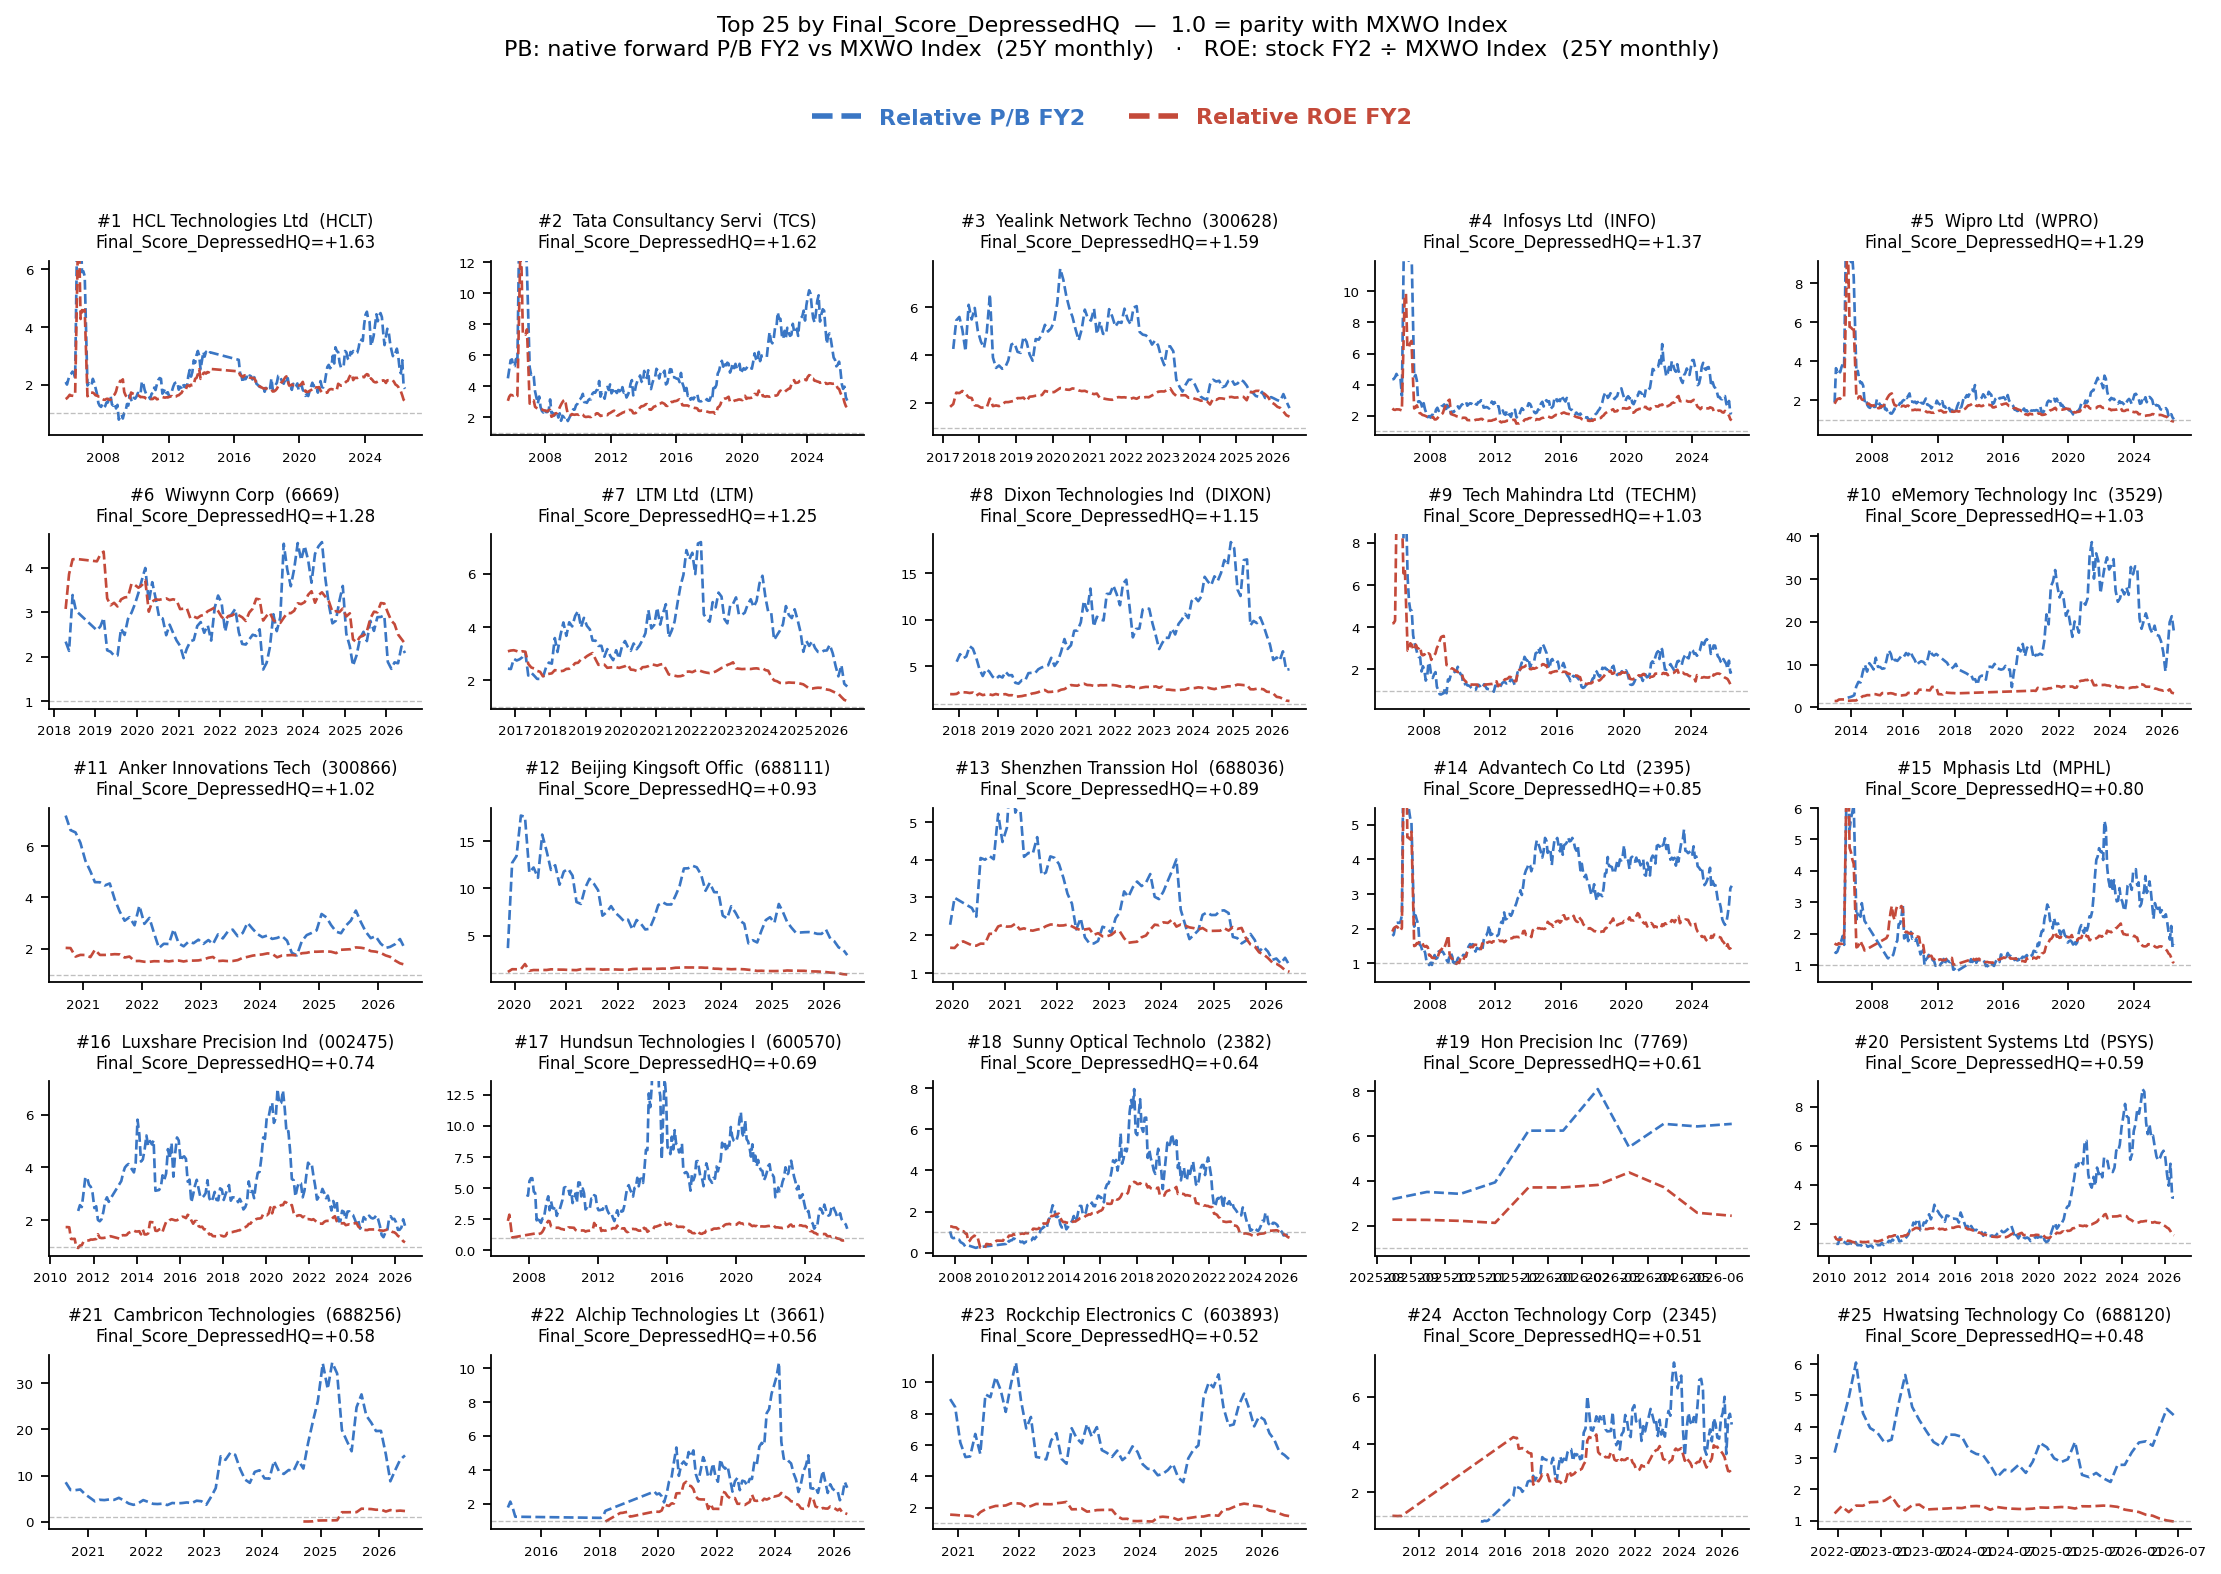
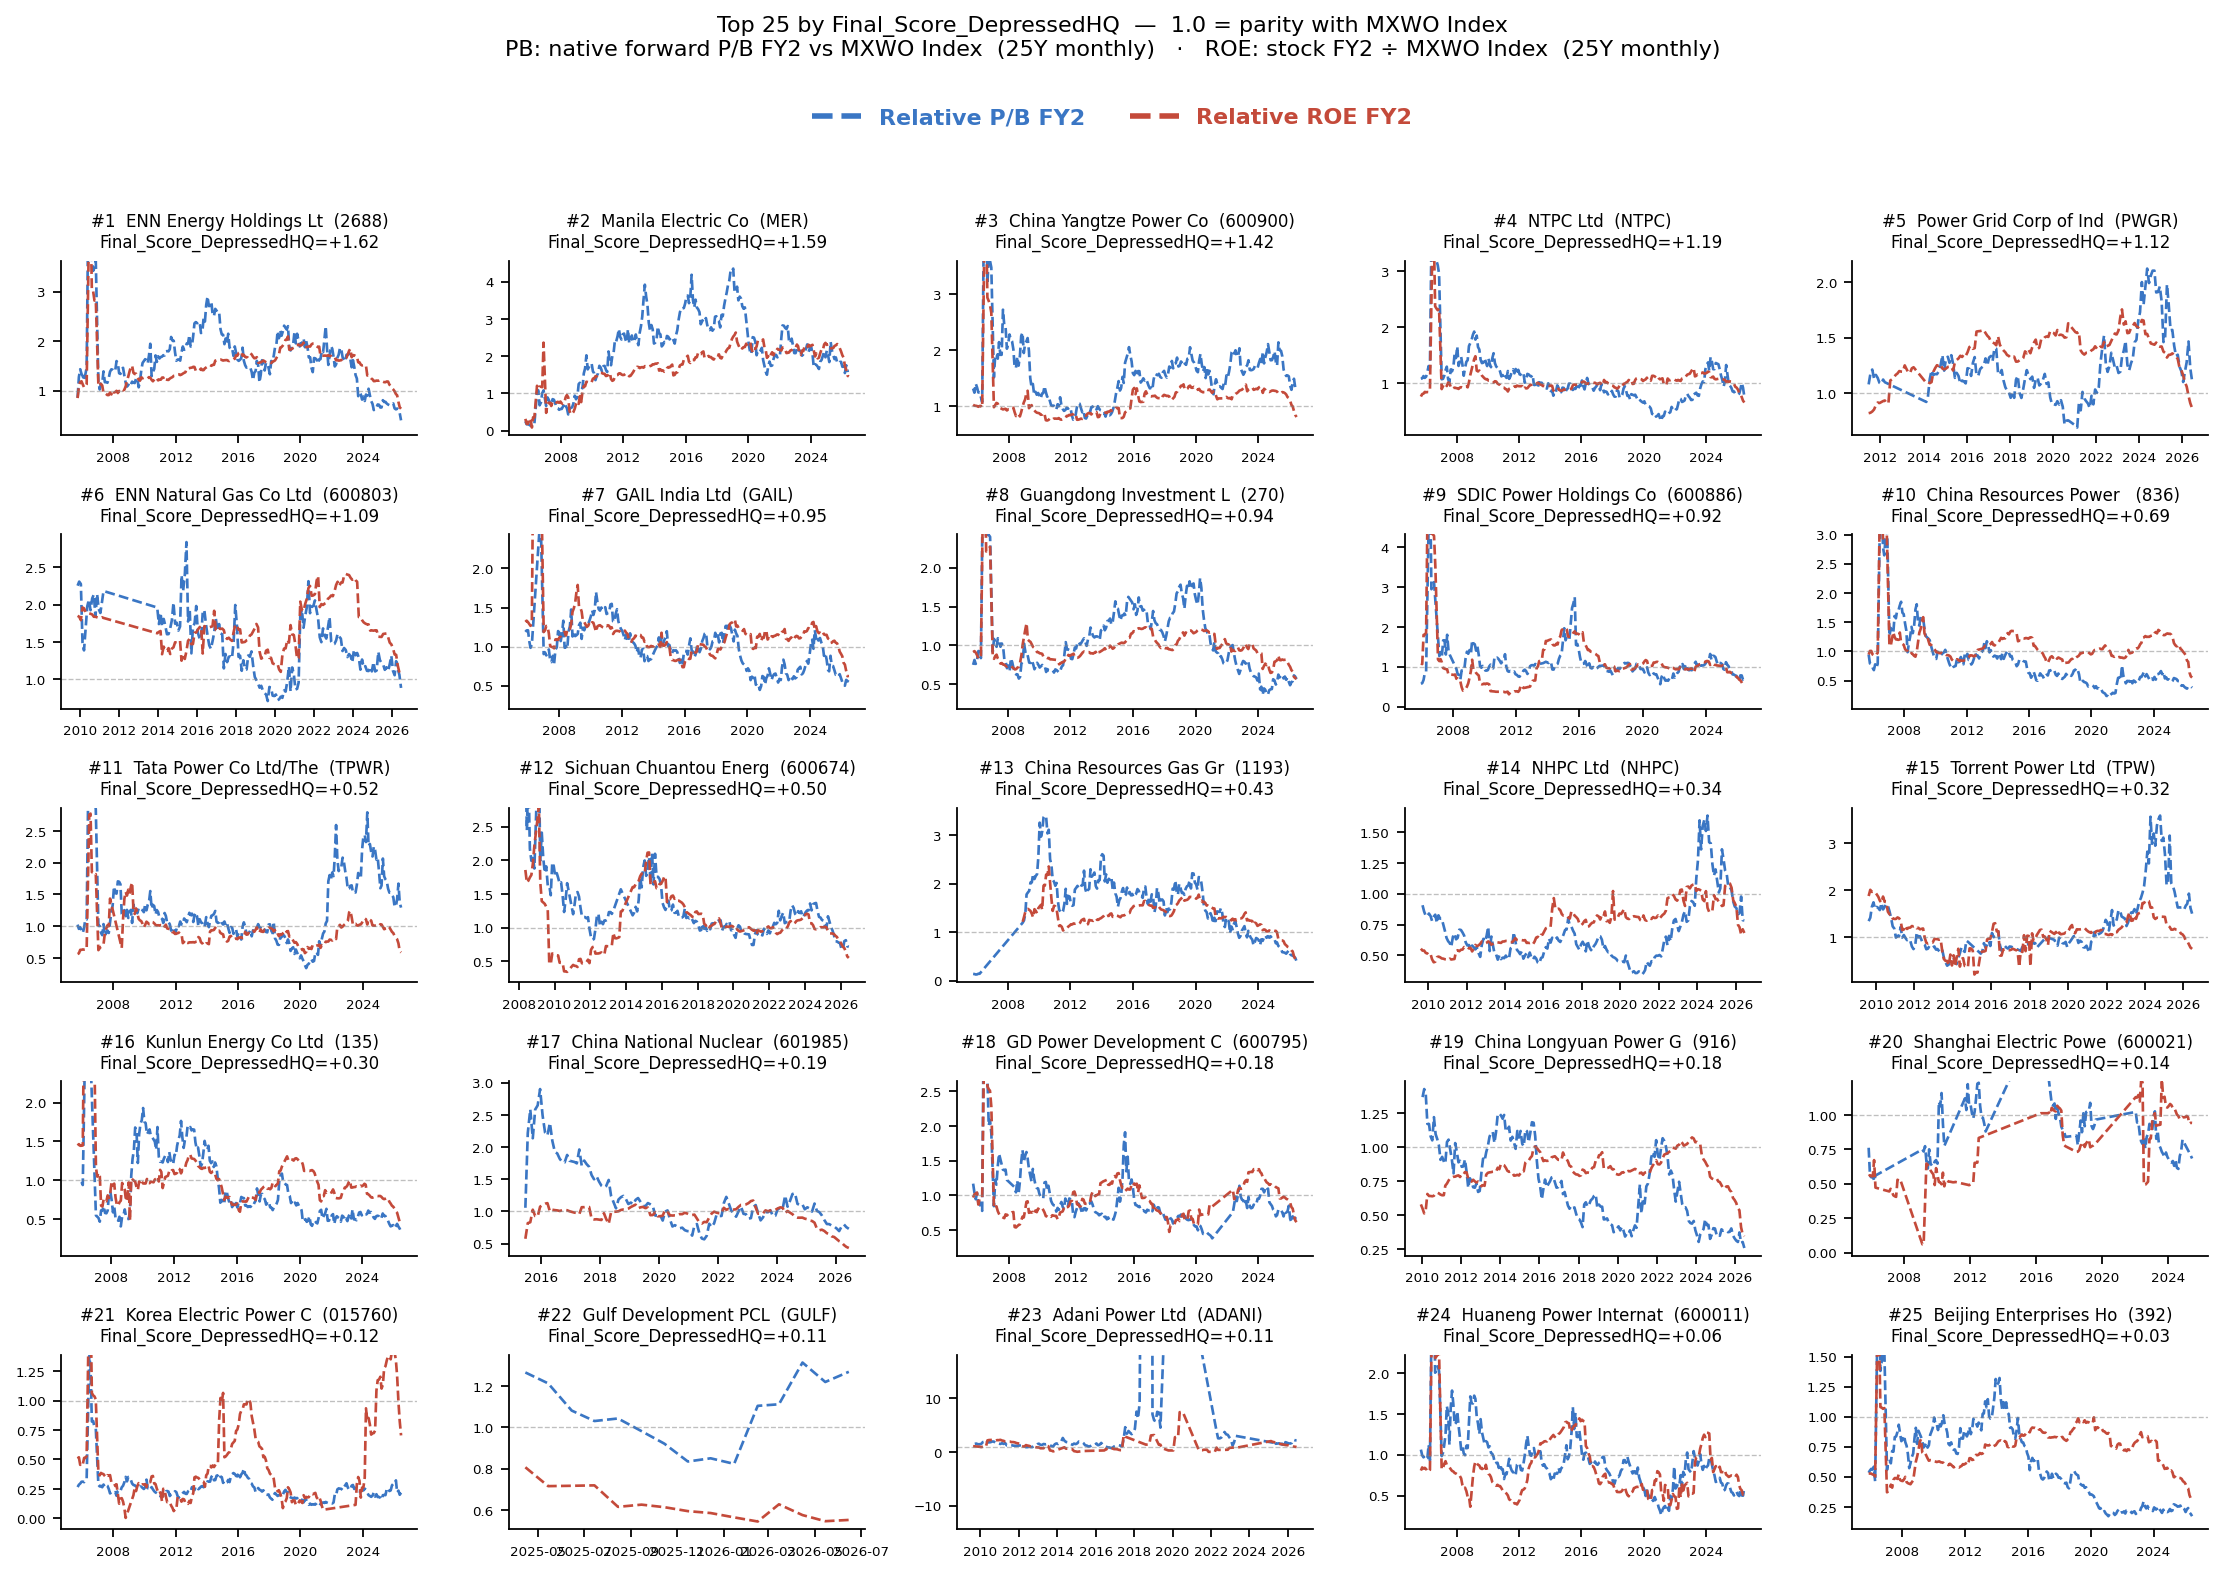
Top 25 By Sector Relative PB / Relative ROE FY2 Panels
Screen Tables
| Rank | Dep HQ Rank | Ticker | Name | Country | Sector | Mkt Cap $bn | Quality | Value | Final | Dep HQ Final | Rel PB | Rel ROE FY2 |
|---|---|---|---|---|---|---|---|---|---|---|---|---|
| 1 | 899 | 034220 KS Equity | LG Display Co Ltd | KR | Technology | 4.6 | 3.48 | 0.46 | 1.97 | -1.28 | 0.42 | 1.96 |
| 2 | 270 | 000975 CH Equity | Shanjin International Gold Co | CN | Materials | 8.7 | 2.33 | 1.45 | 1.89 | 0.45 | 1.42 | 1.69 |
| 3 | 454 | 600489 CH Equity | Zhongjin Gold Corp Ltd | CN | Materials | 15.4 | 2.51 | 1.22 | 1.87 | 0.06 | 1.26 | 1.51 |
| 4 | 534 | 034730 KS Equity | SK Inc | KR | Energy | 28.4 | 2.73 | 0.93 | 1.83 | -0.07 | 0.46 | 1.23 |
| 5 | 779 | 005930 KS Equity | Samsung Electronics Co Ltd | KR | Technology | 1,250.5 | 2.96 | 0.69 | 1.82 | -0.63 | 1.53 | 2.11 |
| 6 | 787 | 600418 CH Equity | Anhui Jianghuai Automobile Gro | CN | Industrials | 10.5 | 3.05 | 0.59 | 1.82 | -0.66 | 2.18 | 1.63 |
| 7 | 467 | 207940 KS Equity | Samsung Biologics Co Ltd | KR | Health Care | 39.5 | 2.35 | 1.10 | 1.72 | 0.04 | 2.97 | 1.12 |
| 8 | 733 | 402340 KS Equity | SK Square Co Ltd | KR | Financials | 116.3 | 3.14 | 0.31 | 1.72 | -0.52 | 1.91 | 3.83 |
| 9 | 125 | 600415 CH Equity | Zhejiang China Commodities Cit | CN | Real Estate | 9.2 | 1.86 | 1.53 | 1.70 | 0.85 | 0.98 | 1.26 |
| 10 | 506 | 1818 HK Equity | Zhaojin Mining Industry Co Ltd | CN | Materials | 9.1 | 1.89 | 1.44 | 1.67 | -0.02 | 0.97 | 1.10 |
| 11 | 555 | 301308 CH Equity | Shenzhen Longsys Electronics C | CN | Technology | 32.2 | 2.24 | 0.93 | 1.58 | -0.12 | 6.73 | 2.01 |
| 12 | 639 | 000660 KS Equity | SK hynix Inc | KR | Technology | 1,015.7 | 2.74 | 0.30 | 1.52 | -0.29 | 3.72 | 3.24 |
| 13 | 13 | TCS IN Equity | Tata Consultancy Services Ltd | IN | Technology | 81.3 | 0.98 | 2.05 | 1.52 | 1.62 | 2.69 | 2.62 |
| 14 | 858 | 005935 KS Equity | Samsung Electronics Co Ltd | KR | Technology | 109.5 | 2.96 | 0.00 | 1.48 | -0.98 | 2.11 | |
| 15 | 227 | 600066 CH Equity | Yutong Bus Co Ltd | CN | Industrials | 9.4 | 1.92 | 1.03 | 1.47 | 0.52 | 1.46 | 1.98 |
| 16 | 362 | 603993 CH Equity | CMOC Group Ltd | CN | Materials | 58.8 | 2.05 | 0.87 | 1.46 | 0.24 | 1.84 | 1.52 |
| 17 | 373 | 3993 HK Equity | CMOC Group Ltd | CN | Materials | 58.8 | 2.05 | 0.80 | 1.43 | 0.21 | 1.56 | 1.52 |
| 18 | 512 | 010140 KS Equity | Samsung Heavy Industries Co Lt | KR | Industrials | 15.8 | 1.98 | 0.85 | 1.42 | -0.03 | 2.04 | 1.32 |
| 19 | 194 | 601899 CH Equity | Zijin Mining Group Co Ltd | CN | Materials | 112.6 | 1.74 | 1.07 | 1.41 | 0.63 | 1.54 | 1.69 |
| 20 | 523 | 601600 CH Equity | Aluminum Corp of China Ltd | CN | Materials | 26.3 | 1.93 | 0.88 | 1.41 | -0.05 | 0.85 | 1.30 |
| 21 | 197 | 2899 HK Equity | Zijin Mining Group Co Ltd | CN | Materials | 112.6 | 1.74 | 1.05 | 1.39 | 0.62 | 1.43 | 1.69 |
| 22 | 223 | 6446 TT Equity | PharmaEssentia Corp | TW | Health Care | 11.4 | 1.93 | 0.82 | 1.37 | 0.53 | 3.91 | 2.23 |
| 23 | 289 | NYKAA IN Equity | FSN E-Commerce Ventures Ltd | IN | Consumer Discretionary | 7.8 | 1.77 | 0.96 | 1.37 | 0.40 | 20.53 | 1.67 |
| 24 | 266 | 001309 CH Equity | Shenzhen Techwinsemi Technolog | CN | Technology | 20.7 | 1.93 | 0.79 | 1.36 | 0.45 | 8.12 | 2.95 |
| 25 | 546 | 2600 HK Equity | Aluminum Corp of China Ltd | CN | Materials | 26.3 | 1.93 | 0.79 | 1.36 | -0.10 | 0.68 | 1.30 |
| Rank | Dep HQ Rank | Ticker | Name | Country | Sector | Mkt Cap $bn | Quality | Value | Final | Dep HQ Final | Rel PB | Rel ROE FY2 |
|---|---|---|---|---|---|---|---|---|---|---|---|---|
| 2 | 270 | 000975 CH Equity | Shanjin International Gold Co | CN | Materials | 8.7 | 2.33 | 1.45 | 1.89 | 0.45 | 1.42 | 1.69 |
| 3 | 454 | 600489 CH Equity | Zhongjin Gold Corp Ltd | CN | Materials | 15.4 | 2.51 | 1.22 | 1.87 | 0.06 | 1.26 | 1.51 |
| 4 | 534 | 034730 KS Equity | SK Inc | KR | Energy | 28.4 | 2.73 | 0.93 | 1.83 | -0.07 | 0.46 | 1.23 |
| 5 | 779 | 005930 KS Equity | Samsung Electronics Co Ltd | KR | Technology | 1,250.5 | 2.96 | 0.69 | 1.82 | -0.63 | 1.53 | 2.11 |
| 7 | 467 | 207940 KS Equity | Samsung Biologics Co Ltd | KR | Health Care | 39.5 | 2.35 | 1.10 | 1.72 | 0.04 | 2.97 | 1.12 |
| 9 | 125 | 600415 CH Equity | Zhejiang China Commodities Cit | CN | Real Estate | 9.2 | 1.86 | 1.53 | 1.70 | 0.85 | 0.98 | 1.26 |
| 10 | 506 | 1818 HK Equity | Zhaojin Mining Industry Co Ltd | CN | Materials | 9.1 | 1.89 | 1.44 | 1.67 | -0.02 | 0.97 | 1.10 |
| 11 | 555 | 301308 CH Equity | Shenzhen Longsys Electronics C | CN | Technology | 32.2 | 2.24 | 0.93 | 1.58 | -0.12 | 6.73 | 2.01 |
| 13 | 13 | TCS IN Equity | Tata Consultancy Services Ltd | IN | Technology | 81.3 | 0.98 | 2.05 | 1.52 | 1.62 | 2.69 | 2.62 |
| 15 | 227 | 600066 CH Equity | Yutong Bus Co Ltd | CN | Industrials | 9.4 | 1.92 | 1.03 | 1.47 | 0.52 | 1.46 | 1.98 |
| 16 | 362 | 603993 CH Equity | CMOC Group Ltd | CN | Materials | 58.8 | 2.05 | 0.87 | 1.46 | 0.24 | 1.84 | 1.52 |
| 17 | 373 | 3993 HK Equity | CMOC Group Ltd | CN | Materials | 58.8 | 2.05 | 0.80 | 1.43 | 0.21 | 1.56 | 1.52 |
| 18 | 512 | 010140 KS Equity | Samsung Heavy Industries Co Lt | KR | Industrials | 15.8 | 1.98 | 0.85 | 1.42 | -0.03 | 2.04 | 1.32 |
| 19 | 194 | 601899 CH Equity | Zijin Mining Group Co Ltd | CN | Materials | 112.6 | 1.74 | 1.07 | 1.41 | 0.63 | 1.54 | 1.69 |
| 20 | 523 | 601600 CH Equity | Aluminum Corp of China Ltd | CN | Materials | 26.3 | 1.93 | 0.88 | 1.41 | -0.05 | 0.85 | 1.30 |
| 21 | 197 | 2899 HK Equity | Zijin Mining Group Co Ltd | CN | Materials | 112.6 | 1.74 | 1.05 | 1.39 | 0.62 | 1.43 | 1.69 |
| 22 | 223 | 6446 TT Equity | PharmaEssentia Corp | TW | Health Care | 11.4 | 1.93 | 0.82 | 1.37 | 0.53 | 3.91 | 2.23 |
| 23 | 289 | NYKAA IN Equity | FSN E-Commerce Ventures Ltd | IN | Consumer Discretionary | 7.8 | 1.77 | 0.96 | 1.37 | 0.40 | 20.53 | 1.67 |
| 24 | 266 | 001309 CH Equity | Shenzhen Techwinsemi Technolog | CN | Technology | 20.7 | 1.93 | 0.79 | 1.36 | 0.45 | 8.12 | 2.95 |
| 25 | 546 | 2600 HK Equity | Aluminum Corp of China Ltd | CN | Materials | 26.3 | 1.93 | 0.79 | 1.36 | -0.10 | 0.68 | 1.30 |
| 26 | 133 | 601628 CH Equity | China Life Insurance Co Ltd | CN | Financials | 138.9 | 1.43 | 1.28 | 1.36 | 0.81 | 0.64 | 0.95 |
| 27 | 437 | 1787 HK Equity | Shandong Gold Mining Co Ltd | CN | Materials | 17.6 | 1.46 | 1.24 | 1.35 | 0.10 | 1.07 | 1.07 |
| 28 | 164 | 9992 HK Equity | Pop Mart International Group L | CN | Consumer Discretionary | 31.1 | 1.63 | 1.05 | 1.34 | 0.71 | 3.47 | 2.13 |
| 29 | 259 | 601336 CH Equity | New China Life Insurance Co Lt | CN | Financials | 25.8 | 1.87 | 0.76 | 1.31 | 0.46 | 0.59 | 1.25 |
| 30 | 455 | 600547 CH Equity | Shandong Gold Mining Co Ltd | CN | Materials | 17.6 | 1.46 | 1.16 | 1.31 | 0.06 | 1.55 | 1.07 |
| Rank | Dep HQ Rank | Ticker | Name | Country | Sector | Mkt Cap $bn | Quality | Value | Final | Dep HQ Final | Rel PB | Rel ROE FY2 |
|---|---|---|---|---|---|---|---|---|---|---|---|---|
| 53 | 1 | BBCA IJ Equity | Bank Central Asia Tbk PT | ID | Financials | 41.1 | 0.22 | 2.10 | 1.16 | 2.24 | 1.12 | 1.10 |
| 74 | 2 | BBRI IJ Equity | Bank Rakyat Indonesia Persero | ID | Financials | 24.3 | 0.21 | 1.78 | 1.00 | 2.00 | 0.50 | 0.98 |
| 180 | 3 | 300760 CH Equity | Shenzhen Mindray Bio-Medical E | CN | Health Care | 27.1 | 0.04 | 1.17 | 0.61 | 1.93 | 1.67 | 1.42 |
| 124 | 4 | ICICIGI IN Equity | ICICI Lombard General Insuranc | IN | Financials | 9.0 | 0.03 | 1.50 | 0.77 | 1.92 | 1.87 | 0.95 |
| 156 | 5 | HAVL IN Equity | Havells India Ltd | IN | Industrials | 7.5 | -0.34 | 1.68 | 0.67 | 1.90 | 2.89 | 1.21 |
| 178 | 6 | BJFIN IN Equity | Bajaj Finserv Ltd | IN | Financials | 27.7 | -0.01 | 1.23 | 0.61 | 1.86 | 1.31 | 0.97 |
| 42 | 7 | 605499 CH Equity | Eastroc Beverage Group Co Ltd | CN | Consumer Staples | 14.1 | 0.49 | 1.92 | 1.21 | 1.84 | 1.75 | 1.86 |
| 176 | 8 | BAF IN Equity | Bajaj Finance Ltd | IN | Financials | 57.0 | 0.14 | 1.10 | 0.62 | 1.77 | 1.89 | 1.09 |
| 192 | 9 | 9633 HK Equity | Nongfu Spring Co Ltd | CN | Consumer Staples | 63.2 | 0.13 | 1.02 | 0.58 | 1.70 | 4.10 | 2.03 |
| 210 | 10 | 300832 CH Equity | Shenzhen New Industries Biomed | CN | Health Care | 5.1 | -0.21 | 1.30 | 0.54 | 1.68 | 1.34 | 1.07 |
| 126 | 11 | SBICARD IN Equity | SBI Cards & Payment Services L | IN | Financials | 5.7 | 0.20 | 1.31 | 0.75 | 1.65 | 1.34 | 0.92 |
| 199 | 12 | HCLT IN Equity | HCL Technologies Ltd | IN | Technology | 31.7 | -0.46 | 1.58 | 0.56 | 1.63 | 1.52 | 1.42 |
| 13 | 13 | TCS IN Equity | Tata Consultancy Services Ltd | IN | Technology | 81.3 | 0.98 | 2.05 | 1.52 | 1.62 | 2.69 | 2.62 |
| 222 | 14 | 2688 HK Equity | ENN Energy Holdings Ltd | CN | Utilities | 7.1 | -0.33 | 1.37 | 0.52 | 1.62 | 0.35 | 0.68 |
| 333 | 15 | MER PM Equity | Manila Electric Co | PH | Utilities | 10.7 | 0.14 | 0.51 | 0.32 | 1.59 | 1.49 | 1.59 |
| 245 | 16 | 300628 CH Equity | Yealink Network Technology Cor | CN | Technology | 6.4 | -0.40 | 1.35 | 0.48 | 1.59 | 1.62 | 1.53 |
| 220 | 17 | CIFC IN Equity | Cholamandalam Investment and F | IN | Financials | 13.0 | 0.21 | 0.84 | 0.52 | 1.57 | 1.65 | 1.06 |
| 188 | 18 | LODHA IN Equity | Lodha Developers Ltd | IN | Real Estate | 9.1 | 0.02 | 1.16 | 0.59 | 1.55 | 1.45 | 0.85 |
| 307 | 19 | PIDI IN Equity | Pidilite Industries Ltd | IN | Materials | 16.0 | -0.12 | 0.84 | 0.36 | 1.54 | 5.44 | 1.37 |
| 277 | 20 | AUBANK IN Equity | AU Small Finance Bank Ltd | IN | Financials | 7.6 | 0.02 | 0.82 | 0.42 | 1.51 | 1.43 | 0.92 |
| 215 | 21 | 600989 CH Equity | Ningxia Baofeng Energy Group C | CN | Materials | 25.0 | 0.00 | 1.07 | 0.53 | 1.50 | 1.18 | 1.32 |
| 58 | 22 | BMRI IJ Equity | Bank Mandiri Persero Tbk PT | ID | Financials | 22.1 | 0.77 | 1.48 | 1.13 | 1.48 | 0.51 | 1.00 |
| 208 | 23 | PAG IN Equity | Page Industries Ltd | IN | Consumer Discretionary | 4.4 | 0.49 | 0.60 | 0.54 | 1.47 | 10.81 | 2.73 |
| 345 | 24 | 600519 CH Equity | Kweichow Moutai Co Ltd | CN | Consumer Staples | 238.8 | -0.04 | 0.63 | 0.30 | 1.45 | 2.22 | 1.70 |
| 318 | 25 | 002142 CH Equity | Bank of Ningbo Co Ltd | CN | Financials | 31.9 | -0.36 | 1.04 | 0.34 | 1.43 | 0.34 | 0.72 |
| Rank | Dep HQ Rank | Ticker | Name | Country | Sector | Mkt Cap $bn | Quality | Value | Final | Dep HQ Final | Rel PB | Rel ROE FY2 |
|---|---|---|---|---|---|---|---|---|---|---|---|---|
| 53 | 1 | BBCA IJ Equity | Bank Central Asia Tbk PT | ID | Financials | 41.1 | 0.22 | 2.10 | 1.16 | 2.24 | 1.12 | 1.10 |
| 74 | 2 | BBRI IJ Equity | Bank Rakyat Indonesia Persero | ID | Financials | 24.3 | 0.21 | 1.78 | 1.00 | 2.00 | 0.50 | 0.98 |
| 180 | 3 | 300760 CH Equity | Shenzhen Mindray Bio-Medical E | CN | Health Care | 27.1 | 0.04 | 1.17 | 0.61 | 1.93 | 1.67 | 1.42 |
| 124 | 4 | ICICIGI IN Equity | ICICI Lombard General Insuranc | IN | Financials | 9.0 | 0.03 | 1.50 | 0.77 | 1.92 | 1.87 | 0.95 |
| 156 | 5 | HAVL IN Equity | Havells India Ltd | IN | Industrials | 7.5 | -0.34 | 1.68 | 0.67 | 1.90 | 2.89 | 1.21 |
| 178 | 6 | BJFIN IN Equity | Bajaj Finserv Ltd | IN | Financials | 27.7 | -0.01 | 1.23 | 0.61 | 1.86 | 1.31 | 0.97 |
| 42 | 7 | 605499 CH Equity | Eastroc Beverage Group Co Ltd | CN | Consumer Staples | 14.1 | 0.49 | 1.92 | 1.21 | 1.84 | 1.75 | 1.86 |
| 176 | 8 | BAF IN Equity | Bajaj Finance Ltd | IN | Financials | 57.0 | 0.14 | 1.10 | 0.62 | 1.77 | 1.89 | 1.09 |
| 192 | 9 | 9633 HK Equity | Nongfu Spring Co Ltd | CN | Consumer Staples | 63.2 | 0.13 | 1.02 | 0.58 | 1.70 | 4.10 | 2.03 |
| 210 | 10 | 300832 CH Equity | Shenzhen New Industries Biomed | CN | Health Care | 5.1 | -0.21 | 1.30 | 0.54 | 1.68 | 1.34 | 1.07 |
| 126 | 11 | SBICARD IN Equity | SBI Cards & Payment Services L | IN | Financials | 5.7 | 0.20 | 1.31 | 0.75 | 1.65 | 1.34 | 0.92 |
| 199 | 12 | HCLT IN Equity | HCL Technologies Ltd | IN | Technology | 31.7 | -0.46 | 1.58 | 0.56 | 1.63 | 1.52 | 1.42 |
| 222 | 14 | 2688 HK Equity | ENN Energy Holdings Ltd | CN | Utilities | 7.1 | -0.33 | 1.37 | 0.52 | 1.62 | 0.35 | 0.68 |
| 245 | 16 | 300628 CH Equity | Yealink Network Technology Cor | CN | Technology | 6.4 | -0.40 | 1.35 | 0.48 | 1.59 | 1.62 | 1.53 |
| 220 | 17 | CIFC IN Equity | Cholamandalam Investment and F | IN | Financials | 13.0 | 0.21 | 0.84 | 0.52 | 1.57 | 1.65 | 1.06 |
| 188 | 18 | LODHA IN Equity | Lodha Developers Ltd | IN | Real Estate | 9.1 | 0.02 | 1.16 | 0.59 | 1.55 | 1.45 | 0.85 |
| 307 | 19 | PIDI IN Equity | Pidilite Industries Ltd | IN | Materials | 16.0 | -0.12 | 0.84 | 0.36 | 1.54 | 5.44 | 1.37 |
| 277 | 20 | AUBANK IN Equity | AU Small Finance Bank Ltd | IN | Financials | 7.6 | 0.02 | 0.82 | 0.42 | 1.51 | 1.43 | 0.92 |
| 215 | 21 | 600989 CH Equity | Ningxia Baofeng Energy Group C | CN | Materials | 25.0 | 0.00 | 1.07 | 0.53 | 1.50 | 1.18 | 1.32 |
| 58 | 22 | BMRI IJ Equity | Bank Mandiri Persero Tbk PT | ID | Financials | 22.1 | 0.77 | 1.48 | 1.13 | 1.48 | 0.51 | 1.00 |
| 318 | 25 | 002142 CH Equity | Bank of Ningbo Co Ltd | CN | Financials | 31.9 | -0.36 | 1.04 | 0.34 | 1.43 | 0.34 | 0.72 |
| 295 | 26 | SMPH PM Equity | SM Prime Holdings Inc | PH | Real Estate | 8.3 | -0.61 | 1.38 | 0.38 | 1.43 | 0.43 | 0.55 |
| 120 | 27 | CPN TB Equity | Central Pattana PCL | TH | Real Estate | 9.0 | 0.50 | 1.05 | 0.78 | 1.42 | 0.97 | 0.89 |
| 103 | 29 | 601601 CH Equity | China Pacific Insurance Group | CN | Financials | 44.5 | 0.29 | 1.42 | 0.86 | 1.42 | 0.37 | 0.78 |
| 72 | 30 | INFO IN Equity | Infosys Ltd | IN | Technology | 47.6 | 0.30 | 1.71 | 1.01 | 1.37 | 1.83 | 1.71 |
| Rank | Dep HQ Rank | Ticker | Name | Country | Sector | Mkt Cap $bn | Quality | Value | Final | Dep HQ Final | Rel PB | Rel ROE FY2 |
|---|---|---|---|---|---|---|---|---|---|---|---|---|
| 787 | 659 | 316140 KS Equity | Woori Financial Group Inc | KR | Financials | 15.0 | -0.87 | -0.47 | -0.67 | -0.33 | 0.26 | 0.47 |
| 788 | 861 | 601360 CH Equity | 360 Security Technology Inc | CN | Communications | 9.5 | -0.92 | -0.42 | -0.67 | -0.99 | 0.84 | 0.03 |
| 805 | 356 | 601998 CH Equity | China CITIC Bank Corp Ltd | CN | Financials | 61.0 | -1.06 | -0.42 | -0.74 | 0.25 | 0.19 | 0.53 |
| 816 | 848 | 301269 CH Equity | Empyrean Technology Co Ltd | CN | Technology | 7.6 | -0.89 | -0.66 | -0.78 | -0.91 | 3.86 | 0.31 |
| 818 | 896 | 011200 KS Equity | HMM Co Ltd | KR | Industrials | 12.5 | -0.82 | -0.75 | -0.79 | -1.23 | 0.28 | 0.20 |
| 822 | 748 | SCB TB Equity | SCB X PCL | TH | Financials | 14.4 | -0.84 | -0.78 | -0.81 | -0.56 | 0.35 | 0.47 |
| 823 | 384 | 601985 CH Equity | China National Nuclear Power C | CN | Utilities | 28.1 | -1.06 | -0.57 | -0.82 | 0.19 | 0.59 | 0.50 |
| 828 | 879 | 688126 CH Equity | National Silicon Industry Grou | CN | Technology | 14.5 | -1.04 | -0.64 | -0.84 | -1.11 | 2.21 | 0.06 |
| 829 | 778 | 051910 KS Equity | LG Chem Ltd | KR | Materials | 16.1 | -1.18 | -0.53 | -0.85 | -0.63 | 0.28 | 0.30 |
| 830 | 836 | 002459 CH Equity | JA Solar Technology Co Ltd | CN | Energy | 4.3 | -1.18 | -0.53 | -0.86 | -0.84 | 0.50 | 0.16 |
| 833 | 425 | RHBBANK MK Equity | RHB Bank Bhd | MY | Financials | 9.0 | -0.95 | -0.77 | -0.86 | 0.11 | 0.42 | 0.55 |
| 834 | 699 | 601825 CH Equity | Shanghai Rural Commercial Bank | CN | Financials | 12.7 | -0.93 | -0.80 | -0.86 | -0.41 | 0.24 | 0.48 |
| 836 | 885 | 028260 KS Equity | Samsung C&T Corp | KR | Industrials | 46.7 | -0.81 | -0.93 | -0.87 | -1.16 | 0.49 | 0.33 |
| 838 | 803 | 1101 TT Equity | TCC Group Holdings Co Ltd | TW | Materials | 5.8 | -1.32 | -0.45 | -0.88 | -0.71 | 0.30 | 0.20 |
| 839 | 640 | 601231 CH Equity | Universal Scientific Industria | CN | Technology | 12.0 | -0.90 | -0.88 | -0.89 | -0.29 | 1.37 | 0.76 |
| 840 | 540 | 1398 HK Equity | Industrial & Commercial Bank o | CN | Financials | 390.1 | -1.28 | -0.49 | -0.89 | -0.08 | 0.21 | 0.47 |
| 842 | 834 | 003670 KS Equity | POSCO Future M Co Ltd | KR | Materials | 11.8 | -1.34 | -0.46 | -0.90 | -0.82 | 1.70 | 0.11 |
| 843 | 618 | SIEM IN Equity | Siemens Ltd | IN | Industrials | 13.2 | -0.86 | -0.93 | -0.90 | -0.24 | 3.62 | 0.69 |
| 844 | 872 | 000066 CH Equity | China Greatwall Technology Gro | CN | Technology | 7.4 | -1.10 | -0.72 | -0.91 | -1.05 | 1.78 | 0.13 |
| 845 | 503 | DRRD IN Equity | Dr Reddy's Laboratories Ltd | IN | Health Care | 11.2 | -1.25 | -0.60 | -0.92 | -0.01 | 1.06 | 0.65 |
| 846 | 504 | 000858 CH Equity | Wuliangye Yibin Co Ltd | CN | Consumer Staples | 45.9 | -0.90 | -0.96 | -0.93 | -0.01 | 0.91 | 0.88 |
| 847 | 831 | 1301 TT Equity | Formosa Plastics Corp | TW | Materials | 9.1 | -1.32 | -0.55 | -0.94 | -0.81 | 0.29 | 0.17 |
| 850 | 859 | 300418 CH Equity | Kunlun Tech Co Ltd | CN | Communications | 7.1 | -1.10 | -0.79 | -0.94 | -0.98 | 1.49 | 0.10 |
| 853 | 800 | PCHEM MK Equity | Petronas Chemicals Group Bhd | MY | Materials | 10.5 | -1.40 | -0.50 | -0.95 | -0.70 | 0.42 | 0.18 |
| 854 | 860 | 688347 CH Equity | Hua Hong Grace Semiconductor L | CN | Technology | 36.8 | -1.12 | -0.79 | -0.95 | -0.99 | 2.61 | 0.20 |
Extraction Warnings
- Country 'CN' = 58% of top quartile (>50%)
- 108 stocks (11%) incomplete (expected <10%)
- [value_index] 3 stocks with Relative_PE > 50 (possible currency mismatch)
- [value_index] Z_Expanding std = 1.536 (expected ~1)
- [value_index] 14 stocks with |Z_Expanding| > 5
- [value_index] Z_PB_Expanding mean = -0.555 (expected ~0)
- [value_index] Z_PB_Expanding std = 1.533 (expected ~1)
- [value_index] 13 stocks with |Z_PB_Expanding| > 5
Appendix: Methodology
This dashboard ranks companies in the selected benchmark, currently MSCI World / MXWO Index, using a Quality Value framework. The model is designed to find companies that combine attractive valuation with strong or improving business quality.
The screen has two views: Canonical QV and Depressed HQ. Both use the same value score. They differ only in how the quality score is defined.
Canonical QV
Canonical QV is the base version of the model.
Final Score = 50% Quality Composite + 50% Value Composite
The Quality Composite combines:
- Quality Level: how strong a company's forward FY2 ROE is versus the benchmark, ranked within its GICS sector.
- Quality Momentum: whether that relative ROE is high or low versus the company's own 10-year history.
The Value Composite combines:
- Value vs Index: whether the company is cheap versus the benchmark on relative valuation.
- Value vs Sector: whether the company is cheap versus its own sector peers.
The scored valuation inputs are mainly relative P/E and EV/EBIT. Lower valuation is converted into a higher value score. For financials, where EV/EBIT is not meaningful, the model falls back more heavily to P/E. Relative P/B is shown in the charts as an important diagnostic, especially for financials, but it is not currently part of the scored value composite.
Depressed HQ
Depressed HQ is a complementary, more contrarian version of the screen.
It keeps the same Value Composite as Canonical QV, but changes the quality lens. Instead of rewarding companies whose relative ROE is high versus their own history, it looks for companies that still rank well on current quality but whose relative ROE is depressed versus their own historical norm.
In simple terms, Depressed HQ is trying to find good businesses, still cheap, where current quality looks cyclically or temporarily depressed.
Depressed HQ Score = 50% Depressed Quality + 50% Value Composite
This view is useful for identifying recovery candidates that may not look strongest on near-term momentum, but still have enough underlying quality to be interesting.
How To Read The Charts
The Relative P/B and Relative ROE panels are diagnostic charts for the companies selected by each approach. Switching between Canonical QV and Depressed HQ changes the selected company list. The chart definitions stay the same.
- Relative P/B shows how expensive or cheap the company is versus the benchmark on price-to-book.
- Relative ROE shows how profitable the company is versus the benchmark on forward ROE.
- The most interesting candidates are often companies where relative valuation is low or normalizing while relative ROE is stable, improving, or cyclically depressed but recoverable.