Consensus CapEx Cycle
MSCI ACWI point-in-time membership · current classification backcast · latest 14 Jul 2026
12M capex
$4,693bn
all 11 sectors
24M capex
$4,943bn
all 11 sectors
Forward growth (24M ÷ 12M − 1)
5.3%
all-sector forward growth
Covered securities
2,027
of 2,460 latest ACWI members
Name coverage
82.4%
strict FY1-FY3 calendarization
Forward growth ex Financials
+4.7%
24M ÷ 12M − 1, composition-controlled basket
Latest sector snapshot
| Sector | 12M capex | 24M capex | Growth | Covered securities | Coverage |
|---|---|---|---|---|---|
| Communication Services | $948.3bn | $1,086.4bn | 14.6% | 116 | 98.3% |
| Information Technology | $805.1bn | $889.4bn | 10.5% | 310 | 94.8% |
| Utilities | $580.1bn | $597.4bn | 3.0% | 129 | 97.0% |
| Consumer Discretionary | $574.4bn | $592.1bn | 3.1% | 209 | 95.0% |
| Energy | $551.6bn | $542.5bn | -1.6% | 95 | 96.9% |
| Industrials | $415.1bn | $424.1bn | 2.2% | 406 | 96.7% |
| Materials | $300.3bn | $288.1bn | -4.1% | 219 | 96.5% |
| Consumer Staples | $170.1bn | $172.6bn | 1.5% | 159 | 98.1% |
| Financials | $163.6bn | $165.0bn | 0.8% | 121 | 25.3% |
| Health Care | $133.0bn | $134.3bn | 0.9% | 178 | 95.7% |
| Real Estate | $51.7bn | $51.2bn | -1.1% | 85 | 93.4% |
Latest consensus CapEx forward growth
| Aggregate | Forward growth (24M ÷ 12M − 1) | 5Y signal | Same-base companies |
|---|---|---|---|
| Global ex Financials | +4.7% | +3.36 | 1,699 |
| Global ex Financials & hyperscalers | +2.1% | +2.21 | 1,694 |
| China ex Financials | -2.7% | -0.68 | 354 |
| India ex Financials | +2.3% | +1.05 | 103 |
| Communication Services ex Alphabet & Meta | -0.2% | +0.41 | 101 |
| Consumer Discretionary ex Amazon | -0.1% | -1.08 | 197 |
| Magnificent Seven | +12.2% | +2.41 | 7 |
| India ex Financials & Reliance | +2.7% | +0.88 | 102 |
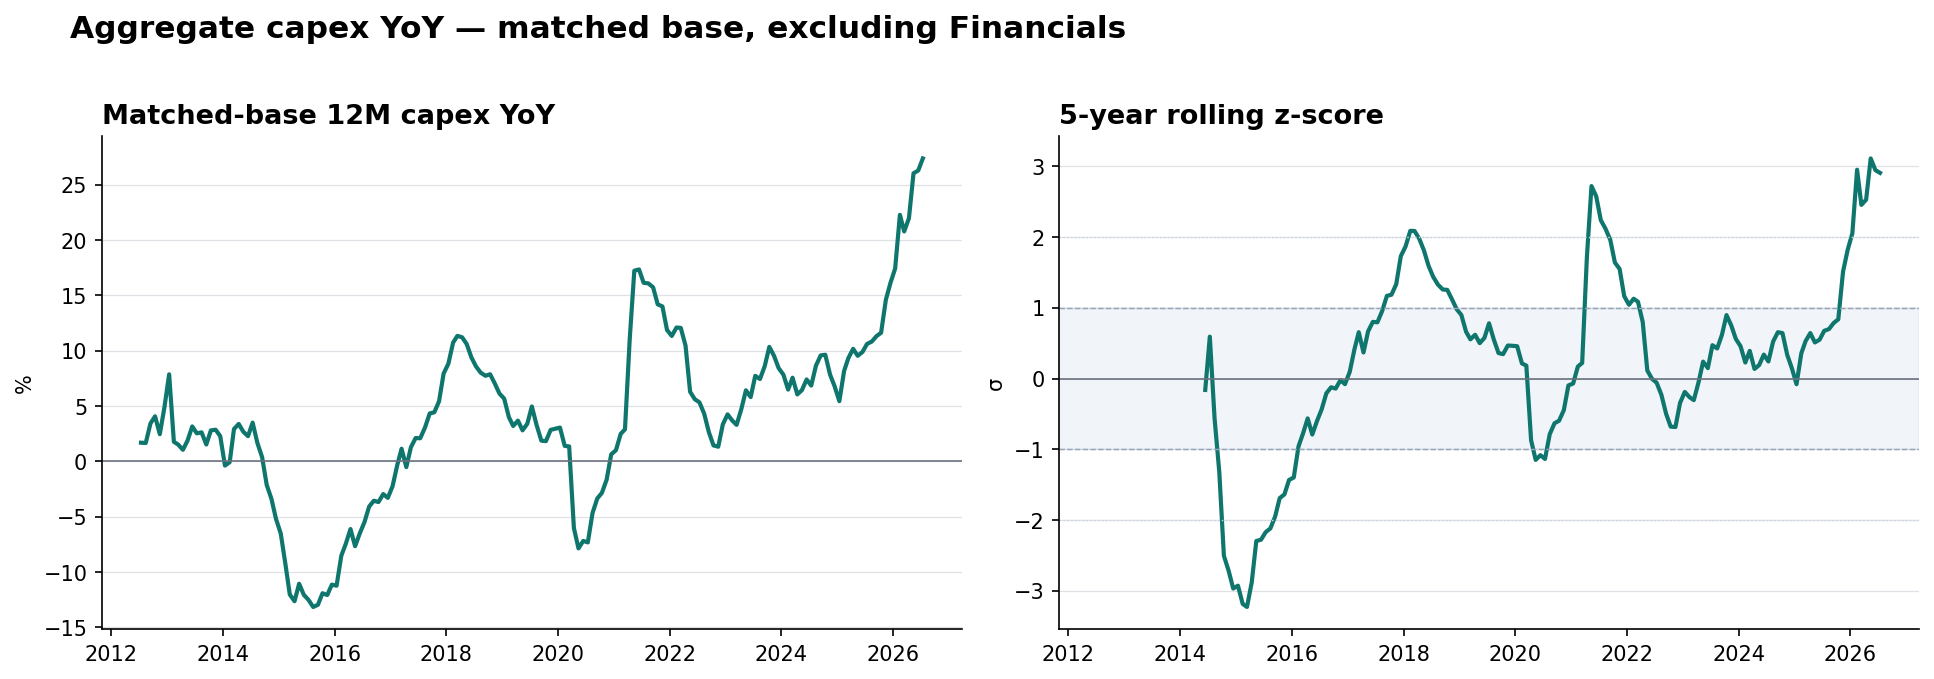
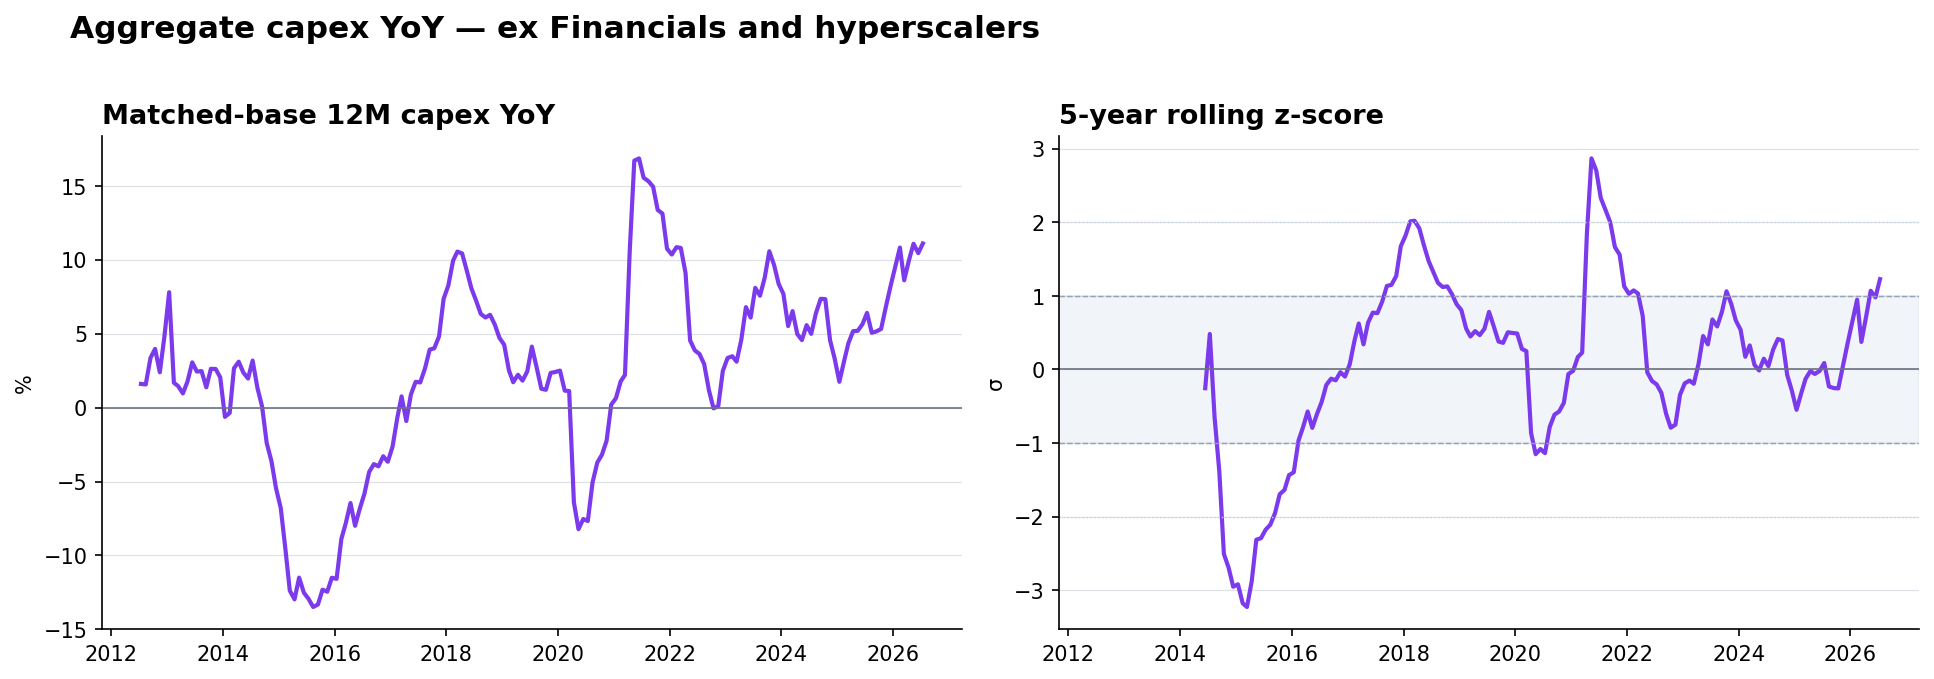
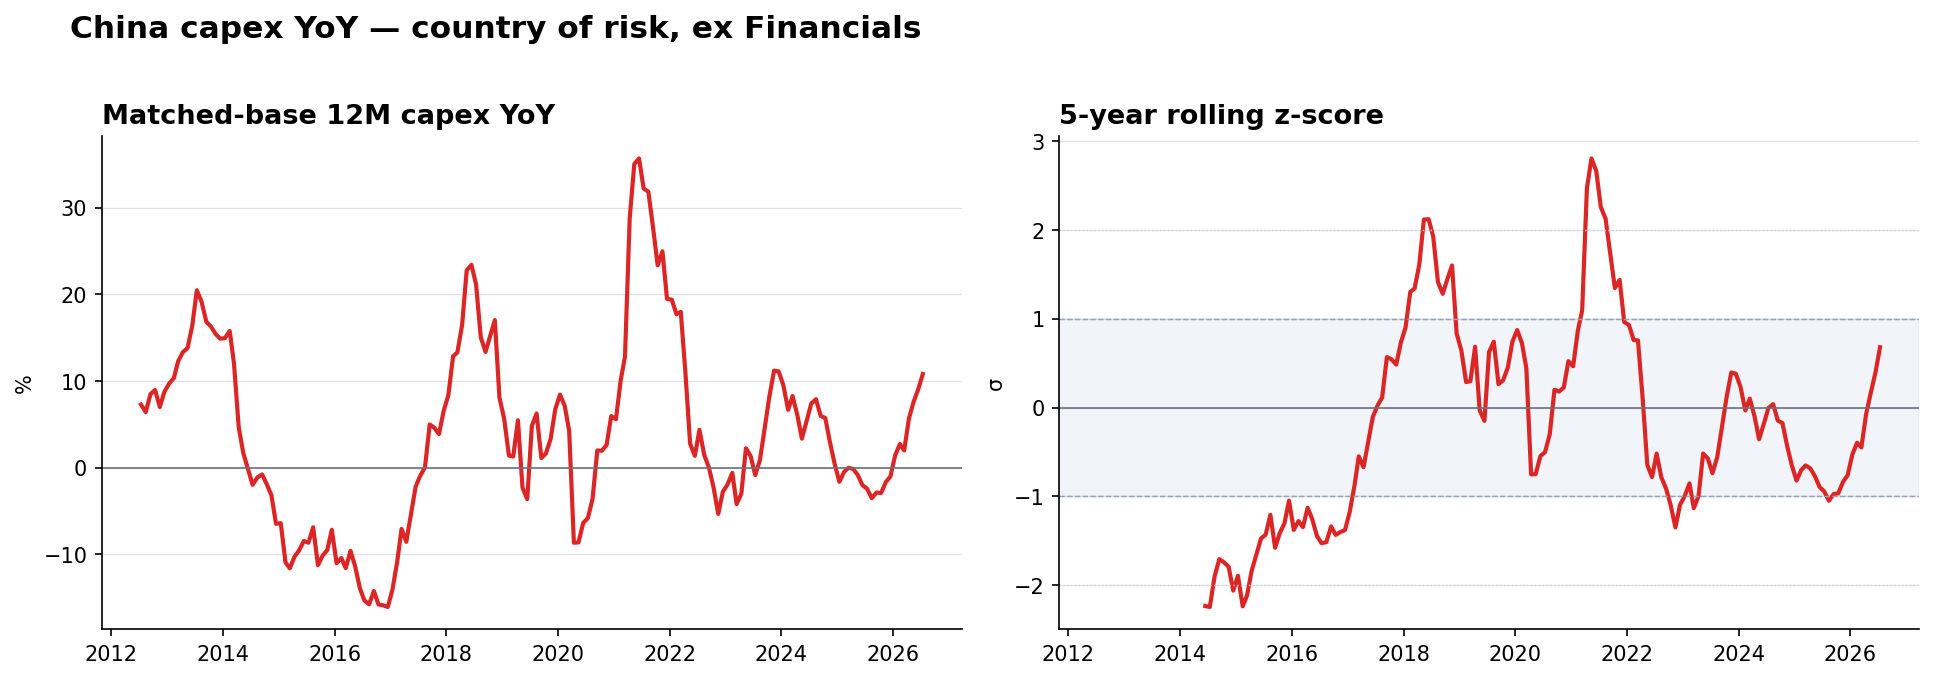
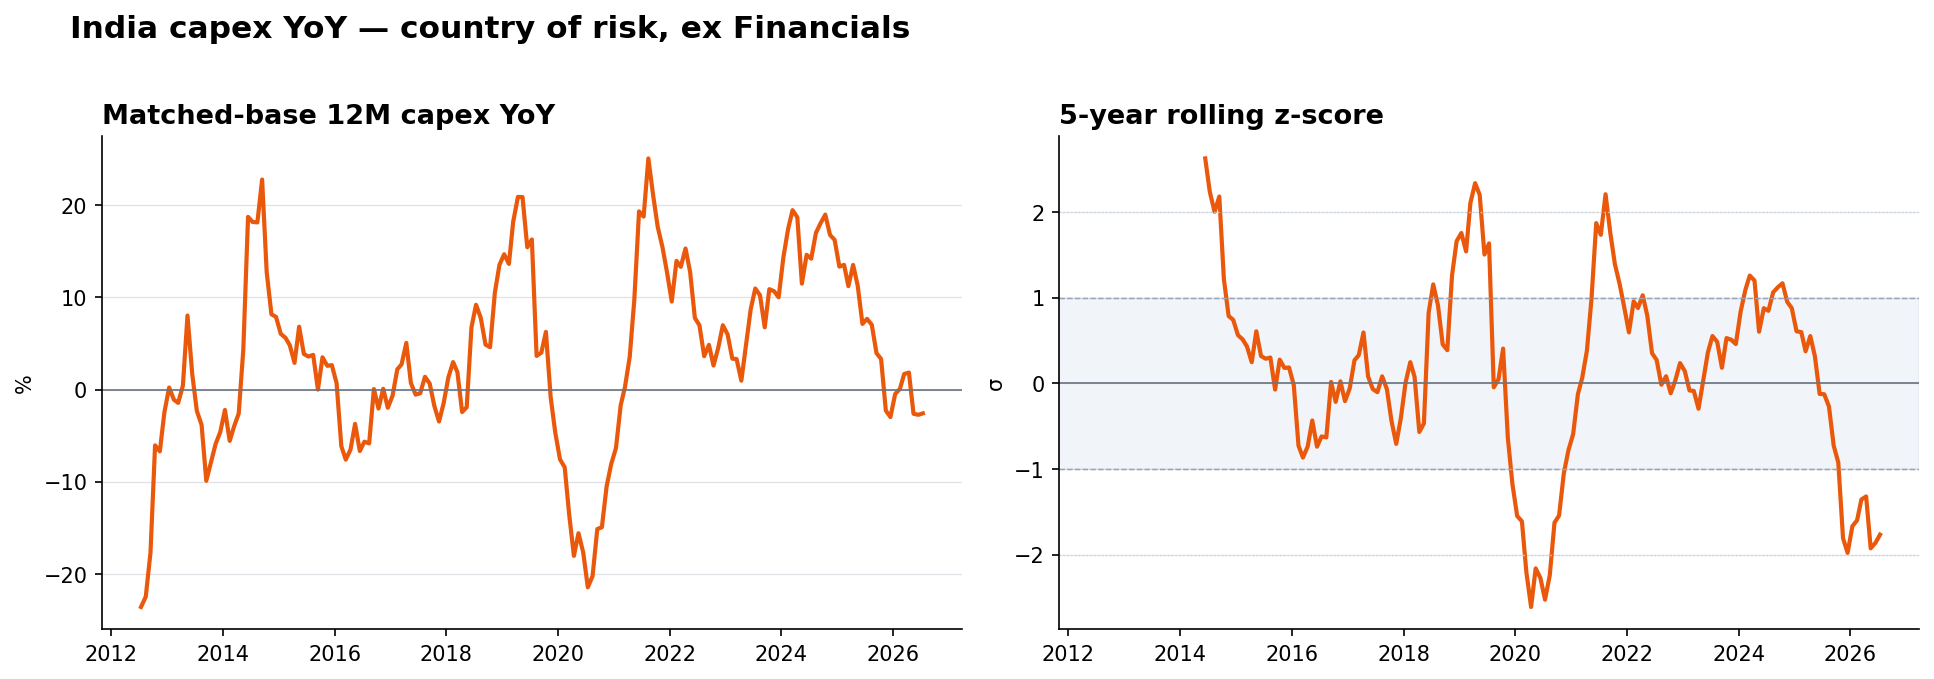
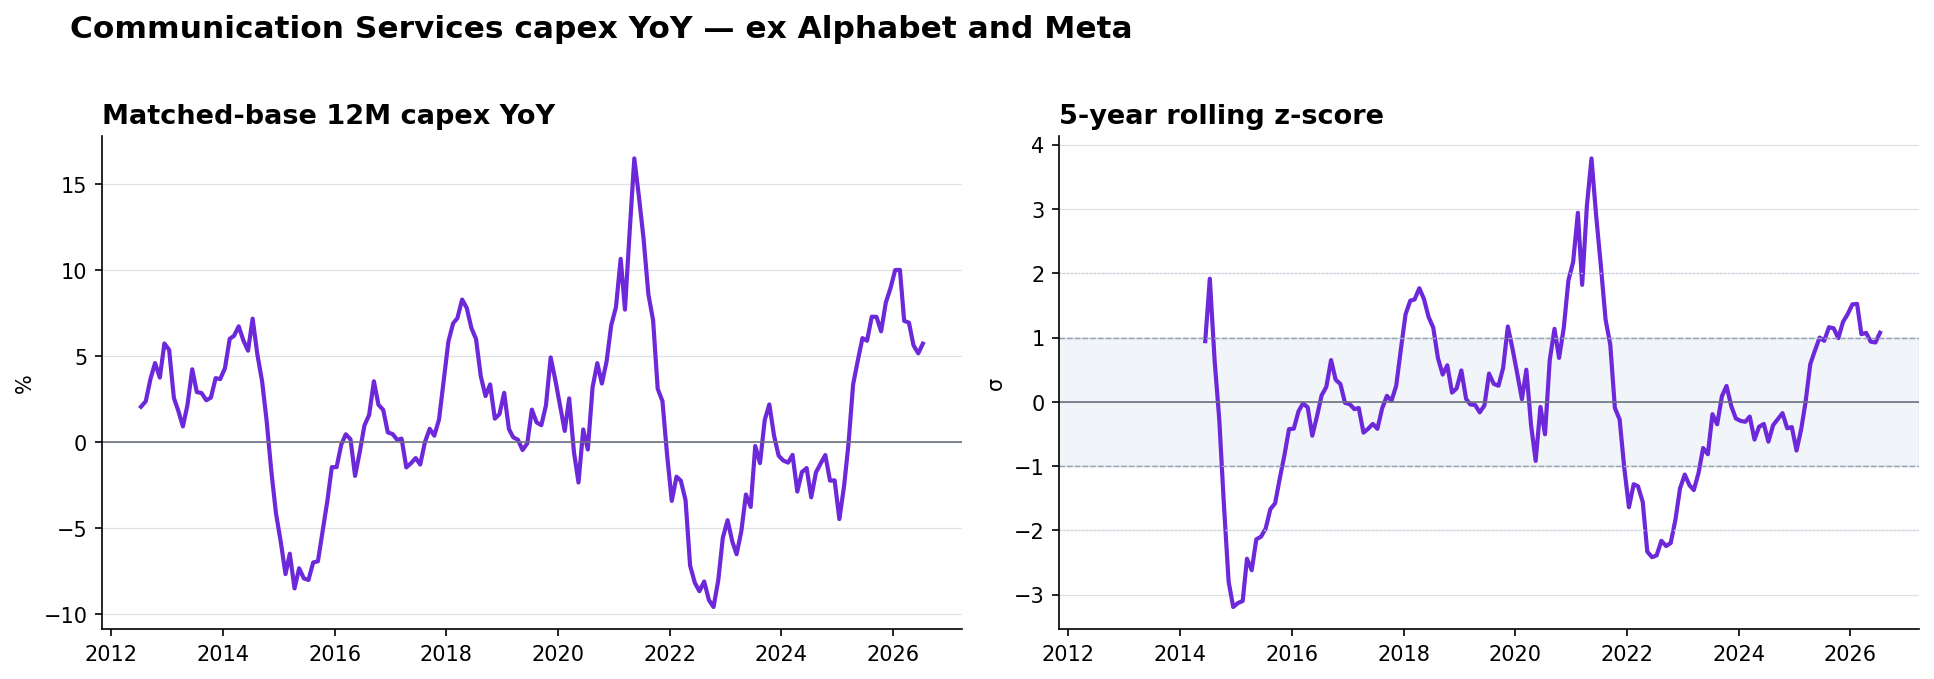
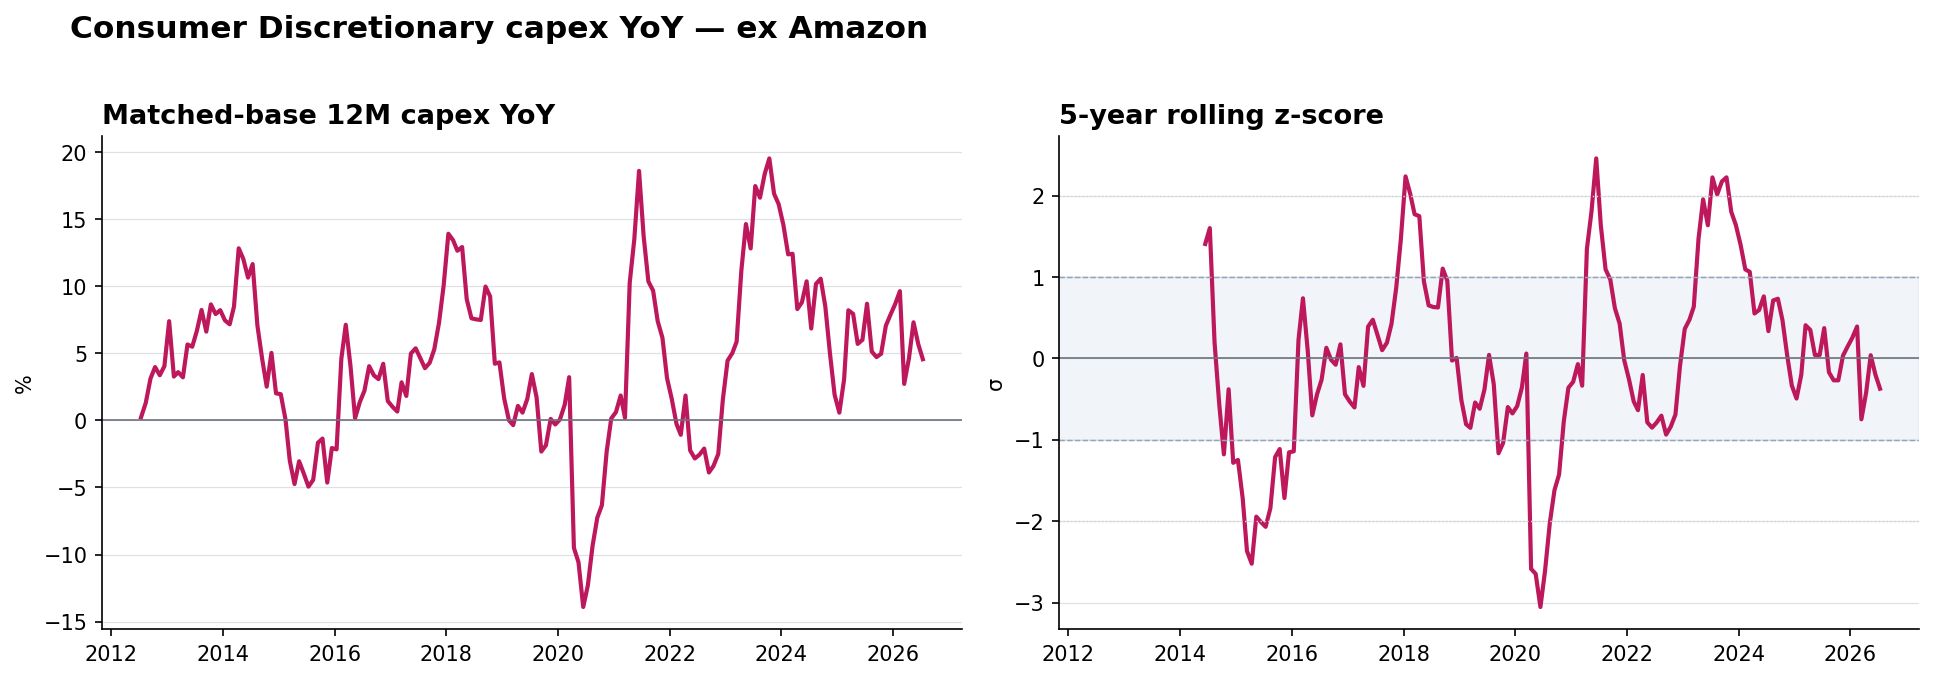
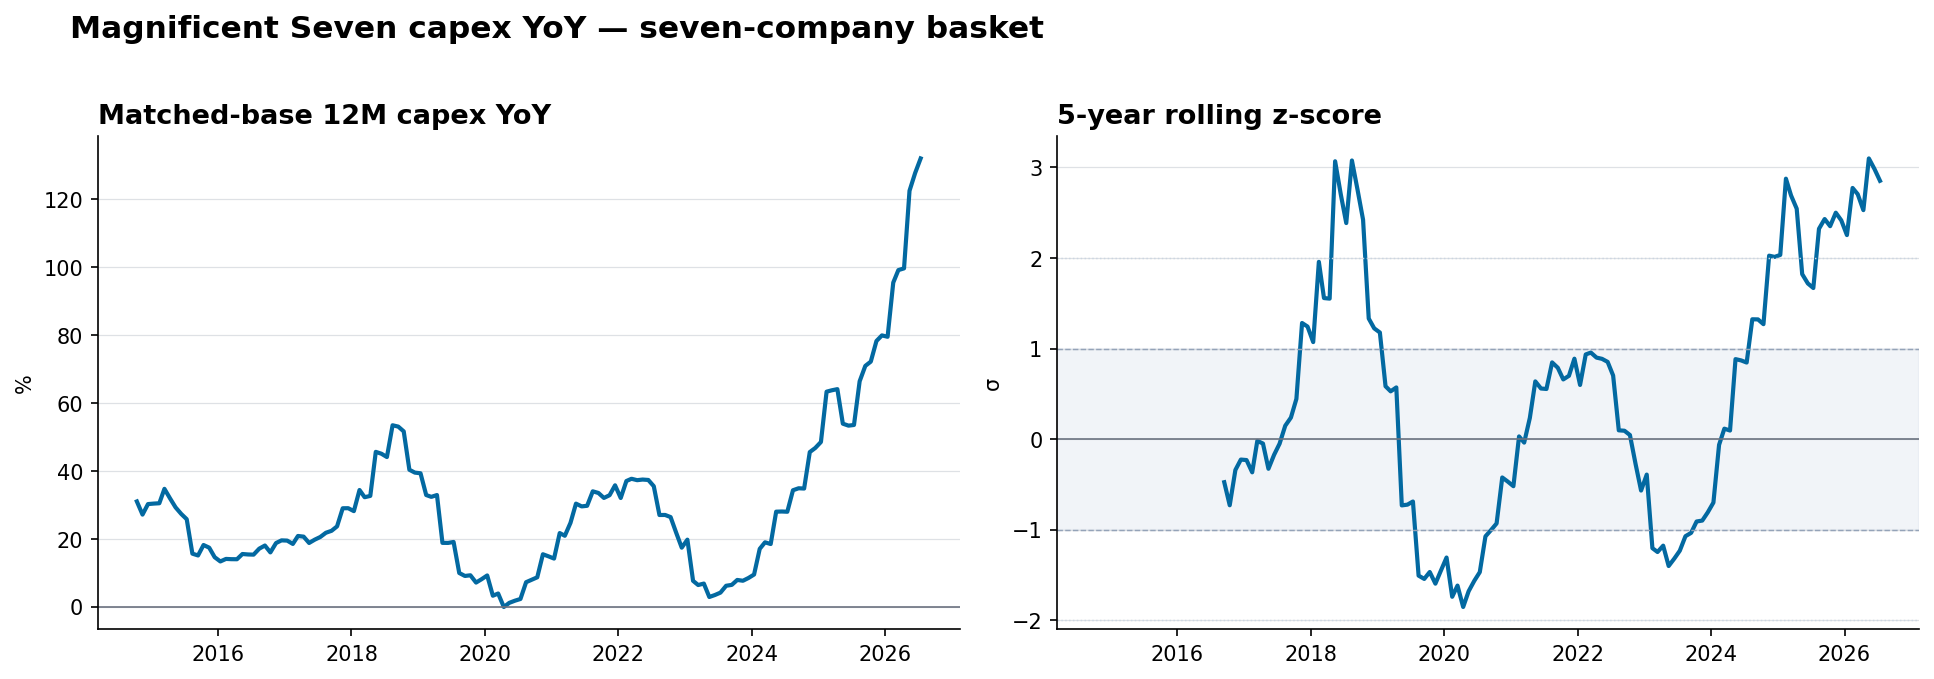
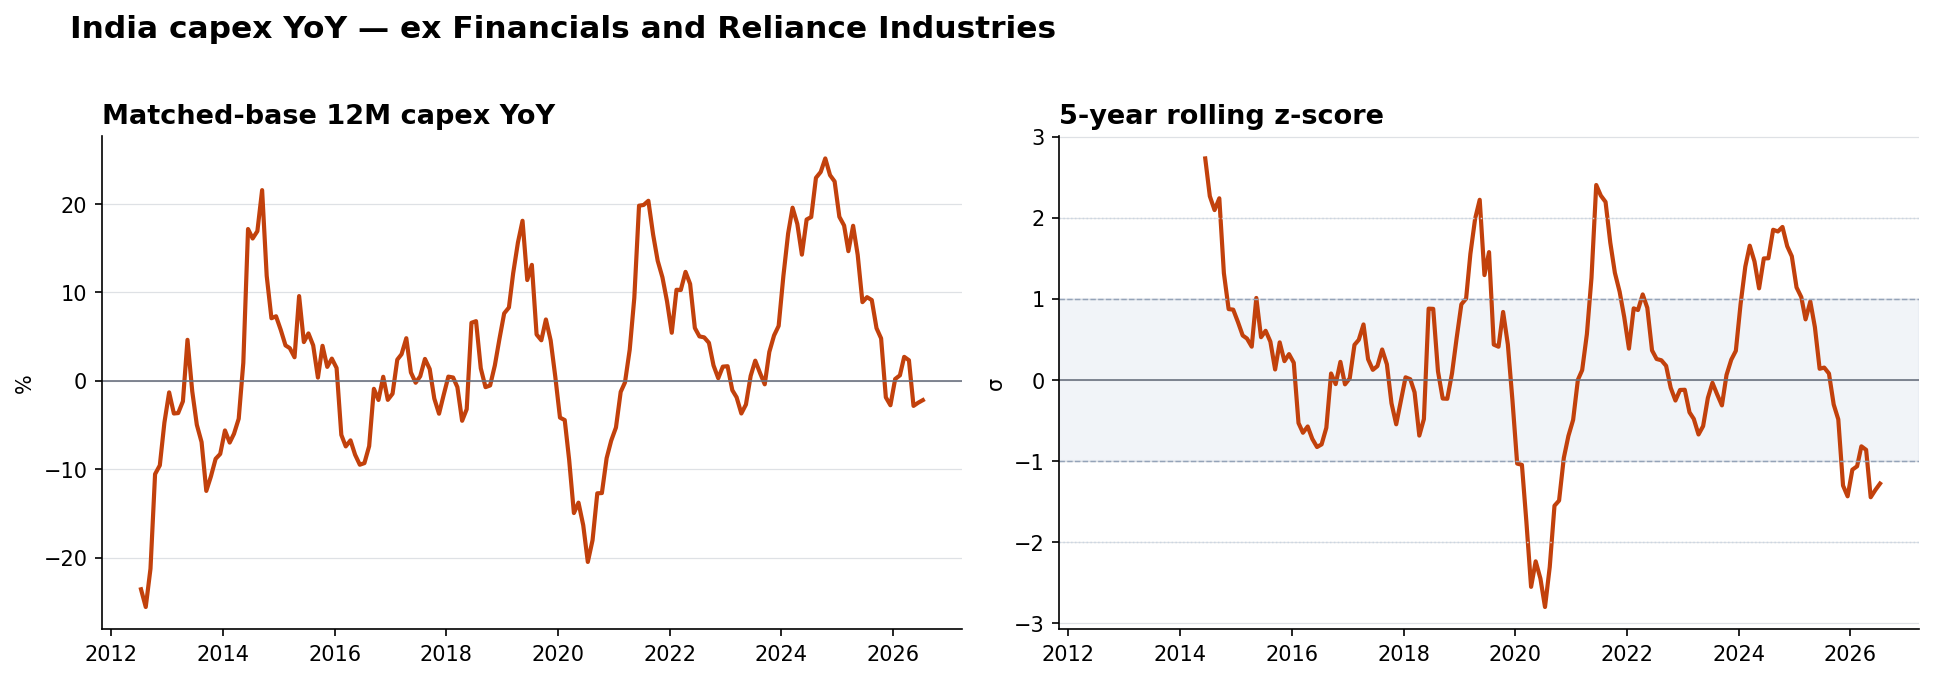
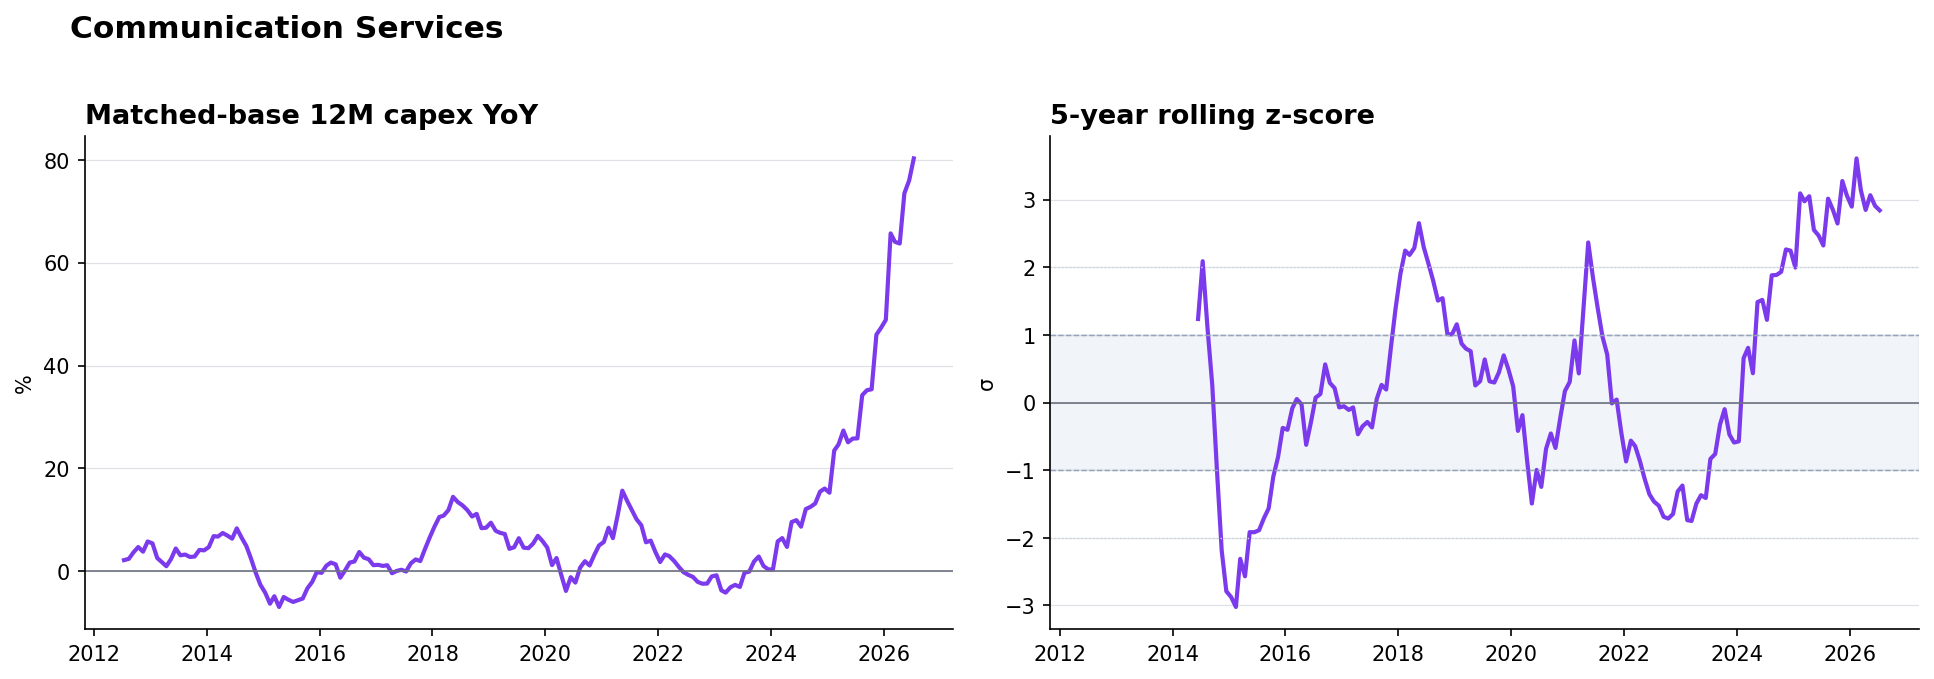
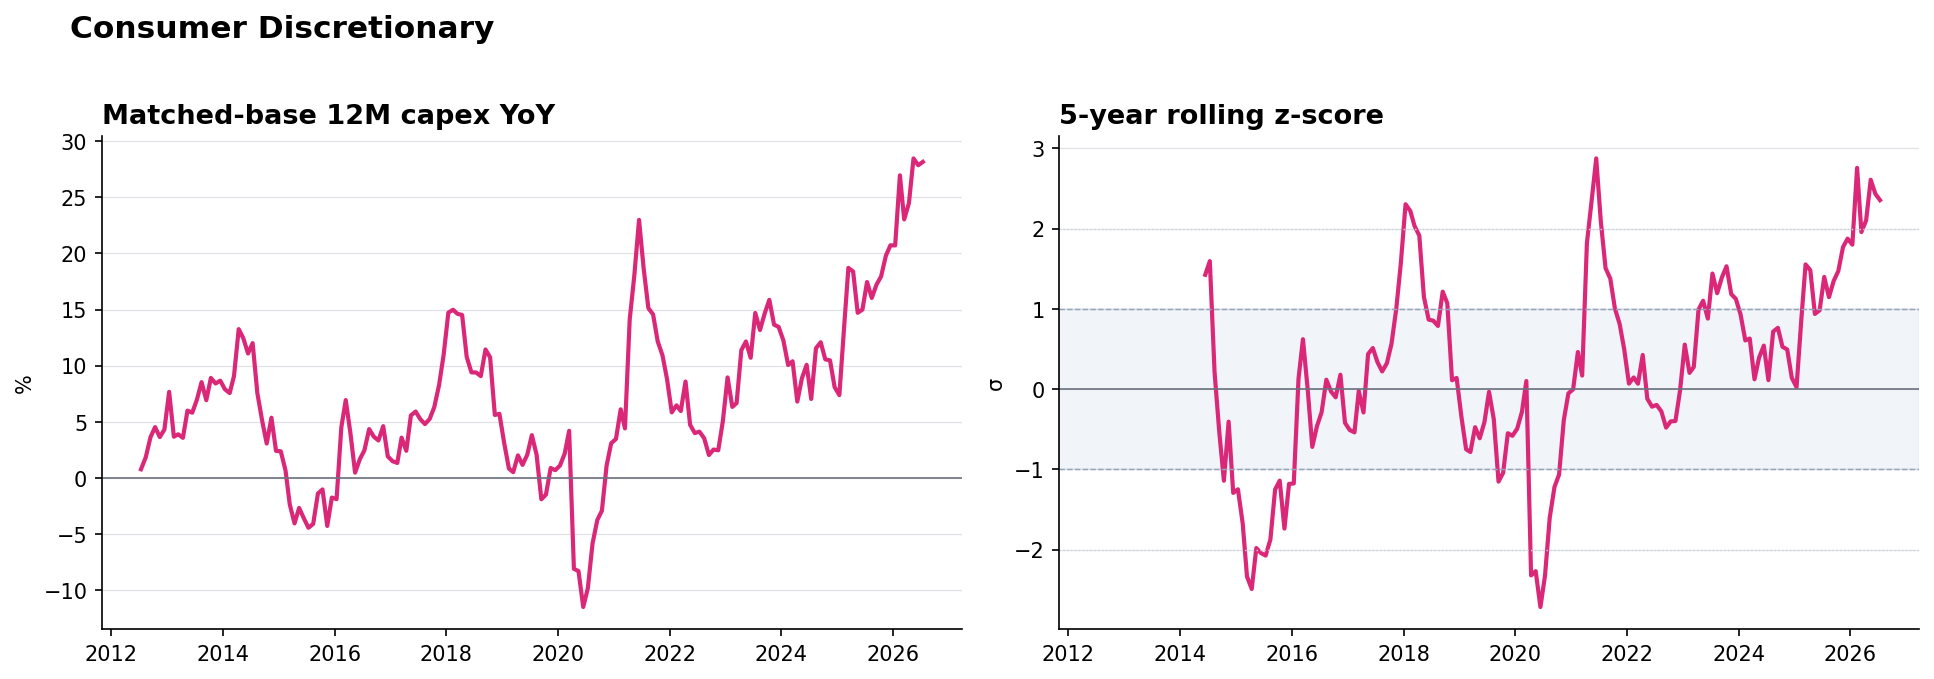
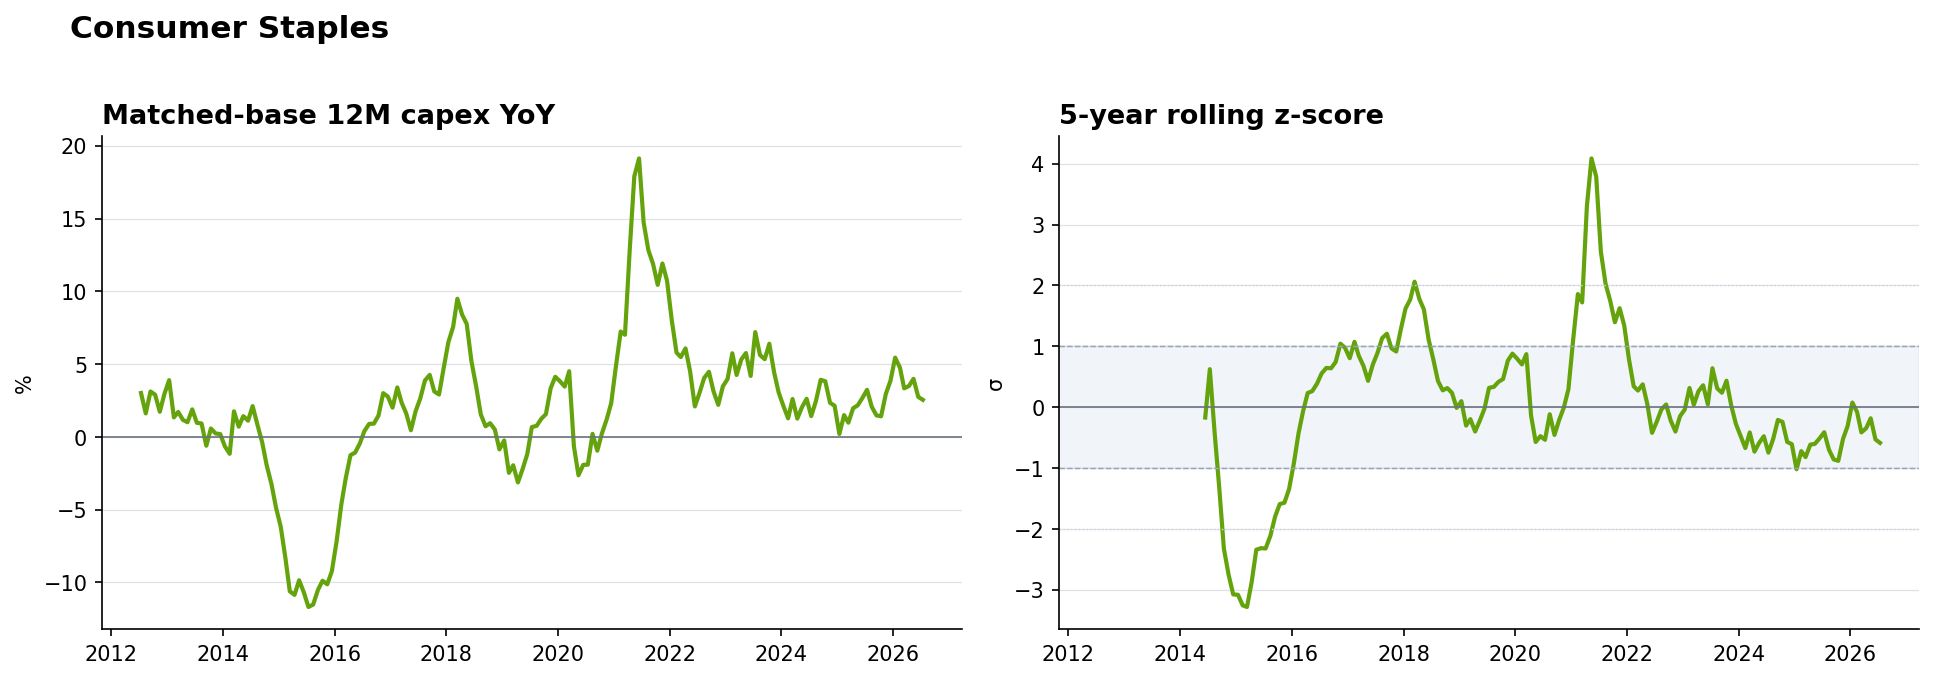
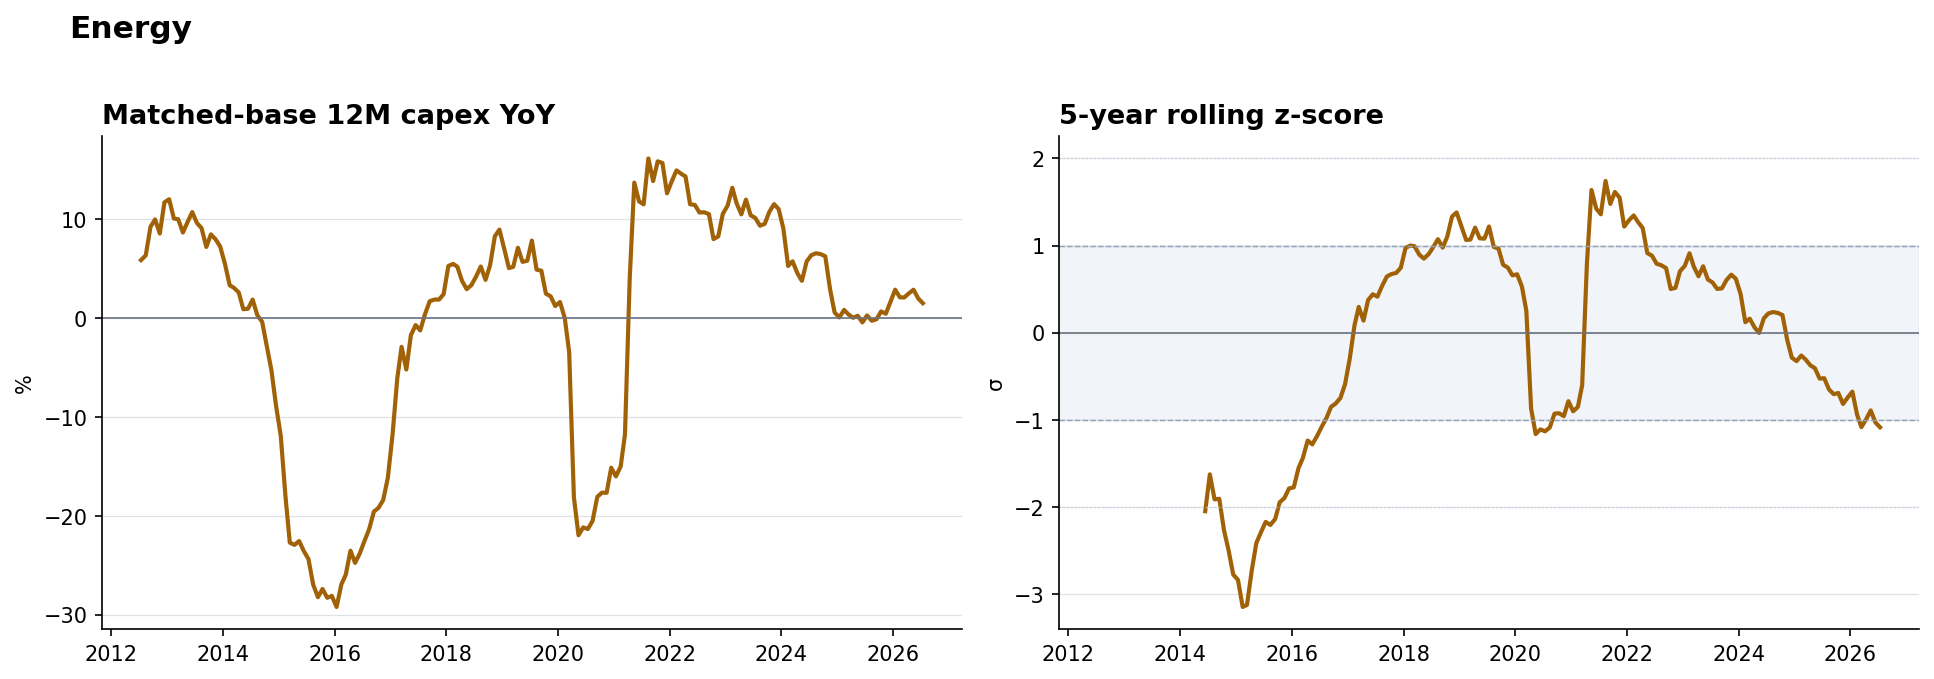
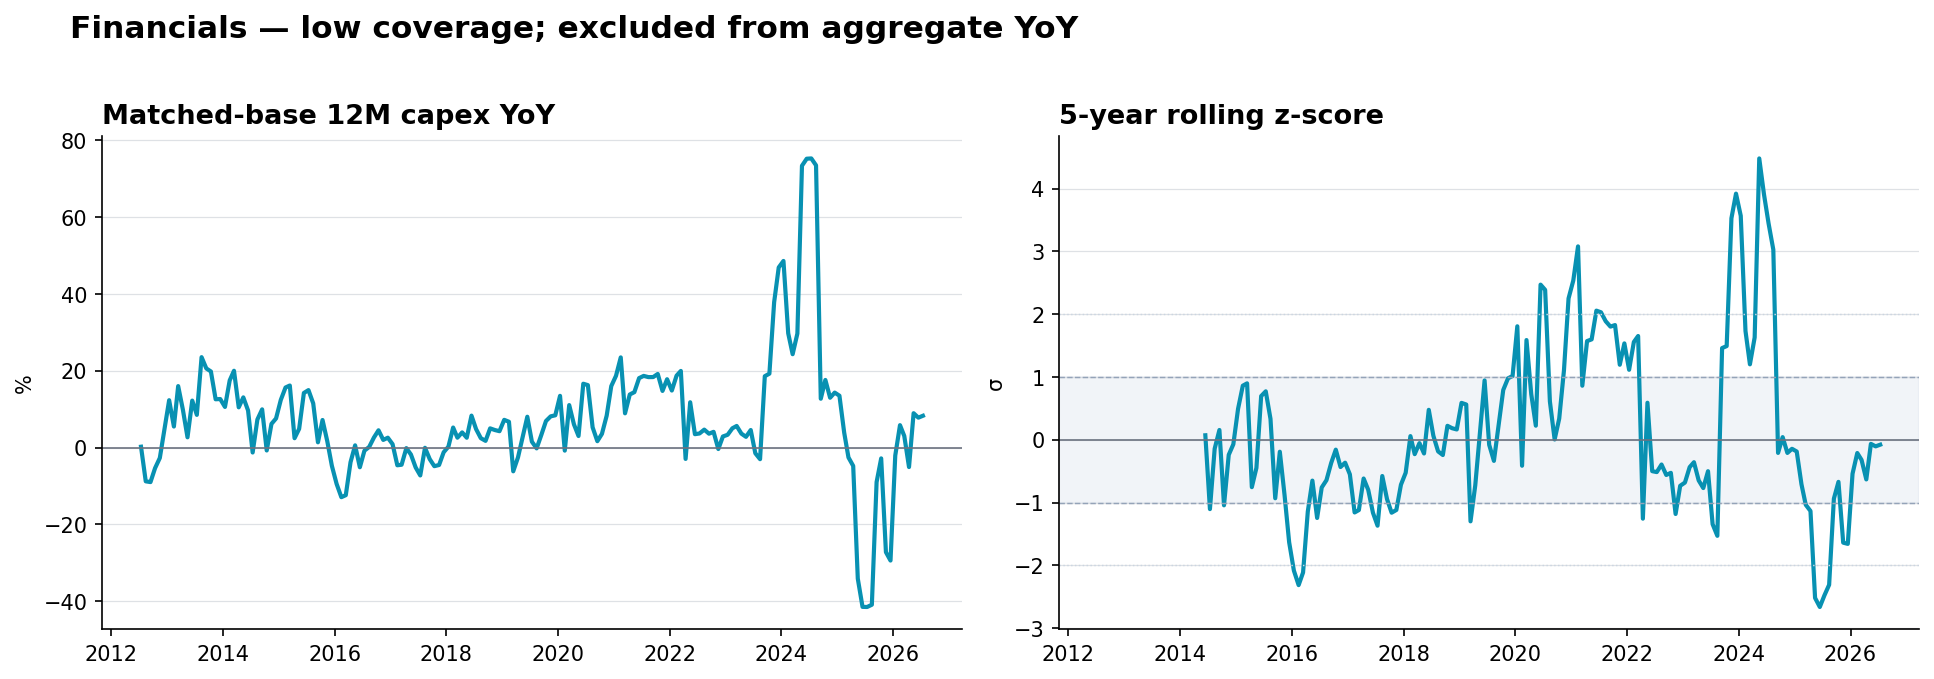
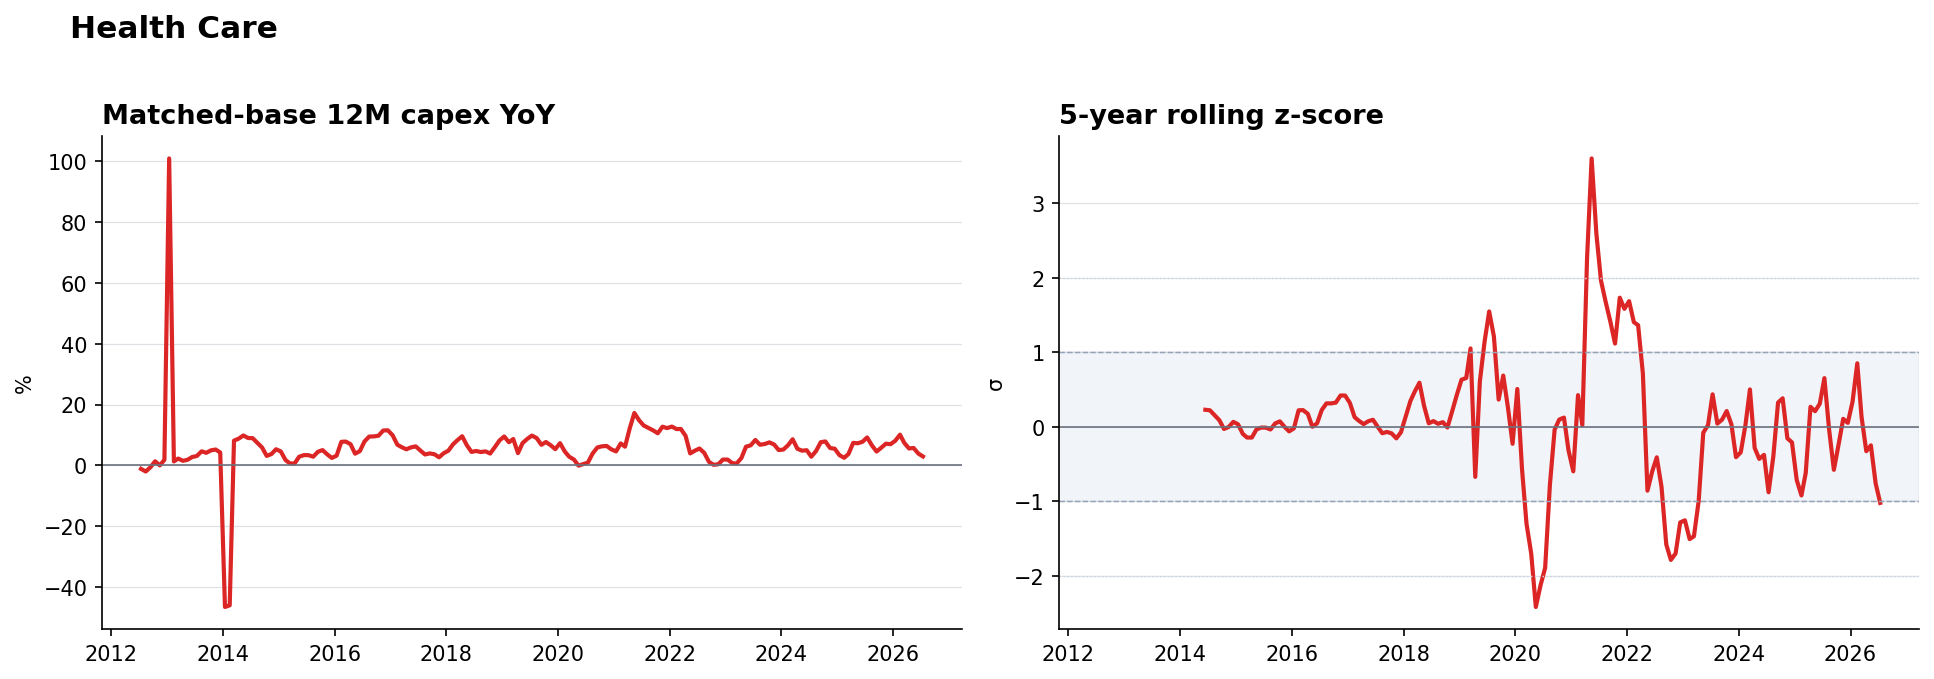
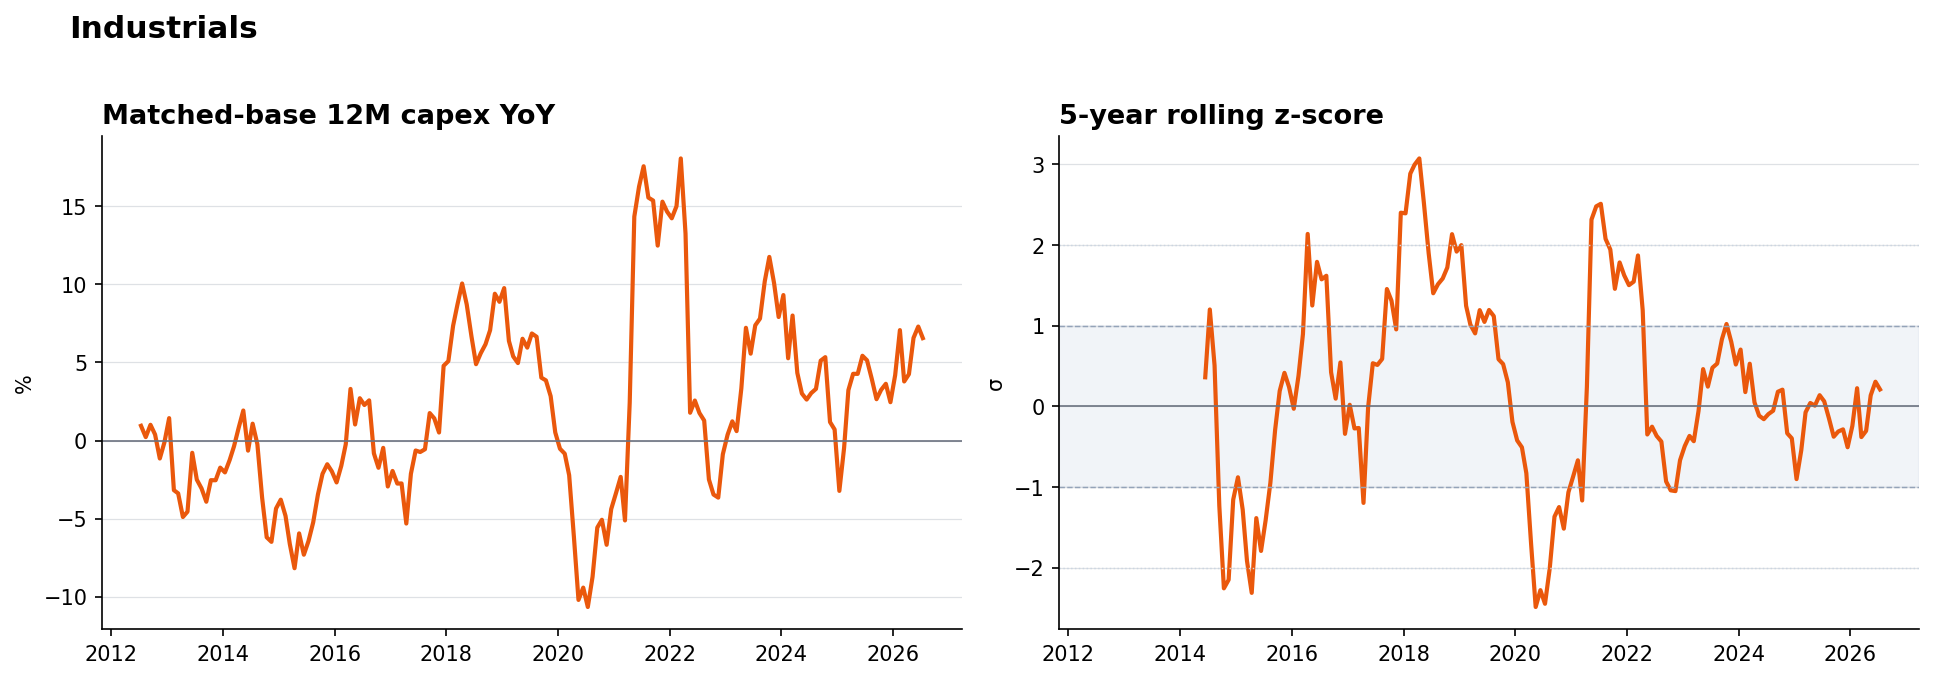
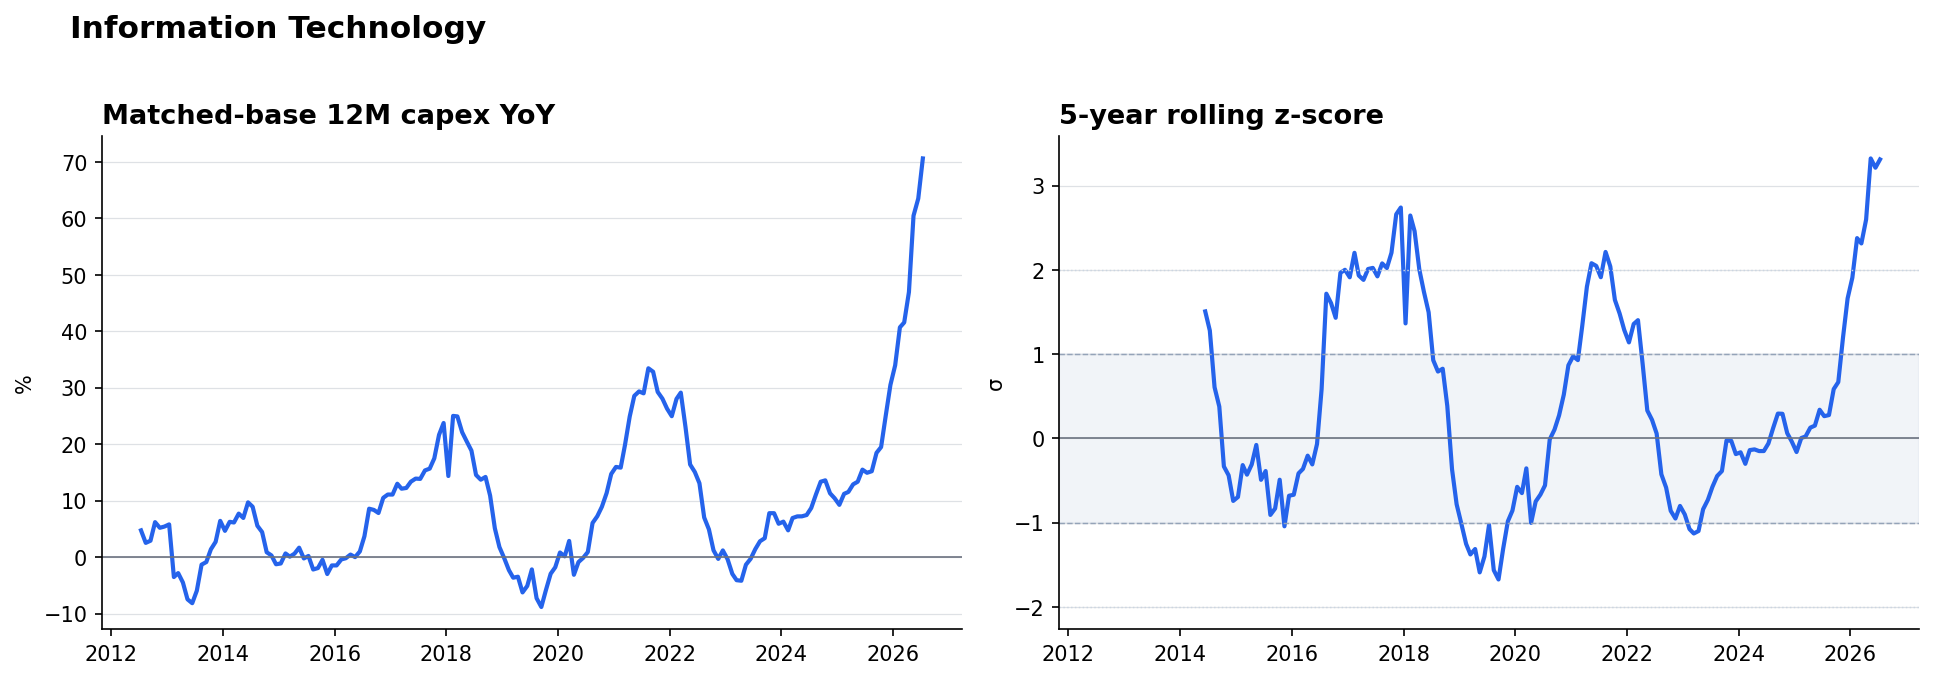
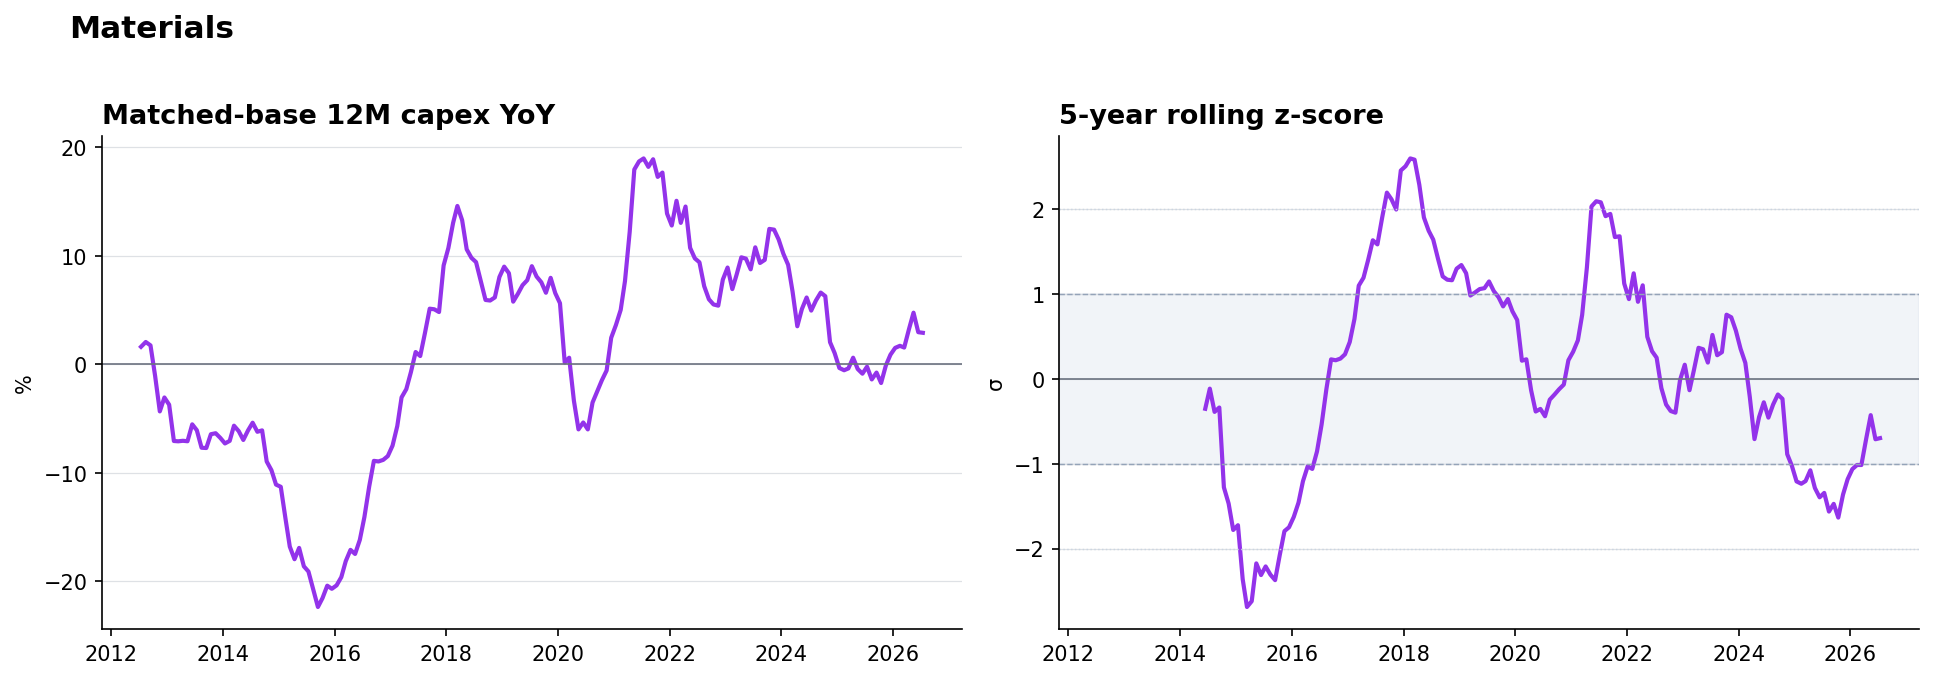
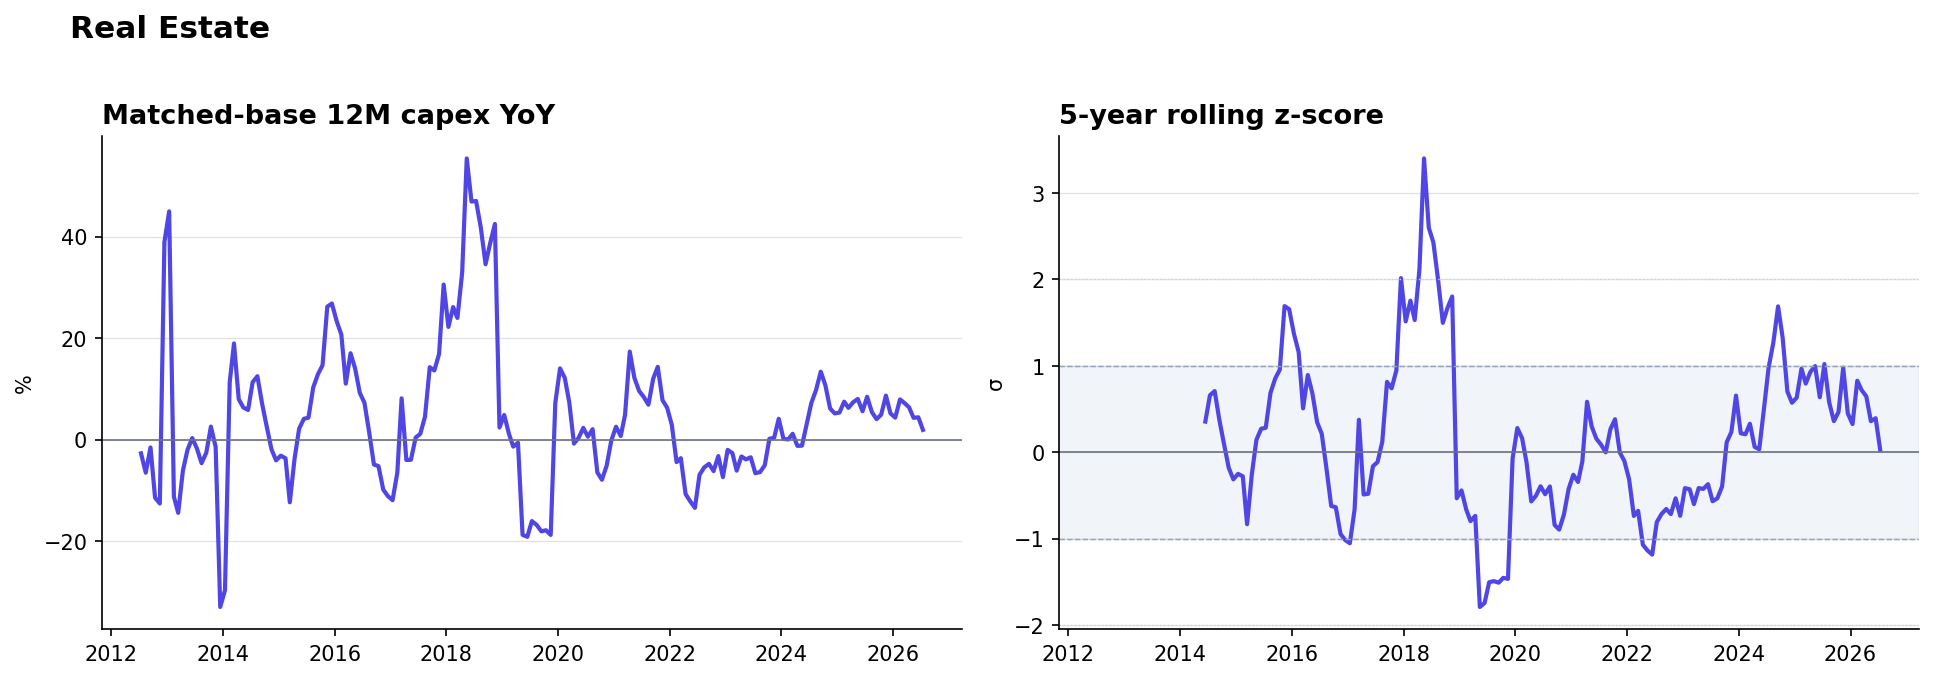
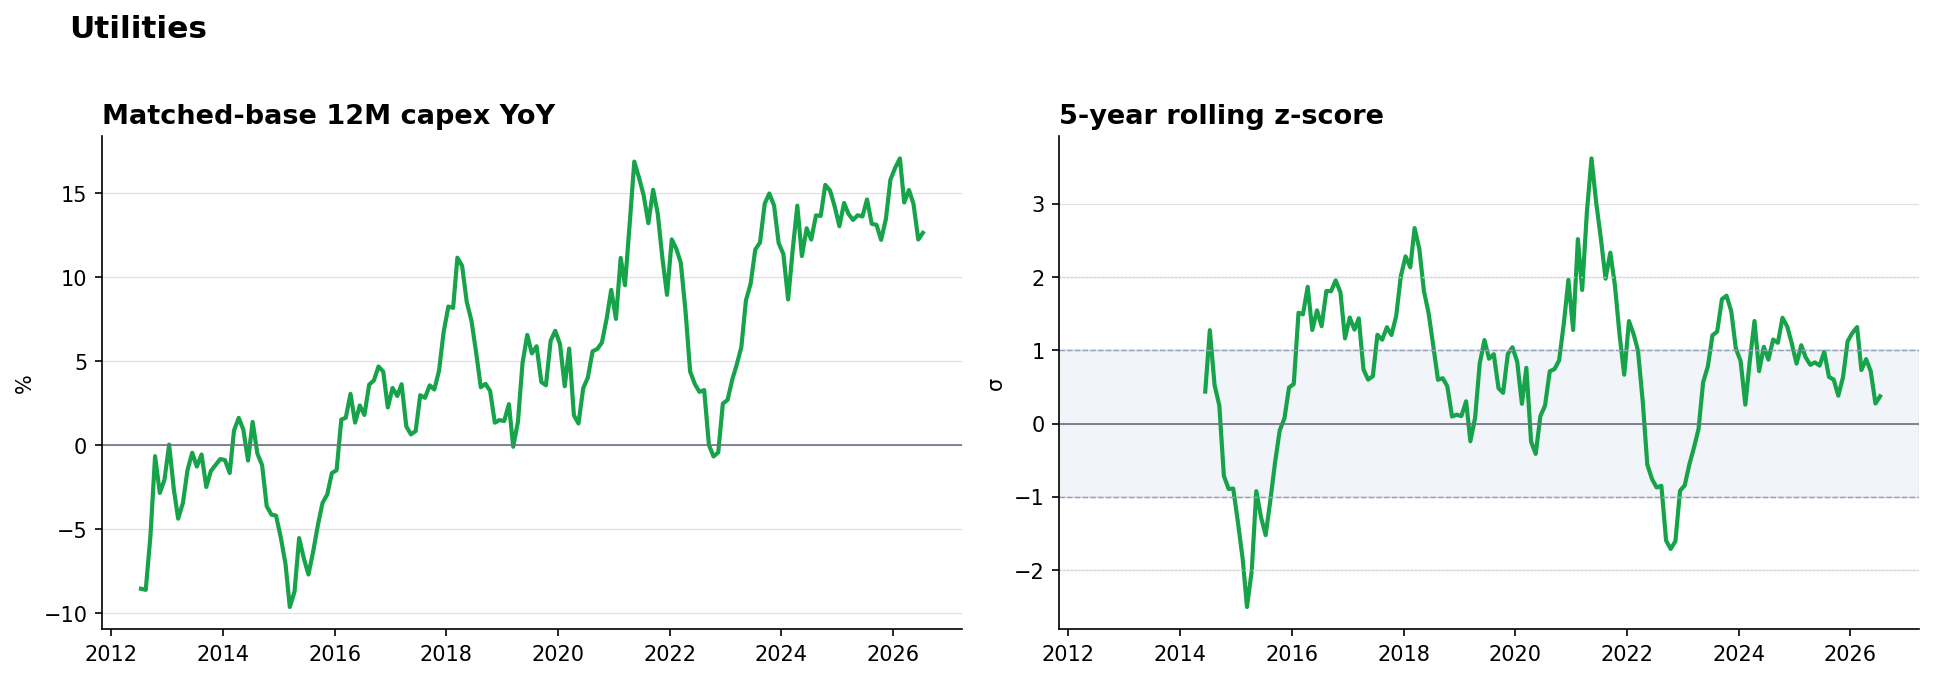
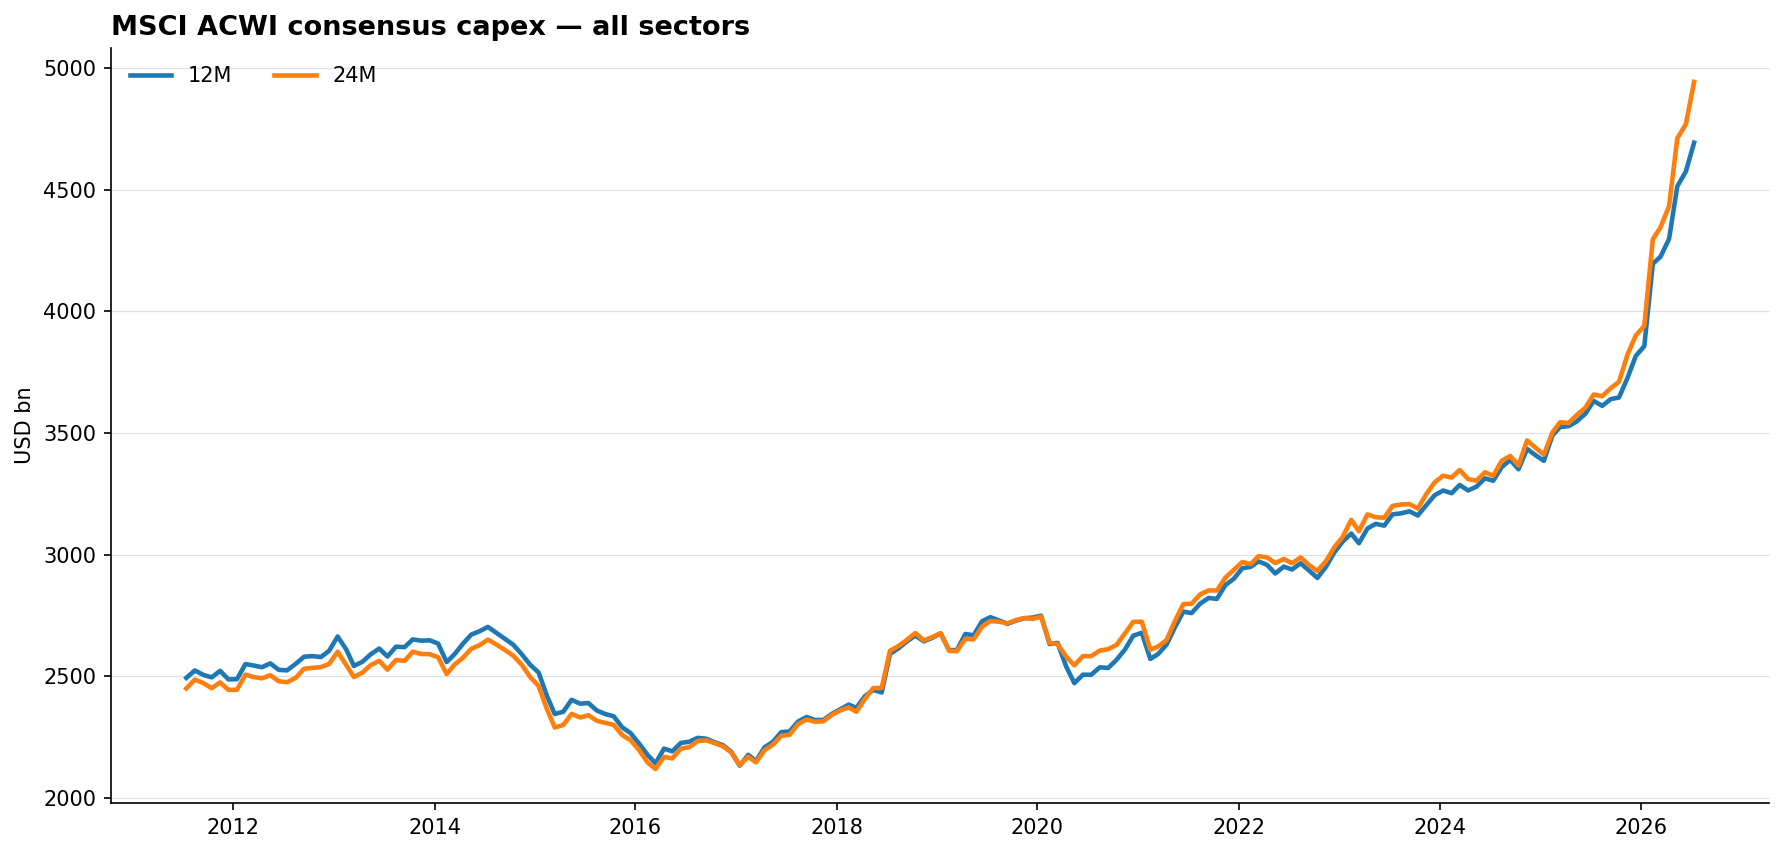
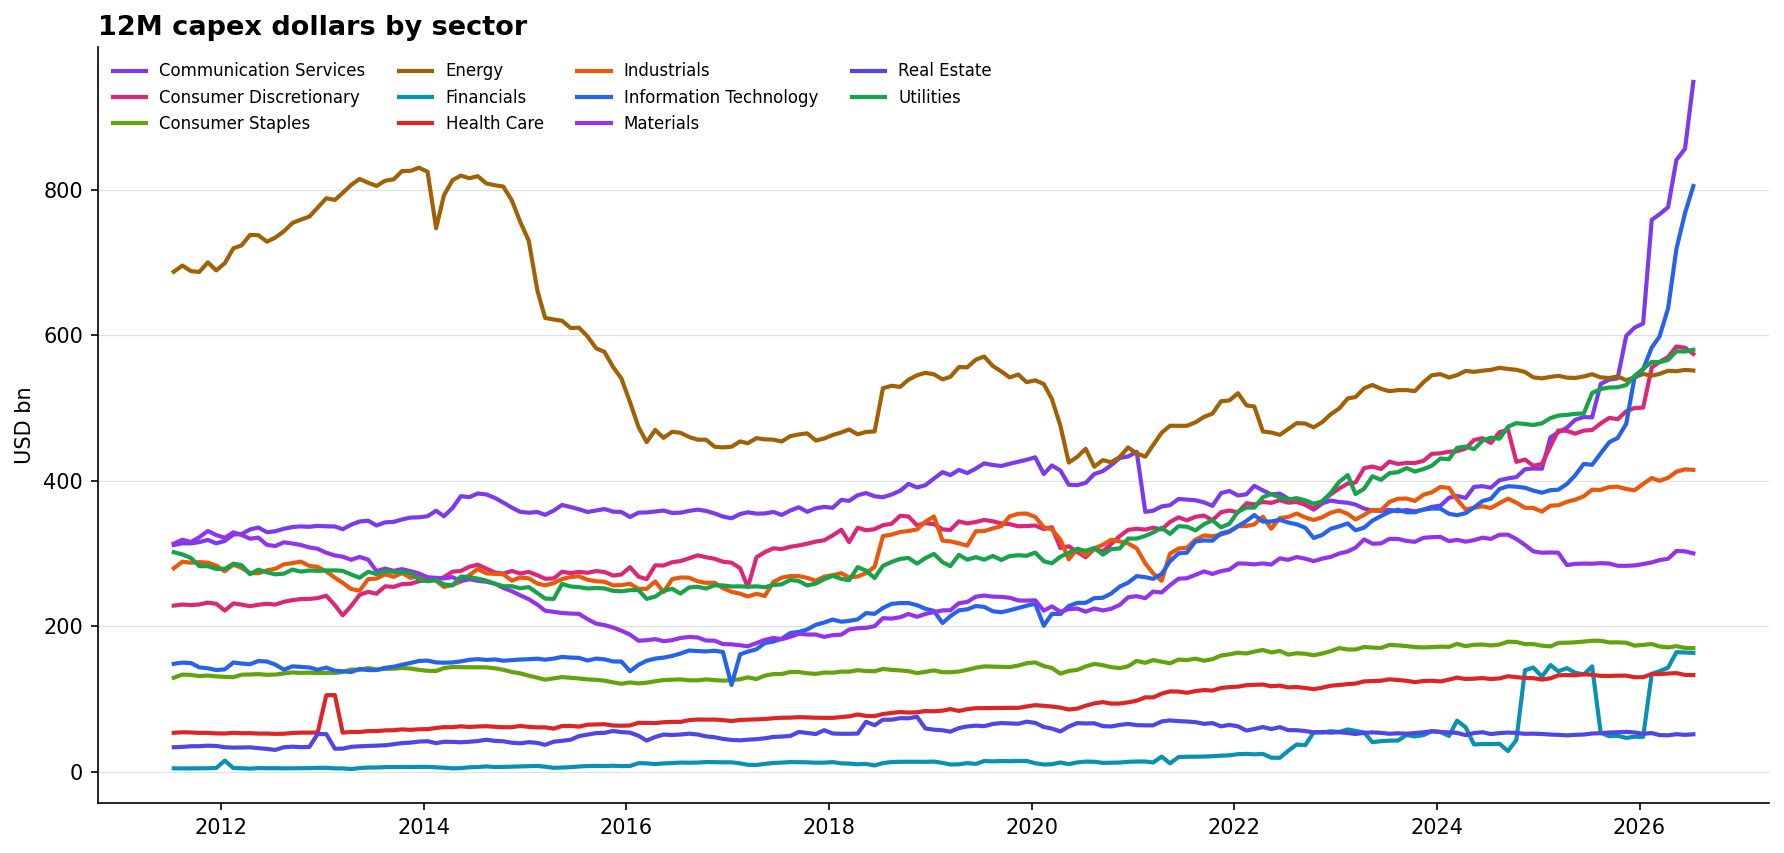
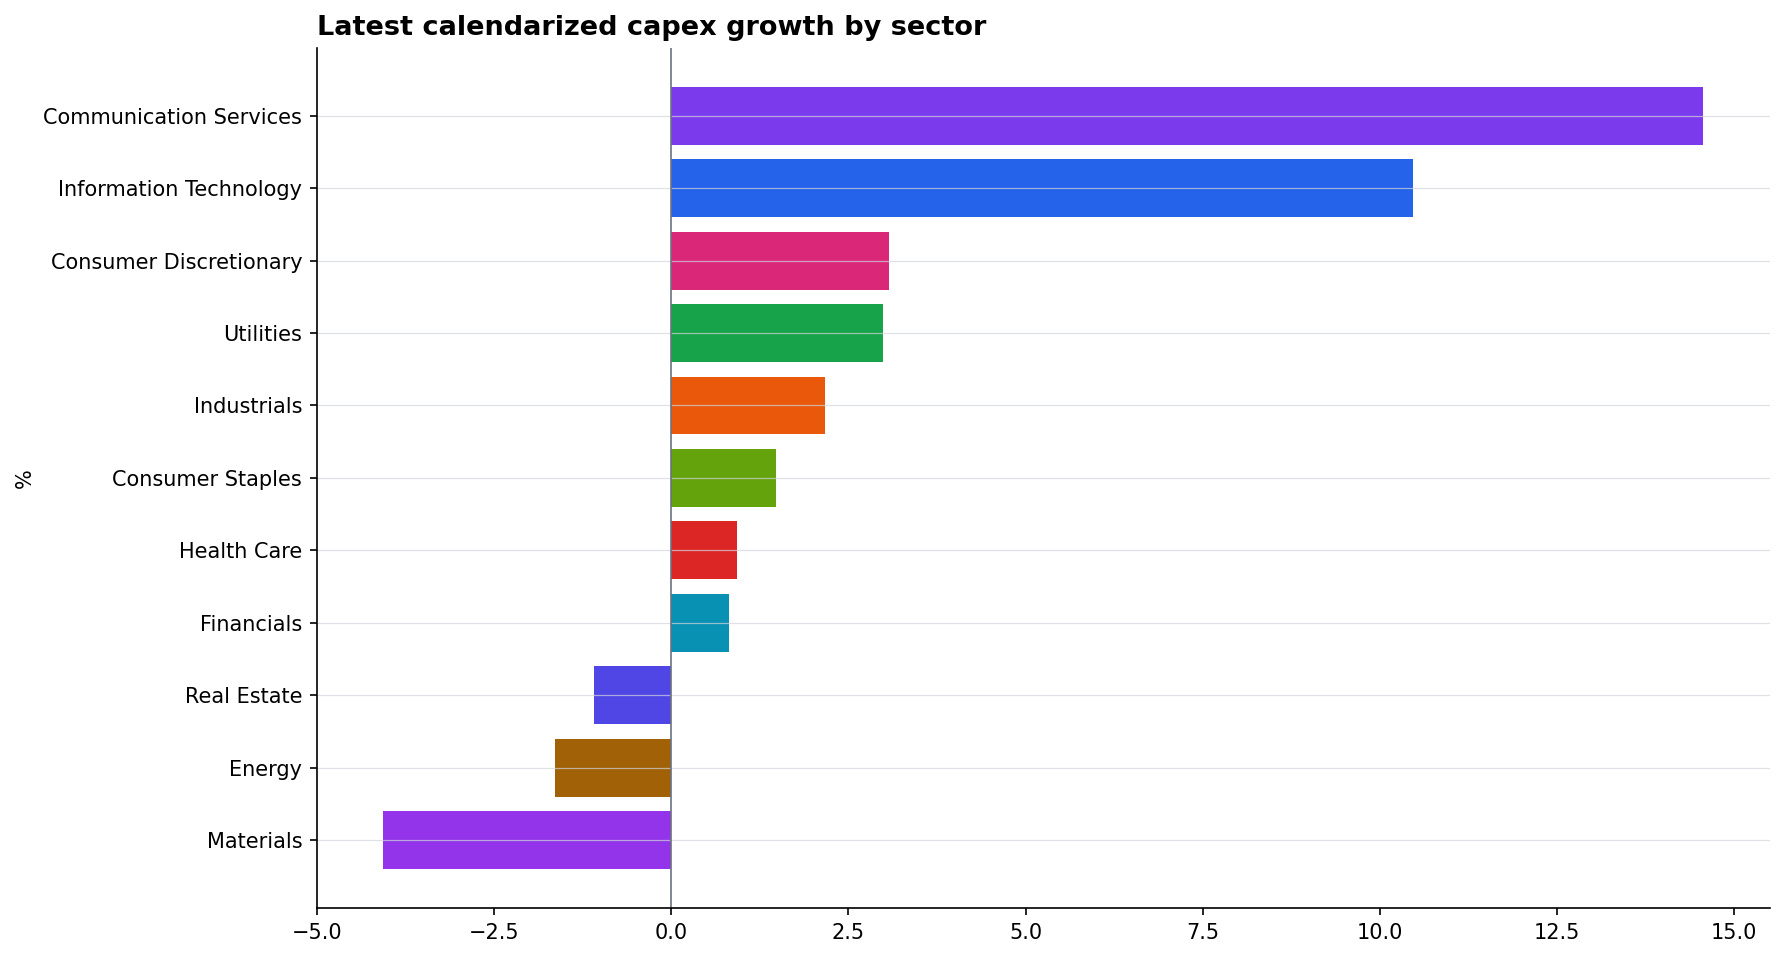
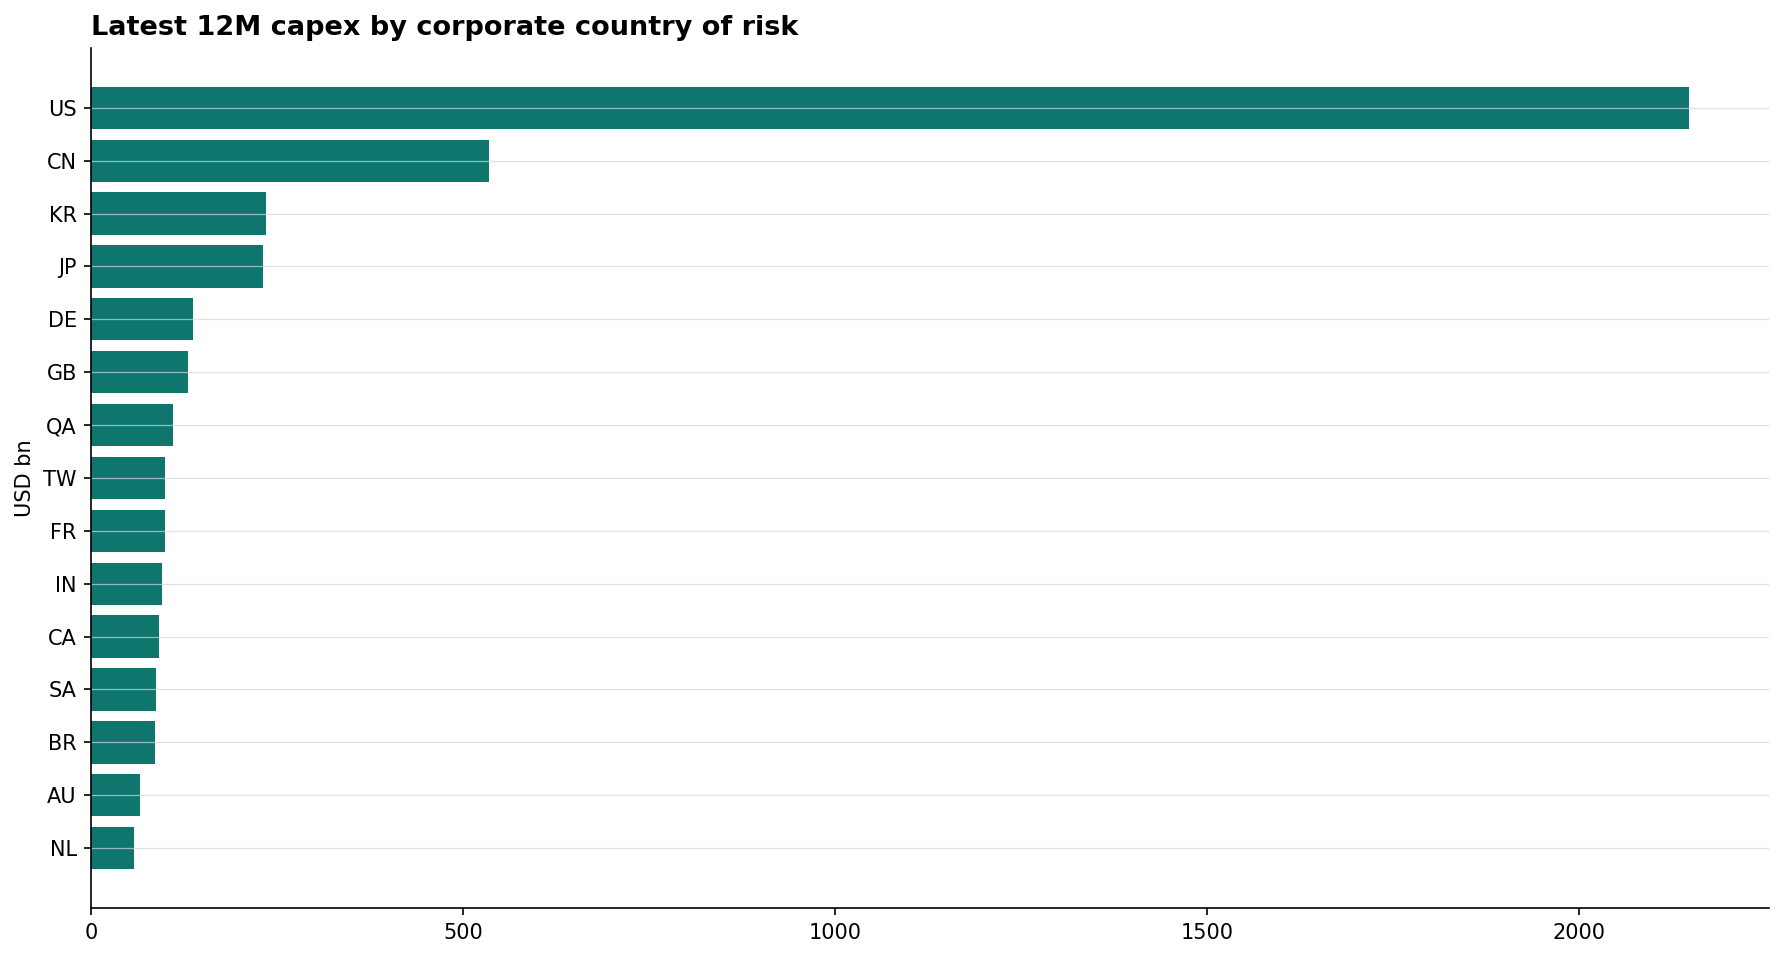
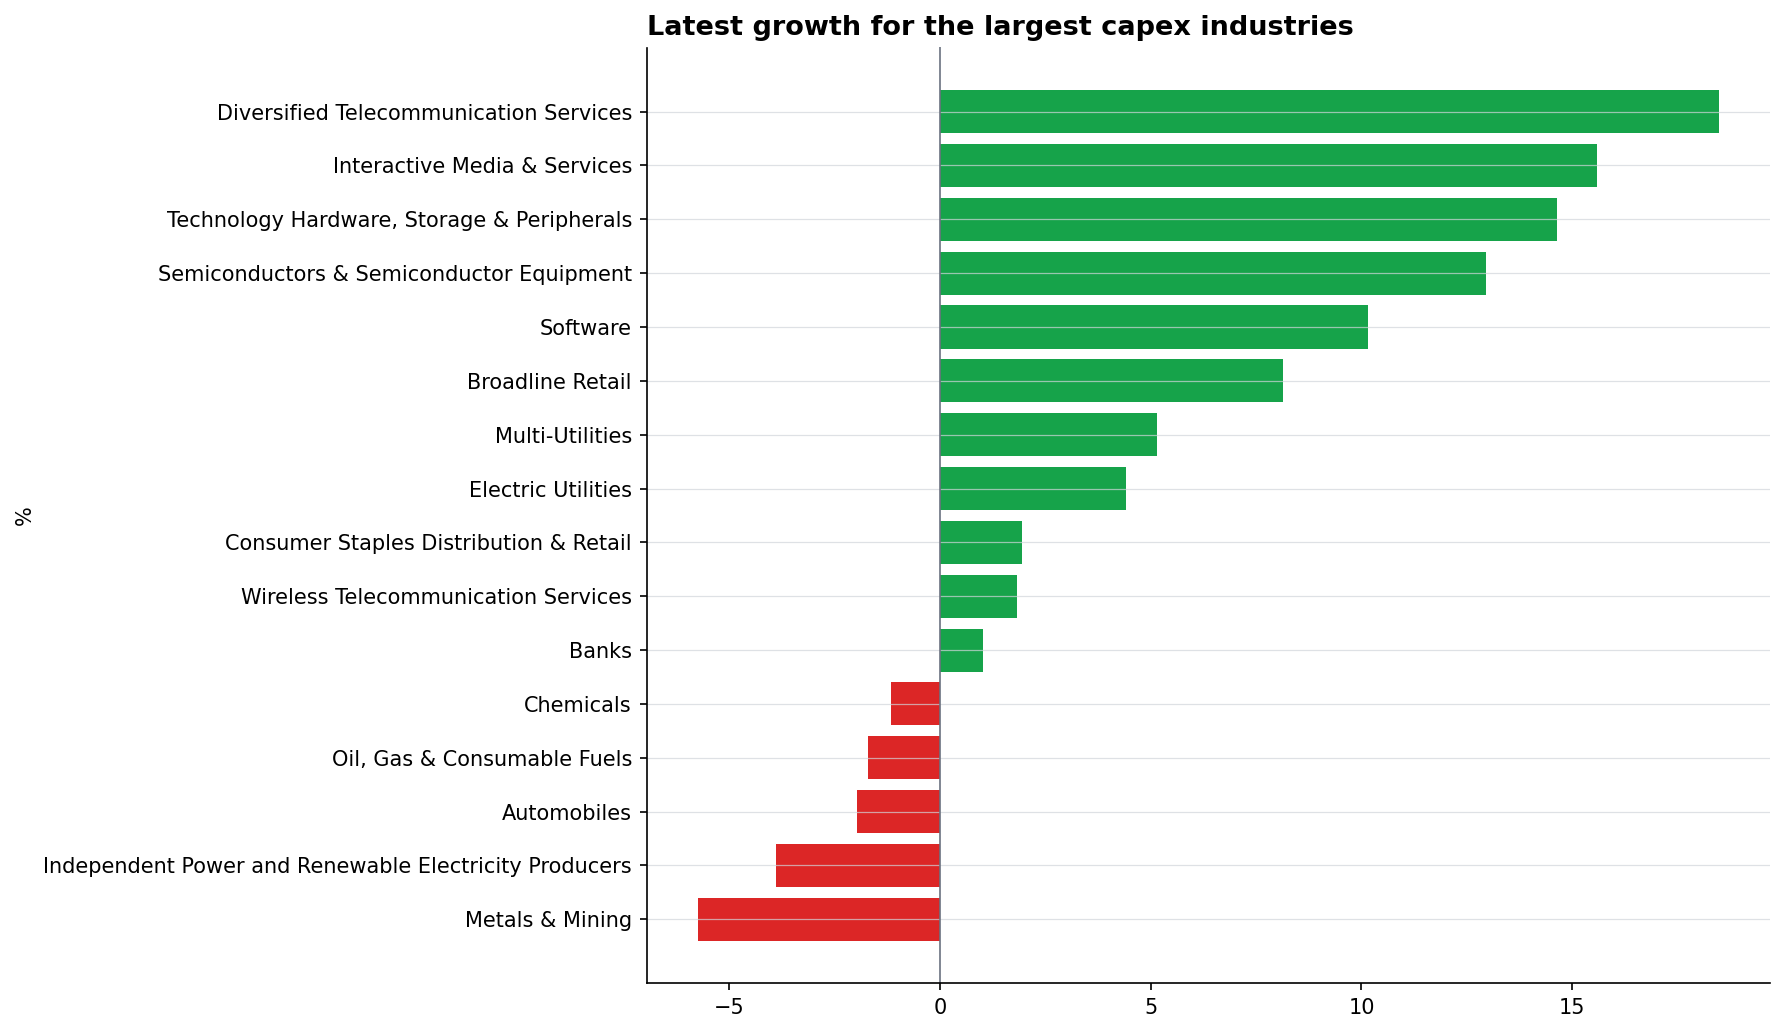
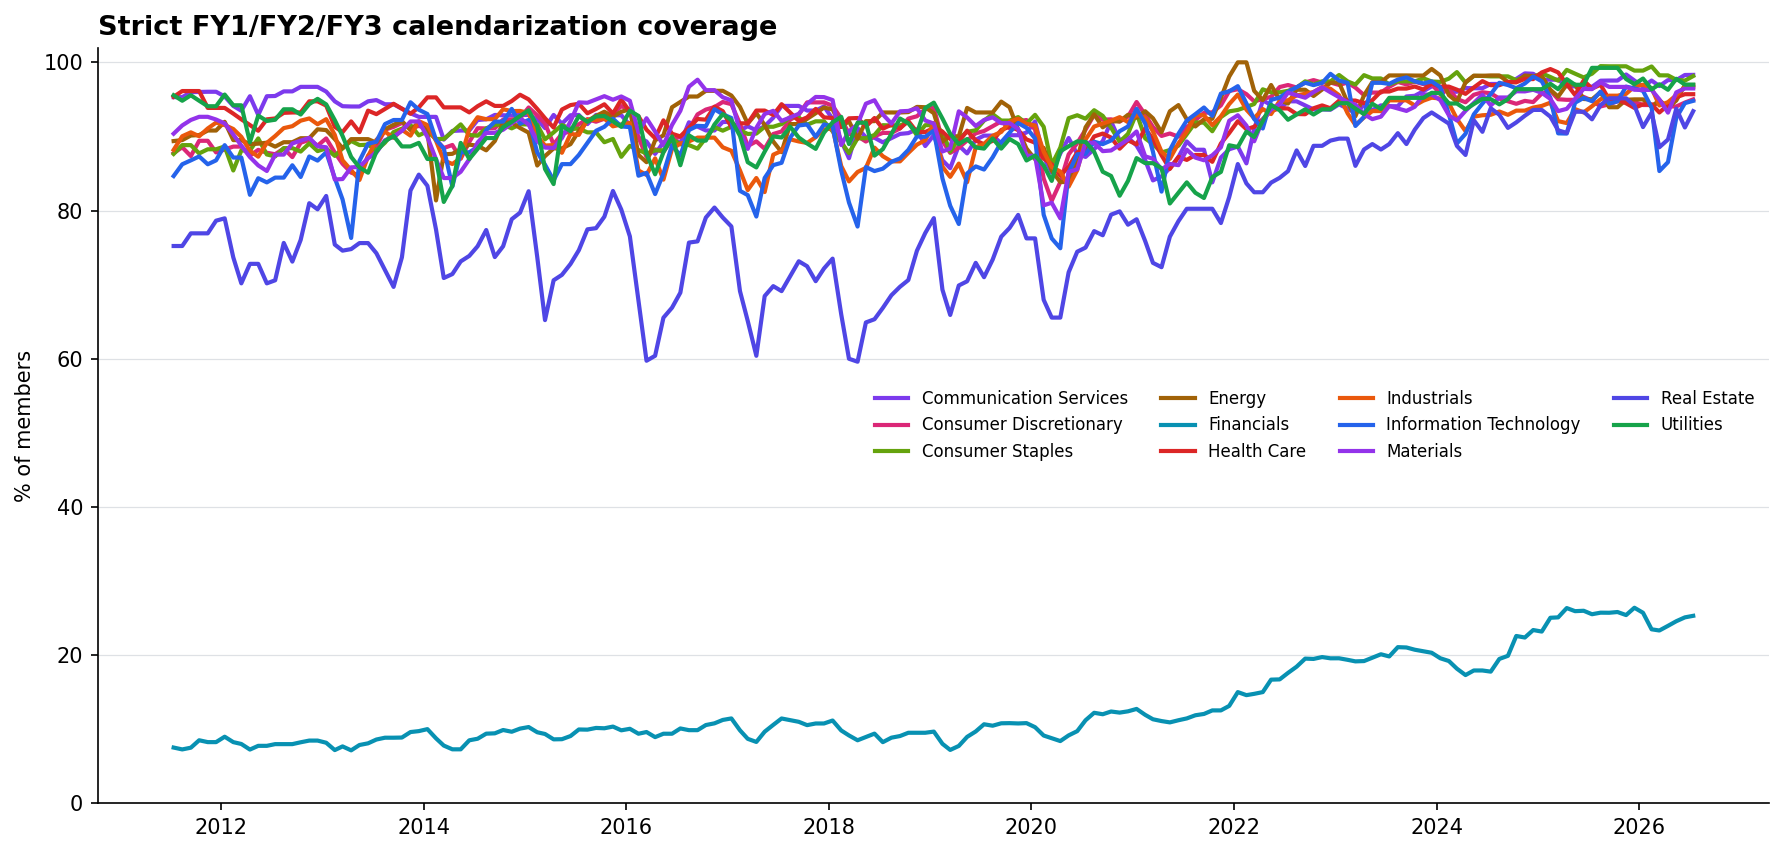
aggregate 24M consensus ÷ aggregate 12M consensus − 1. For the time series, each point uses the exact intersection of covered security IDs at that date and 12 months earlier to control basket composition; both the 24M numerator and 12M denominator are the current-date consensus estimates. The global forward-growth signal excludes Financials because latest strict sector coverage is below 60%. The hyperscaler-adjusted series additionally excludes Amazon, Alphabet (both GOOG and GOOGL security IDs), Meta, and Microsoft. Communication Services ex Alphabet/Meta removes GOOG, GOOGL, and META; Consumer Discretionary ex Amazon removes AMZN. The Magnificent Seven basket uses AAPL, AMZN, GOOGL, META, MSFT, NVDA, and TSLA, with one Alphabet share class to avoid double-counting the company; it starts in October 2014, the first matched date with all seven representatives. China and India are Bloomberg corporate country-of-risk aggregates and exclude Financials; the India ex-Reliance series additionally removes Reliance Industries (RELIANCE IN Equity). Country aggregates do not indicate the physical destination of investment. Z-scores use a trailing 60-month window with at least 24 observations, so they do not use future data. Large persistent changes are retained; only isolated reverting scale anomalies are excluded.Universe counts. The latest point-in-time ACWI panel contains 2,460 constituent security IDs. Of these, 2,027 have valid FY1-FY3 estimates and period ends for strict calendarization. The broader 5,245 count in the run manifest is the union of historical member IDs encountered across the full 15-year window, not the number in the index on one date.
Classification limitation. Index membership is point-in-time. GICS and country metadata are current classifications joined to historical members by security ID, so historical reclassifications are not reconstructed.
Build quality: 77.4% of membership rows are strictly calendarizable; 359 isolated field anomalies were excluded.