← All Spreads

Aluminum Timespreads

LME aluminum prices, objective curve states, and explicitly contrarian timespread signals.

Data through 2026-08-03

Price and Regime Map

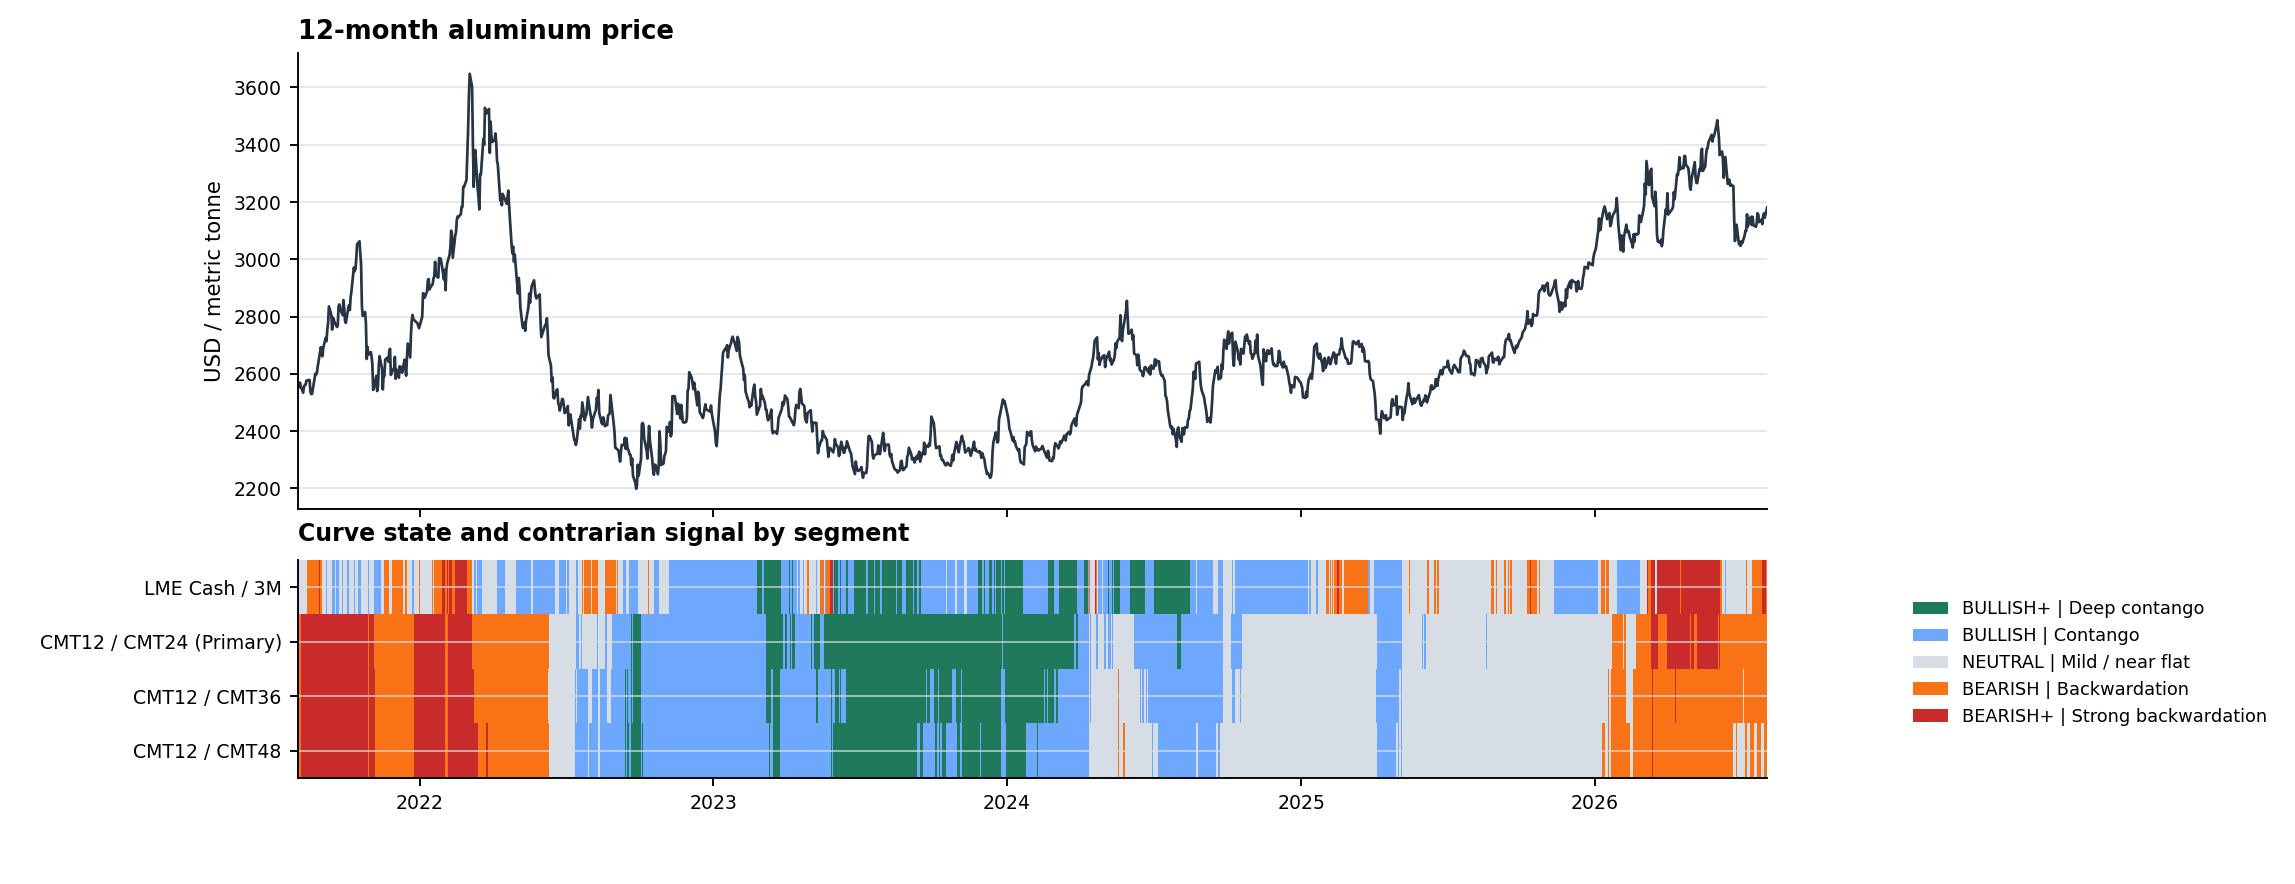
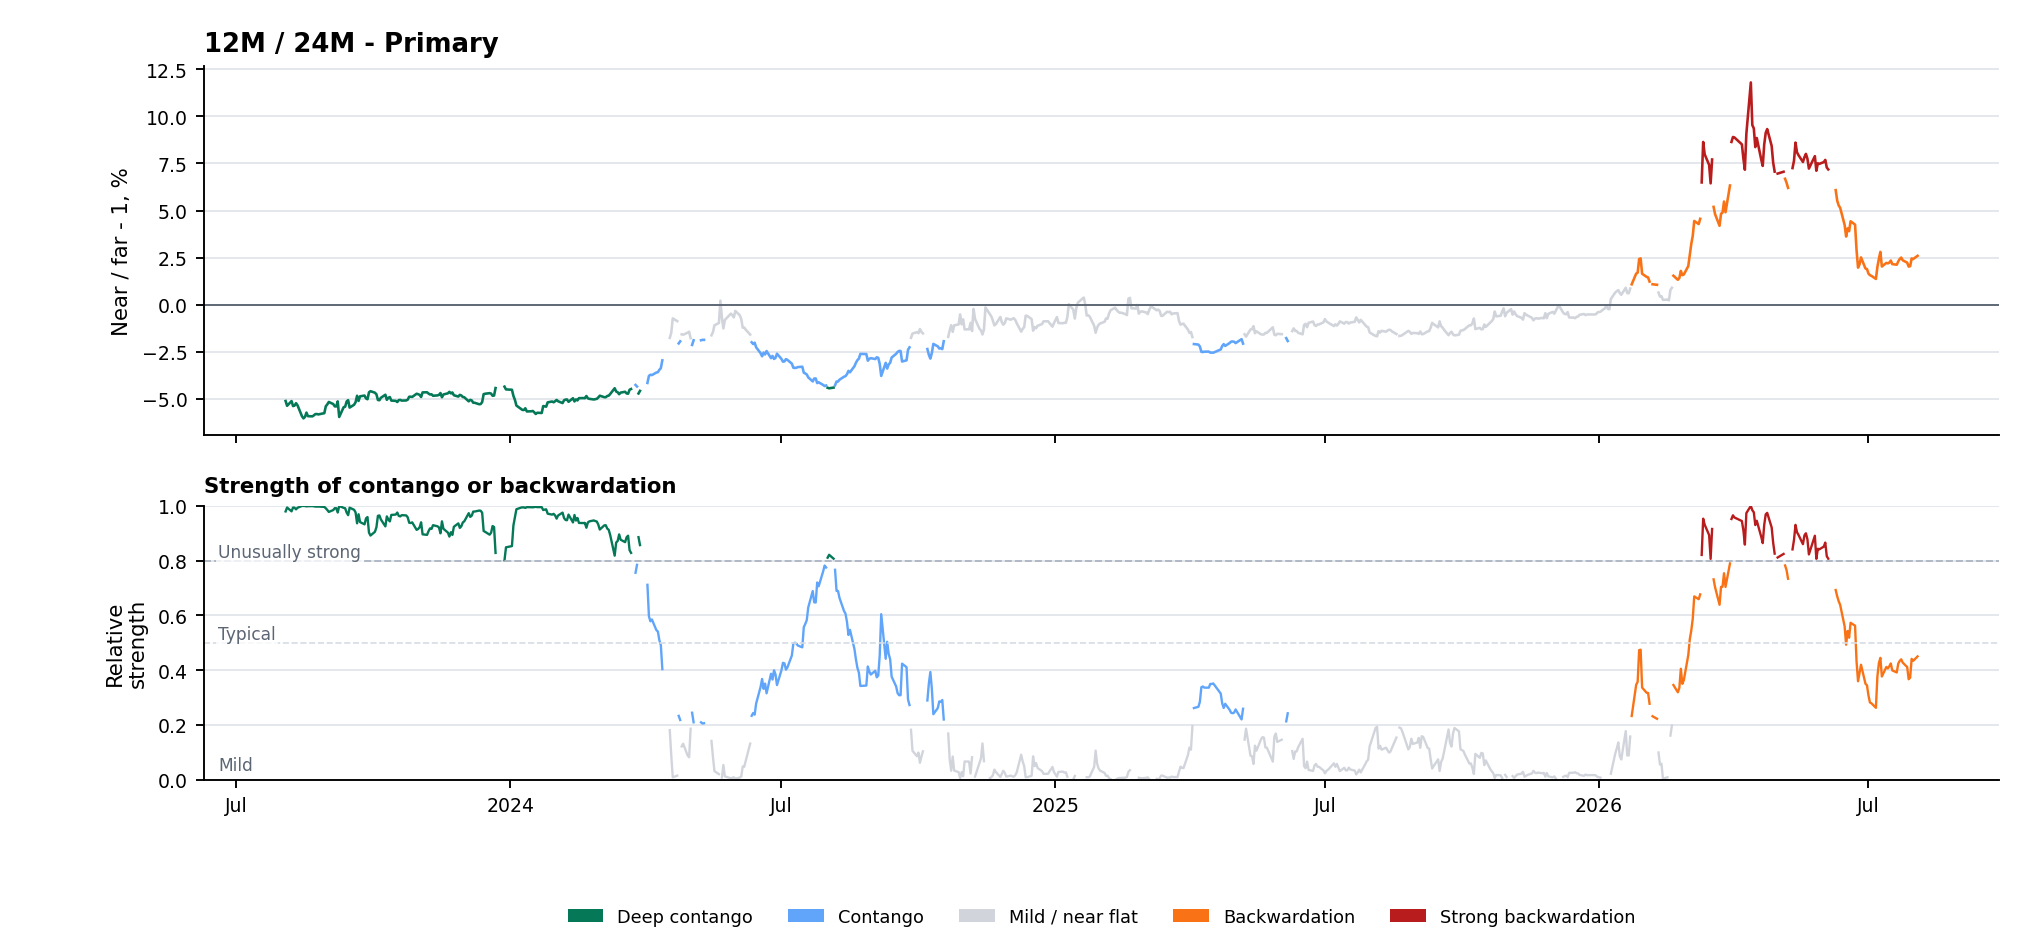
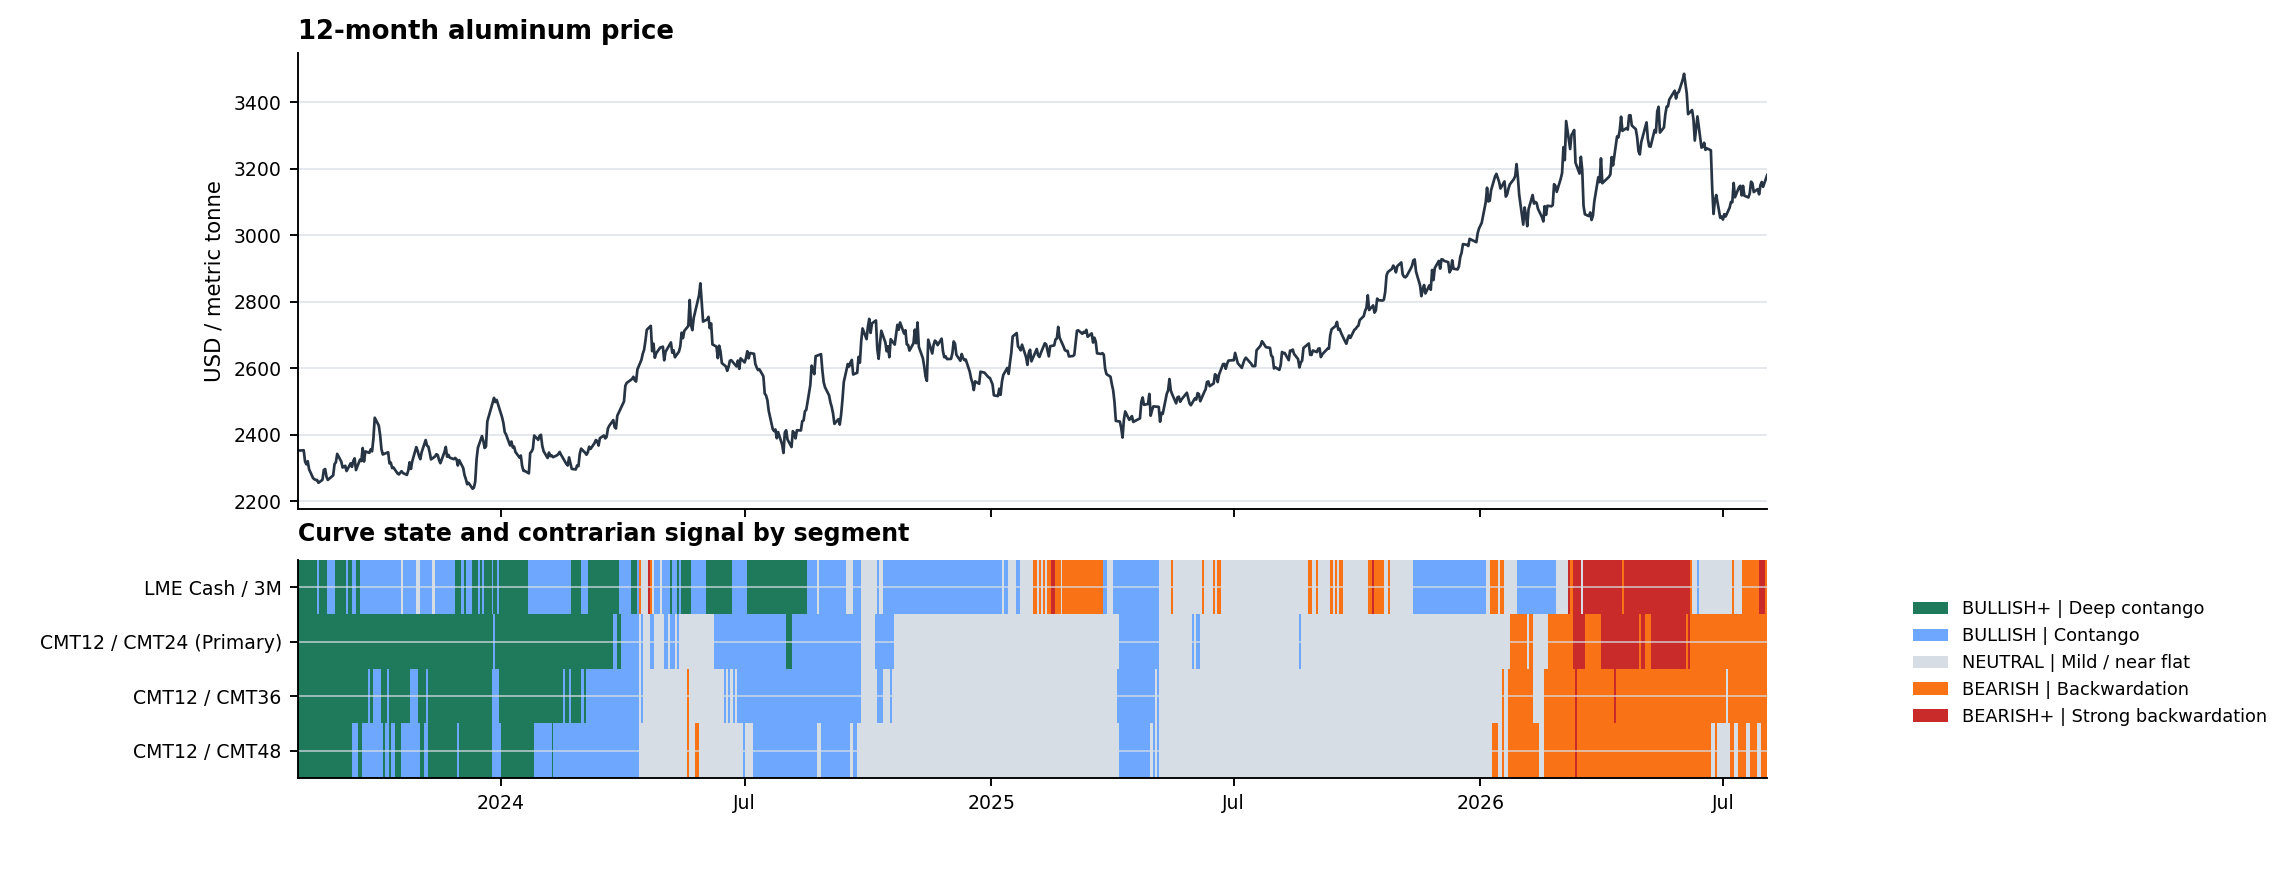
The primary curve is currently BACKWARDATION, mapped to BEARISH under the contrarian framework. Its magnitude exceeds 45% of earlier backwardation observations. The signal describes a mean-reversion view; the curve state itself describes current market structure.

Price and Regime Map

Price and Regime Map - Full history
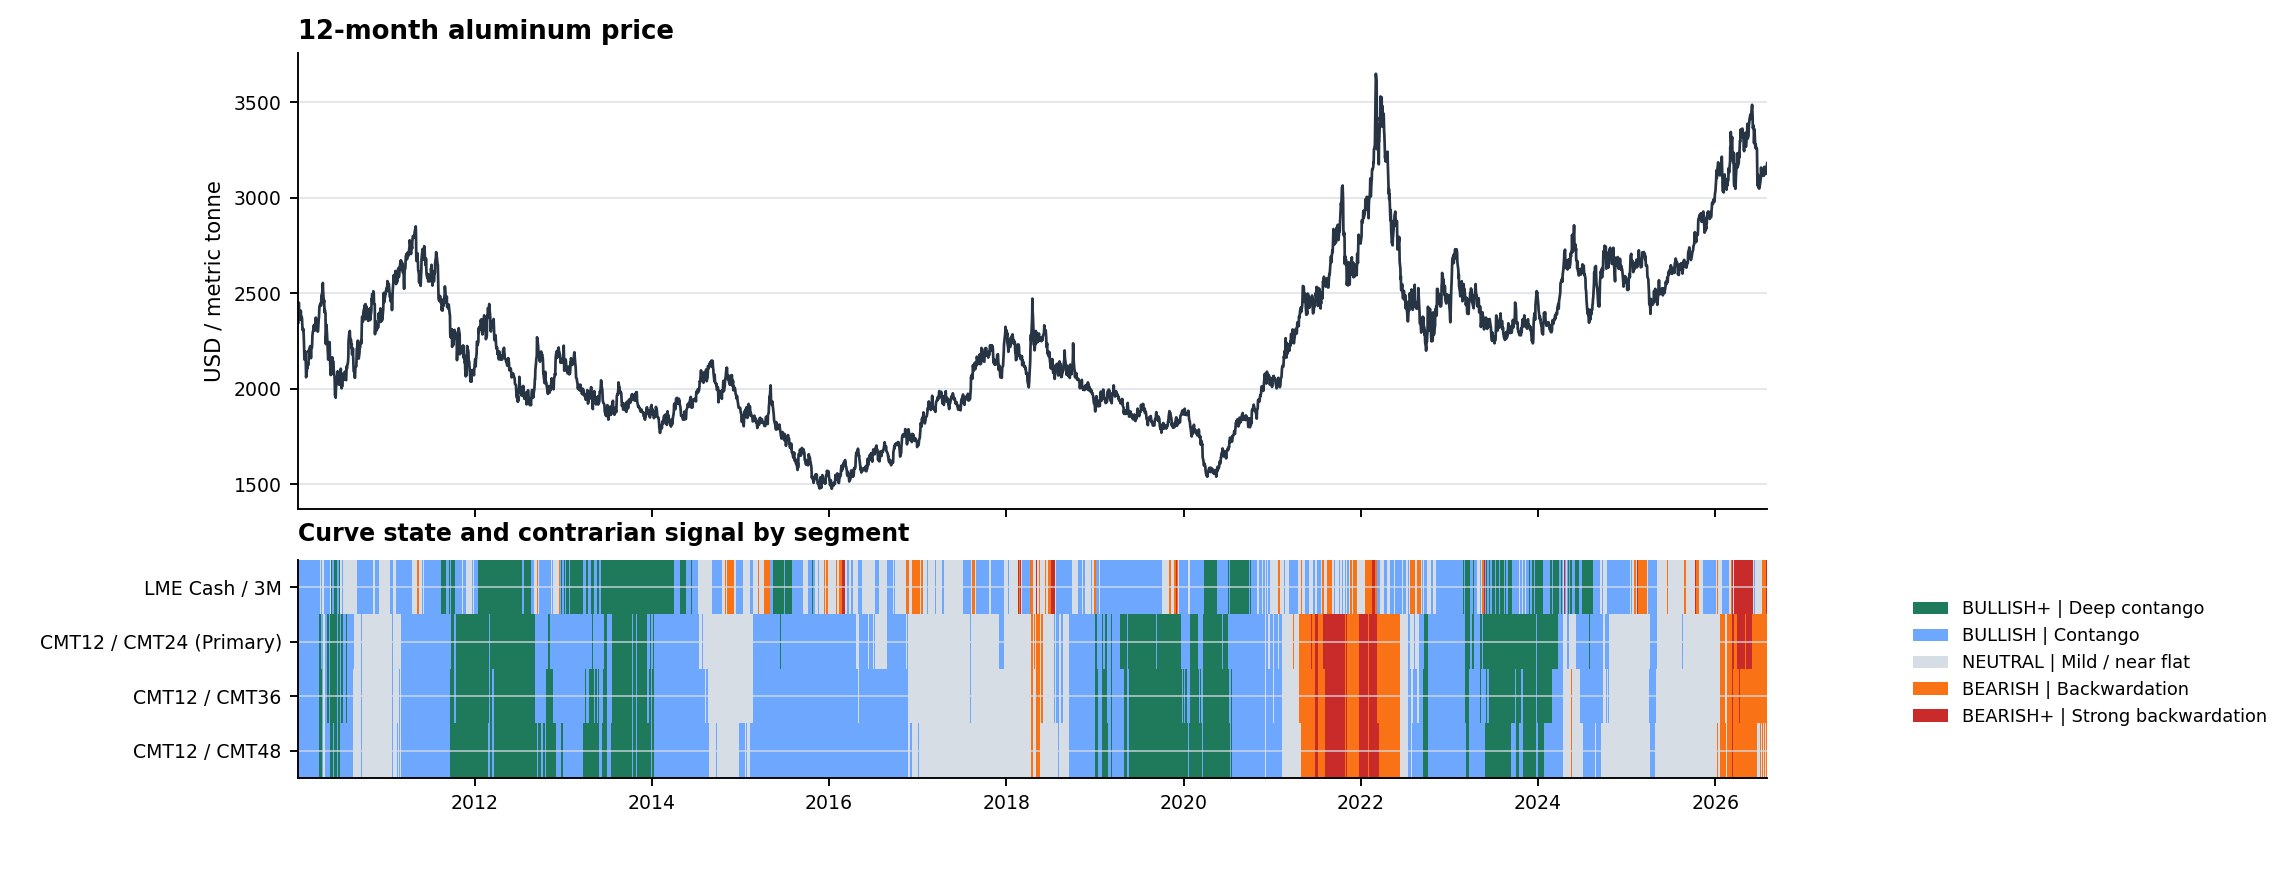
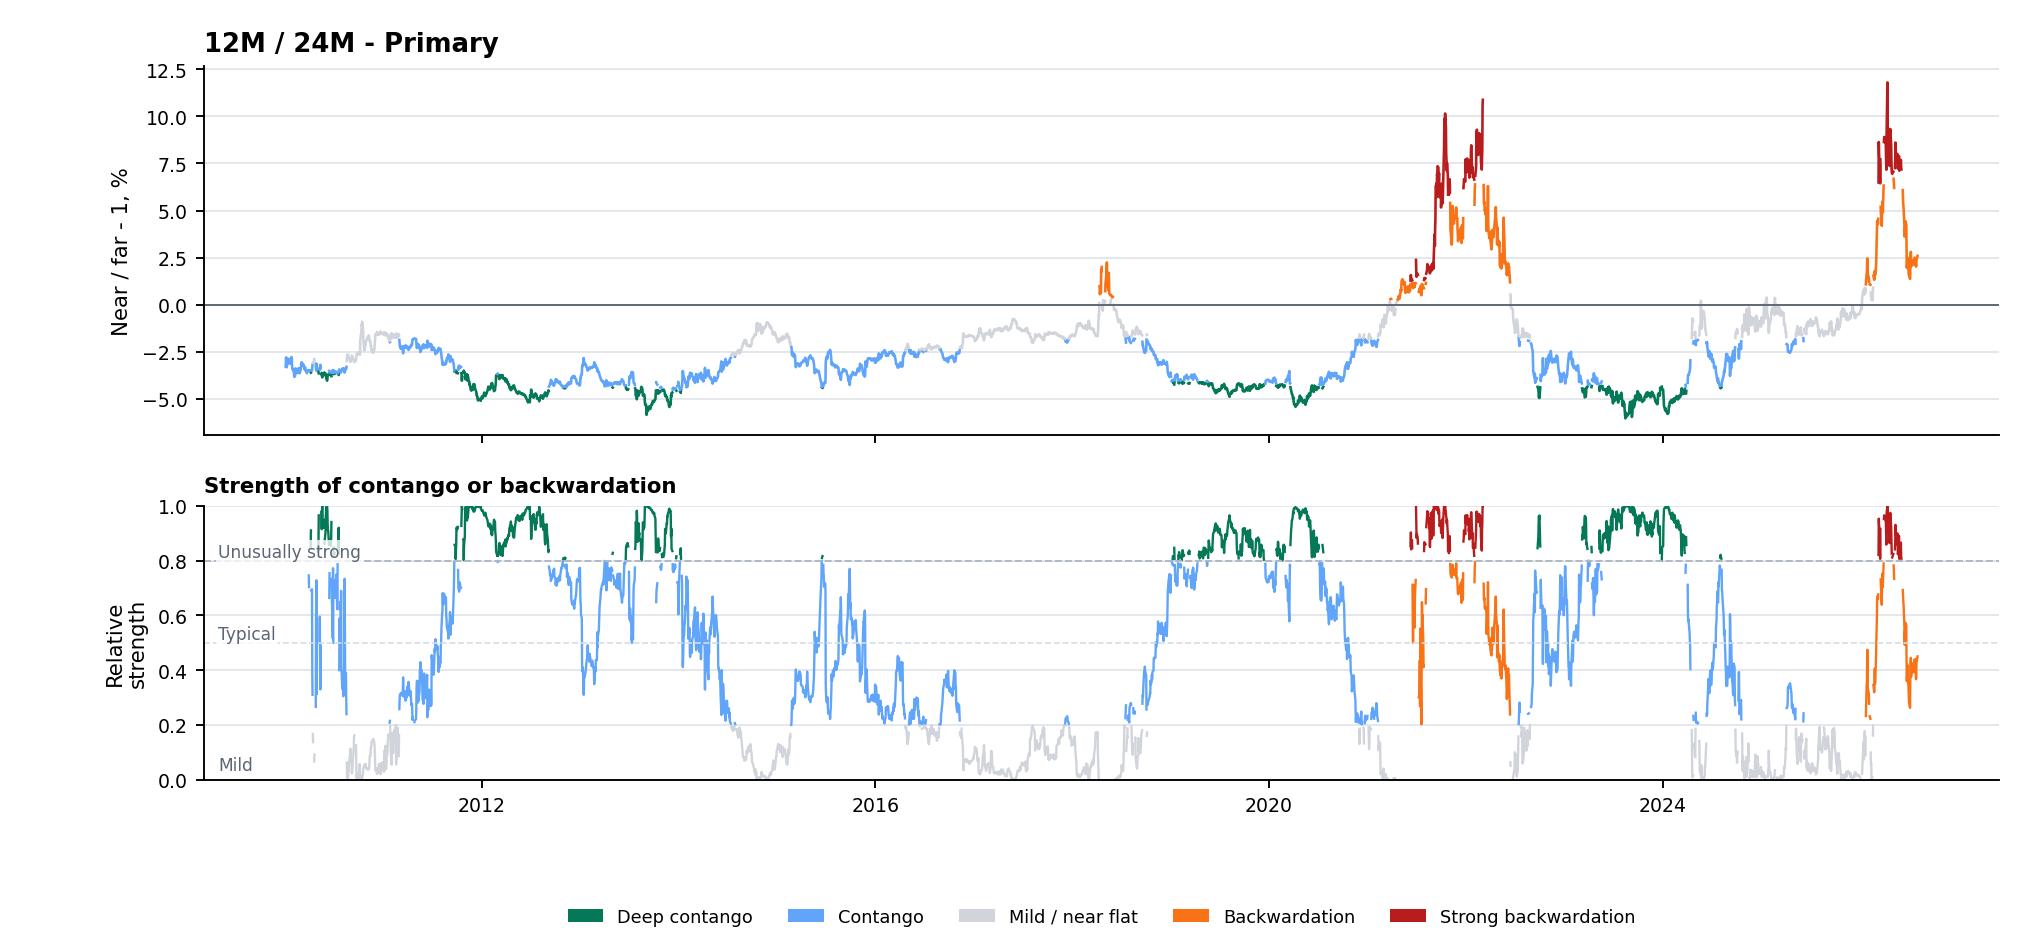
The 12-month price and regime rows share one date axis. The mildest 20% within contango or backwardation is neutral, the middle 60% retains the curve direction, and the strongest 20% receives a plus label.

Back to top

Prices Across the Curve

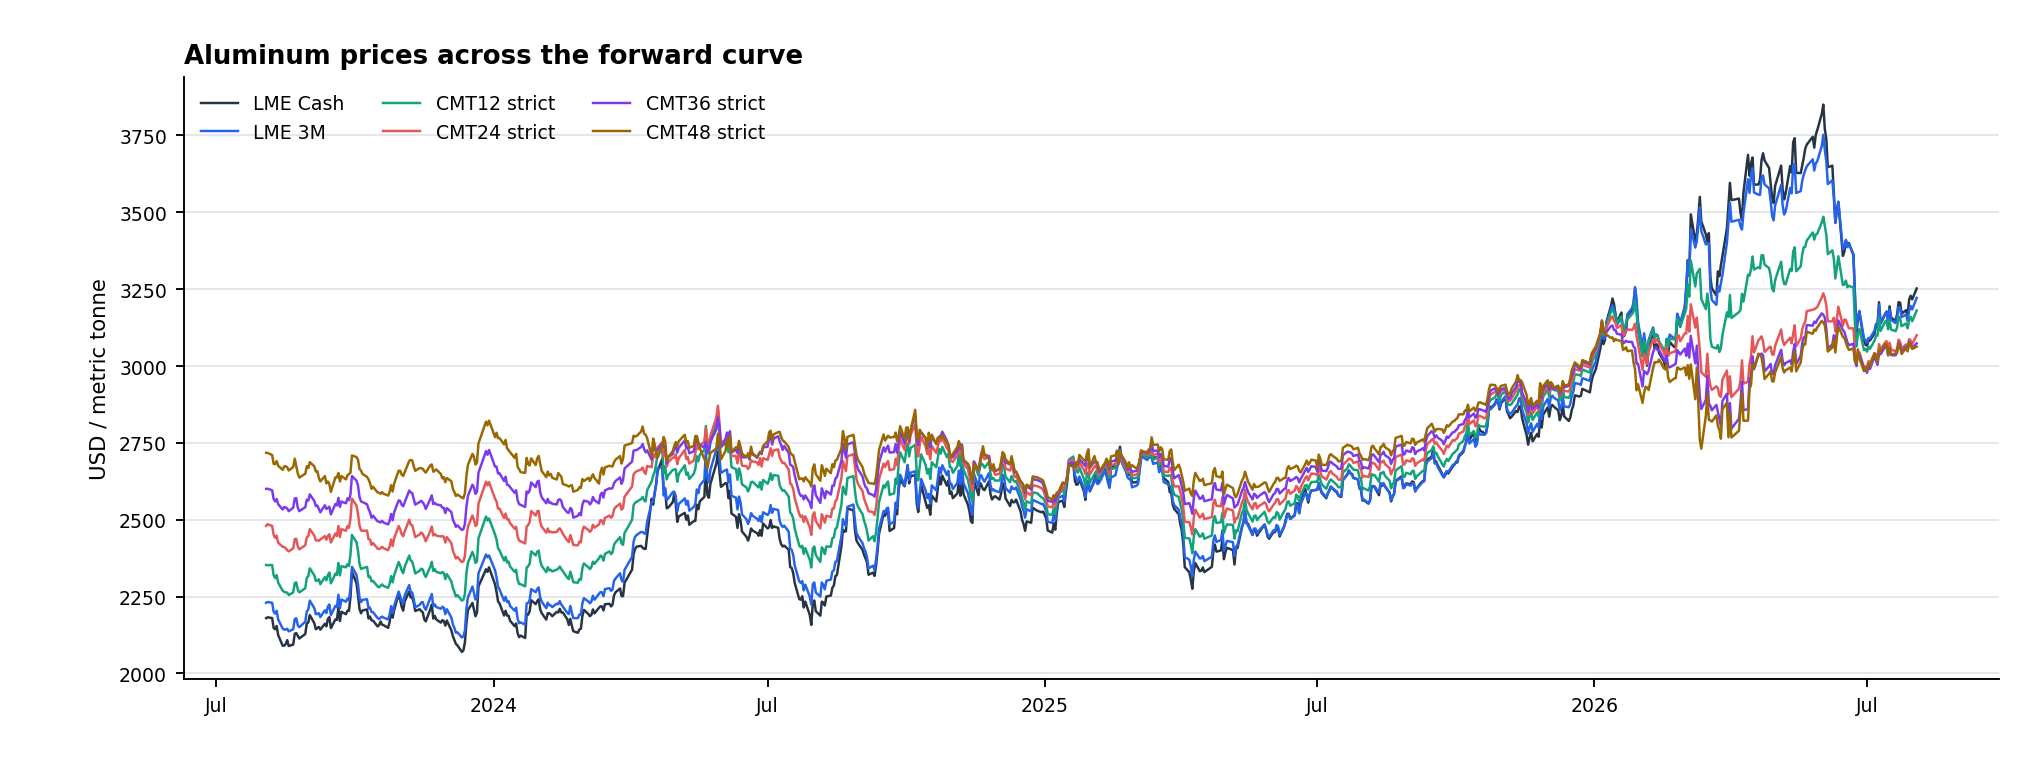
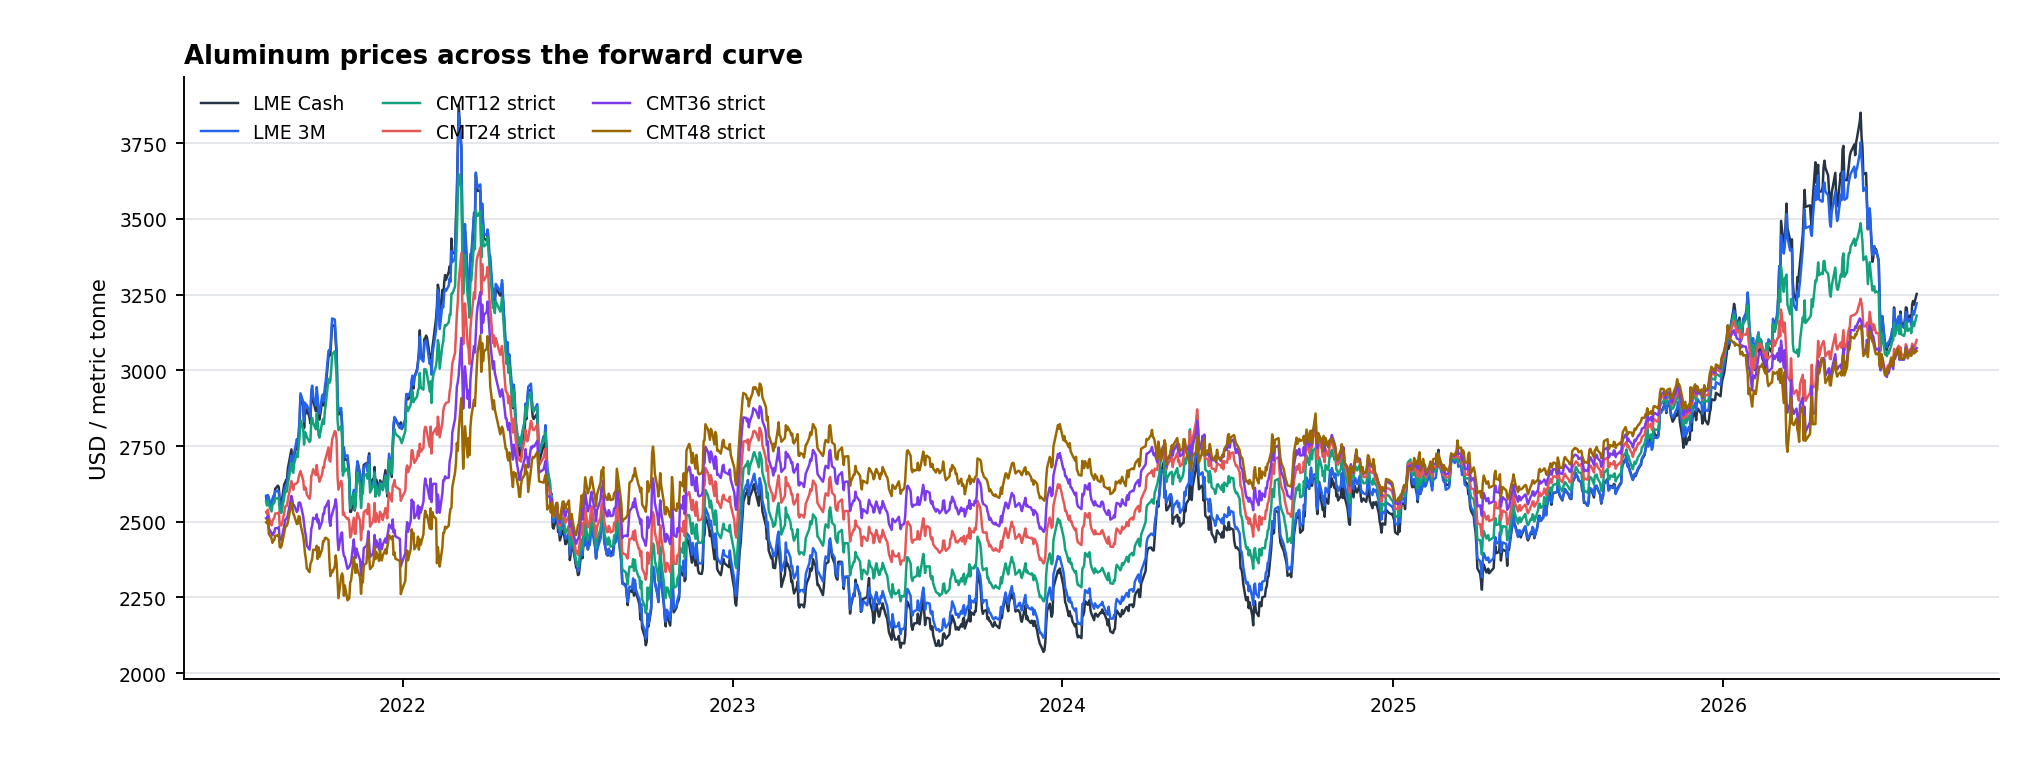
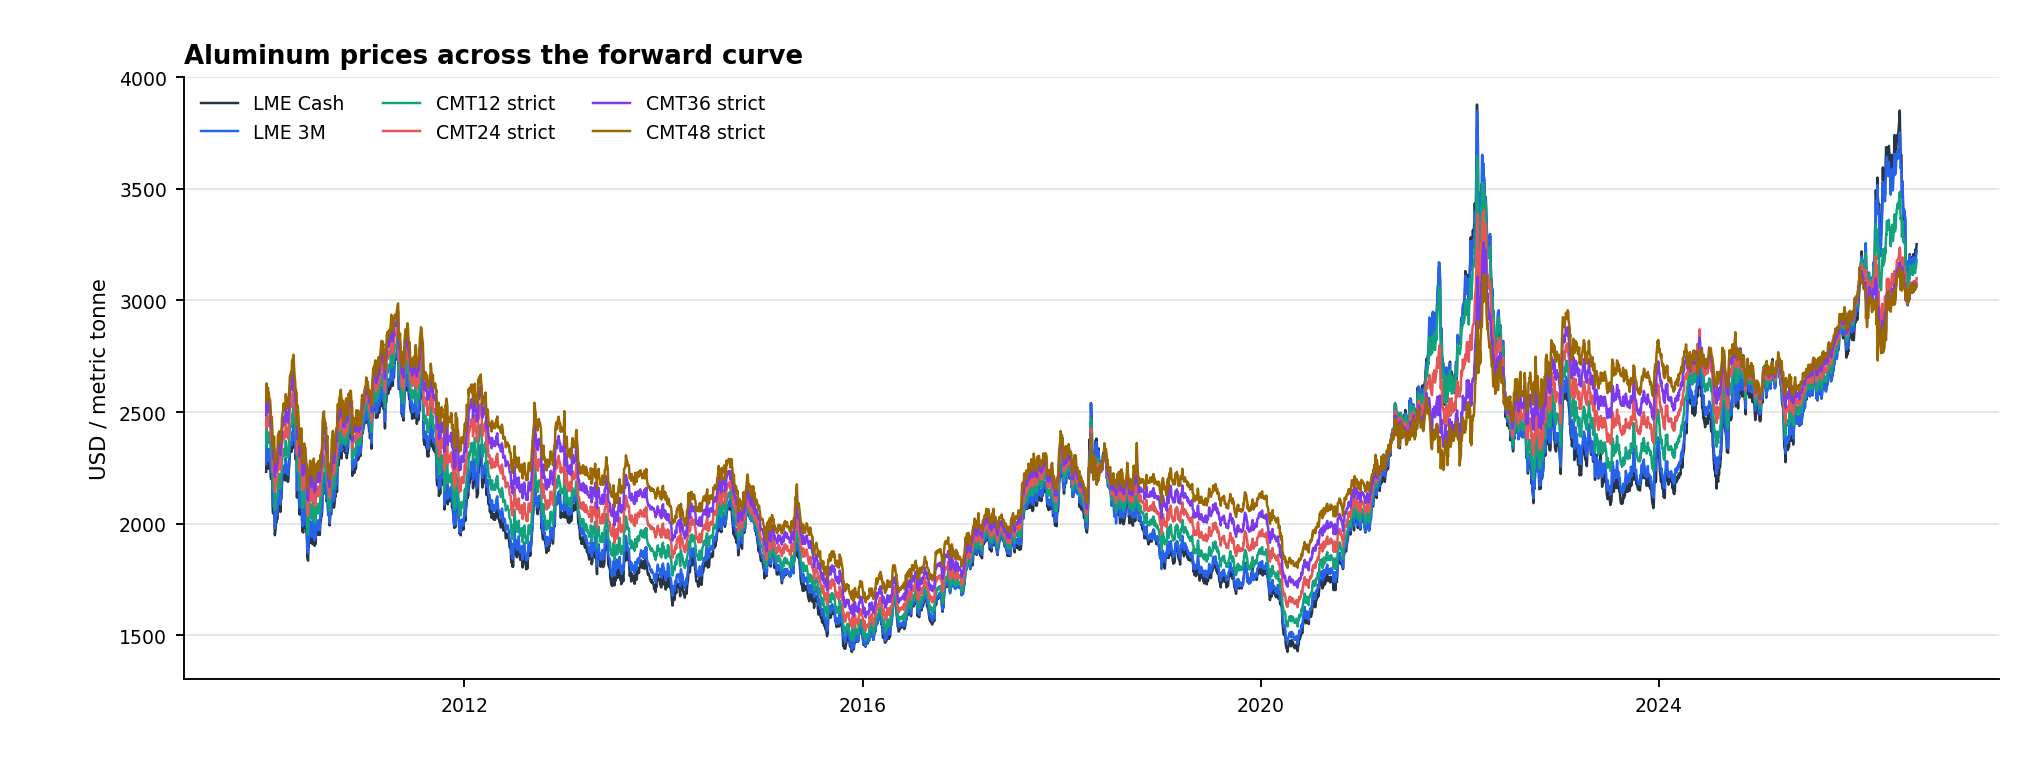
This view compares current and longer-dated aluminum prices on the same USD-per-metric-tonne basis.

Prices Across the Curve

Prices Across the Curve - Full history
Native LME settlement points and strict constant-maturity anchors are shown only where each series is available.

Back to top

Timespread Detail

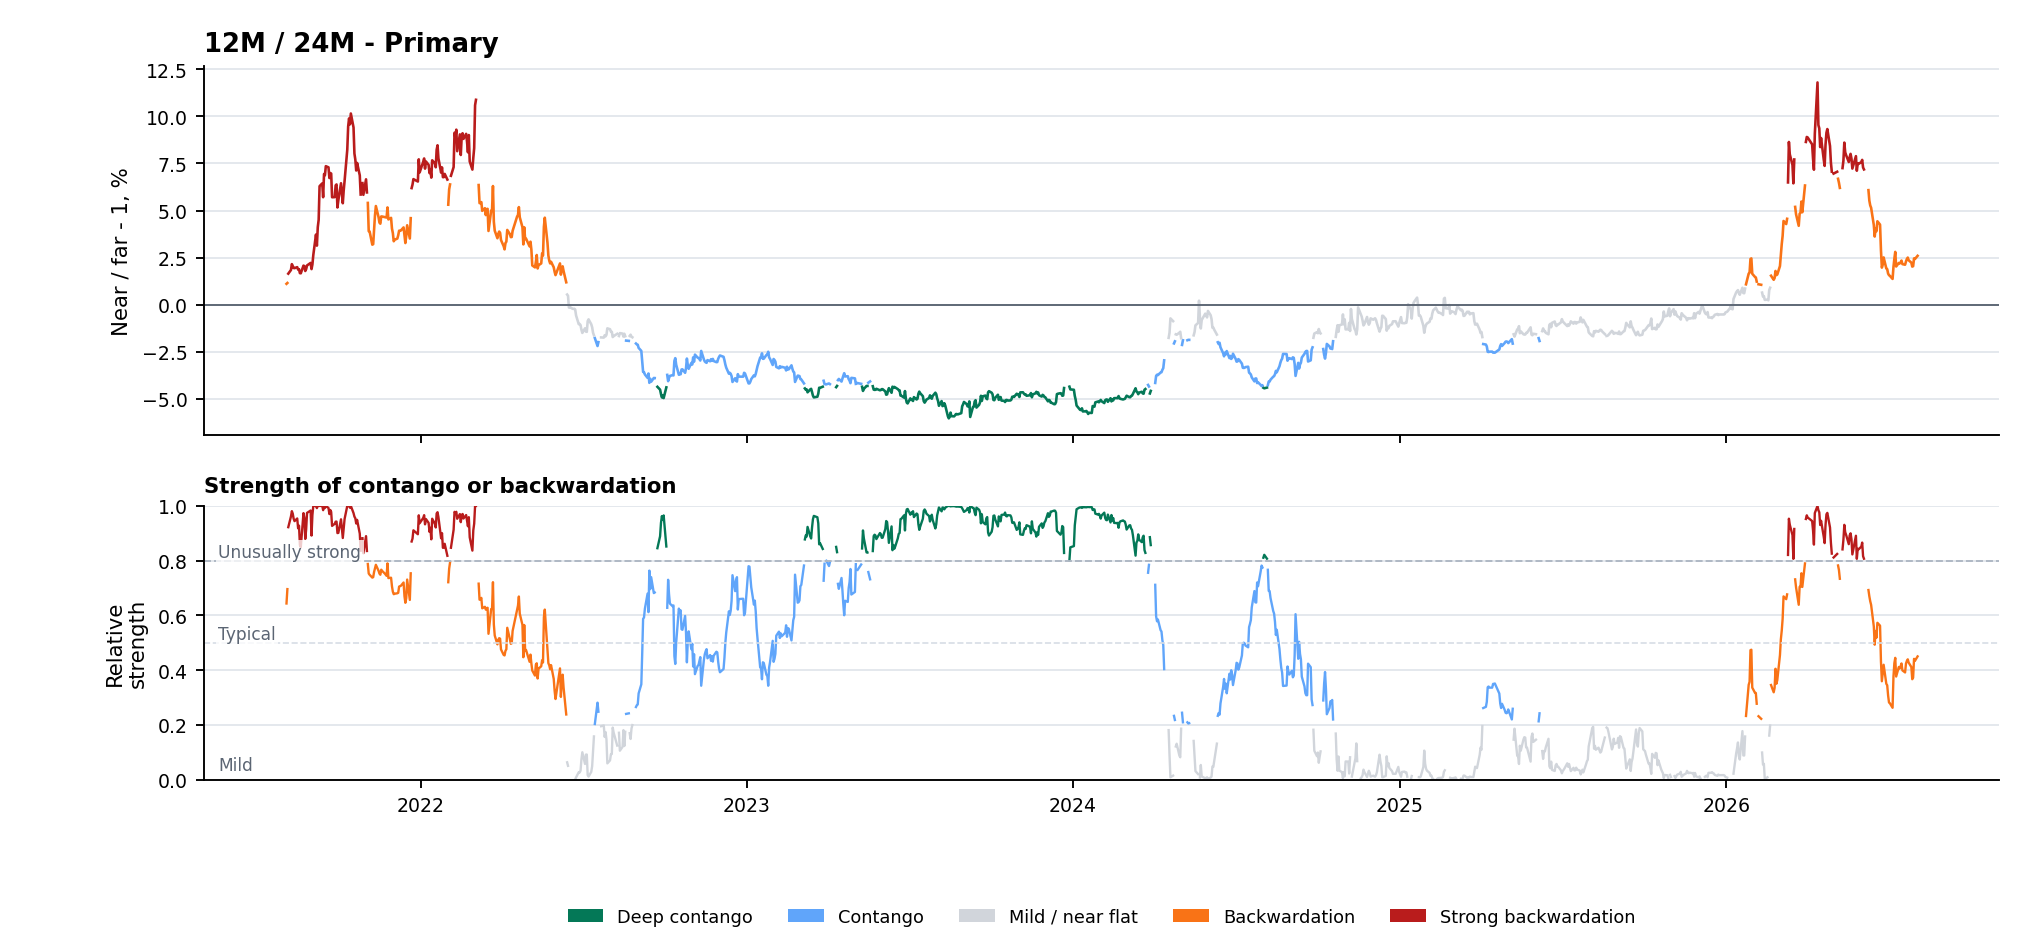
Choose whether to compare the 12-month aluminum price with the 24-, 36-, or 48-month point. The upper chart shows contango or backwardation; the lower chart shows how strong that curve shape is compared with its own history.

Timespread Detail

Spread
History
Timespread Detail - 12M / 24M - Primary - Full history
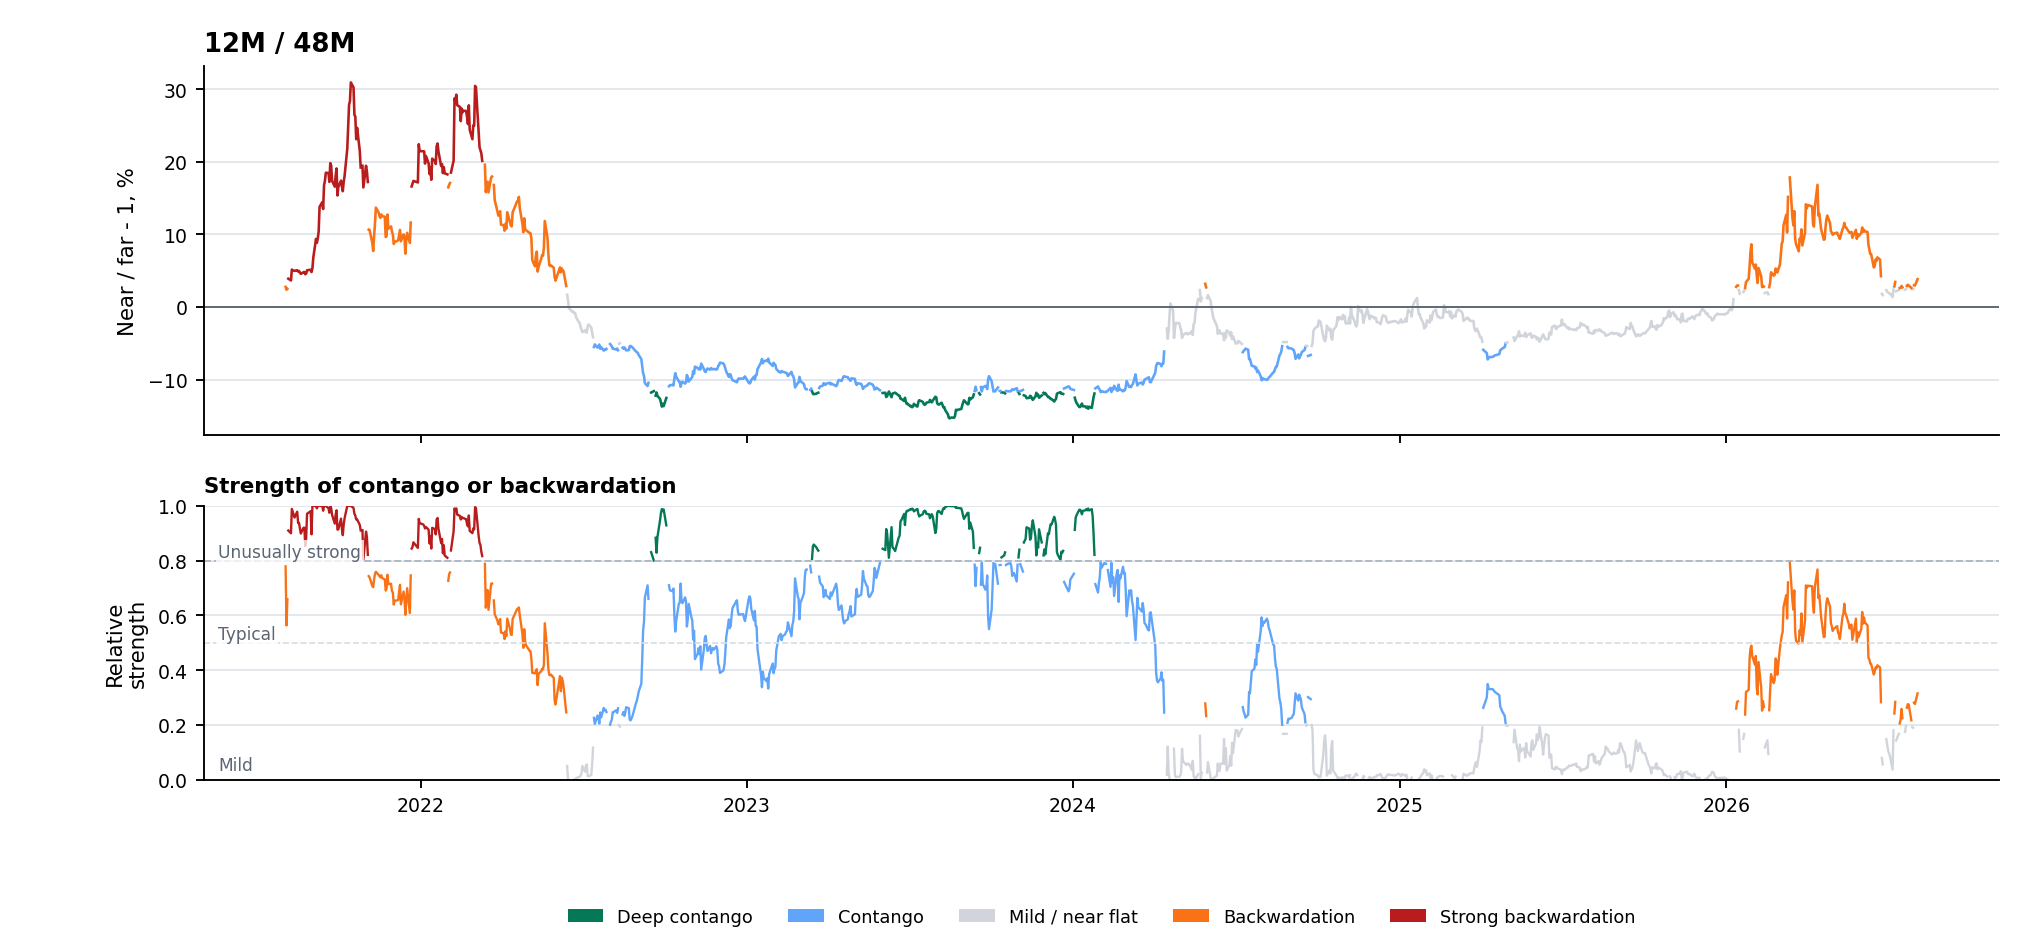
Positive spreads indicate backwardation and negative spreads indicate contango. The lower chart compares each curve reading with earlier periods in the same state. A score near 0 indicates mild contango or backwardation; 0.5 is typical; 0.8 or above is unusually strong.

Back to top

Timespread Comparison

The full-history charts are repeated here so all available horizons remain visible in printed or non-interactive copies.

12M / 24M - Primary

12M / 24M - Primary - Full history
The lower chart compares each curve reading with earlier periods in the same state. A score near 0 is mild, 0.5 is typical, and 0.8 or above is unusually strong.

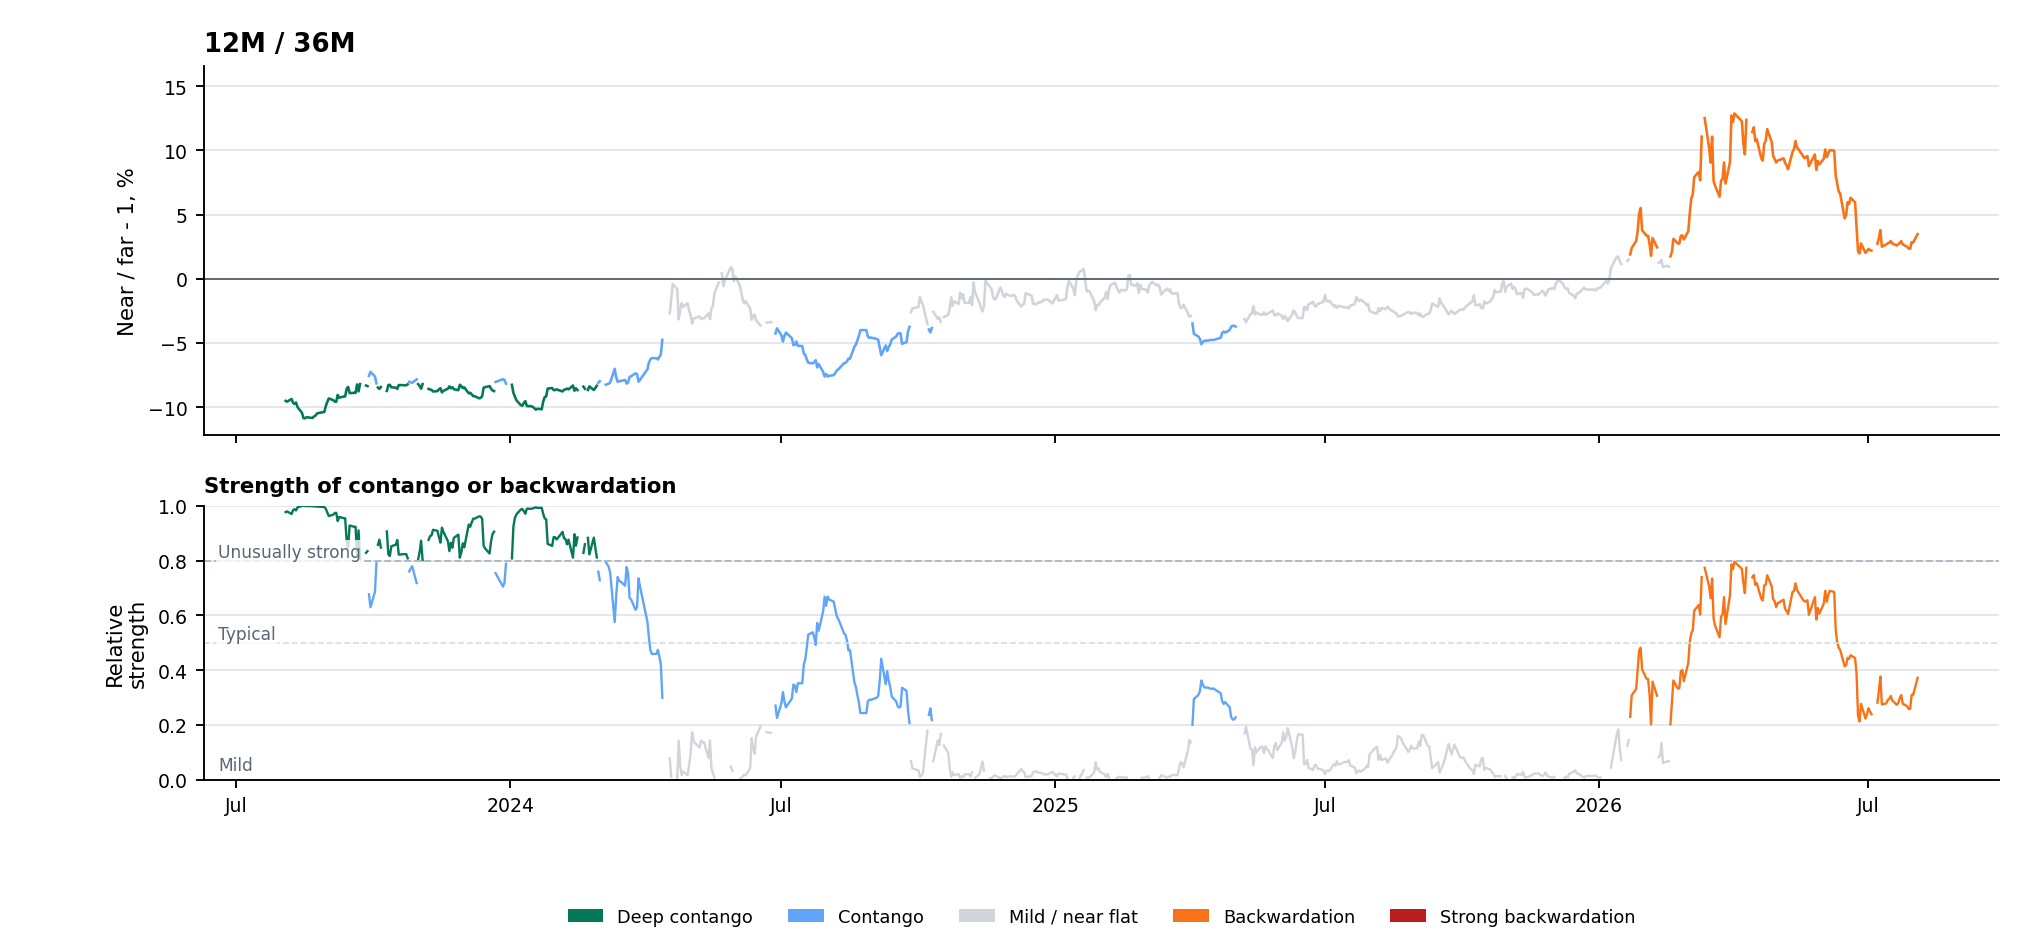
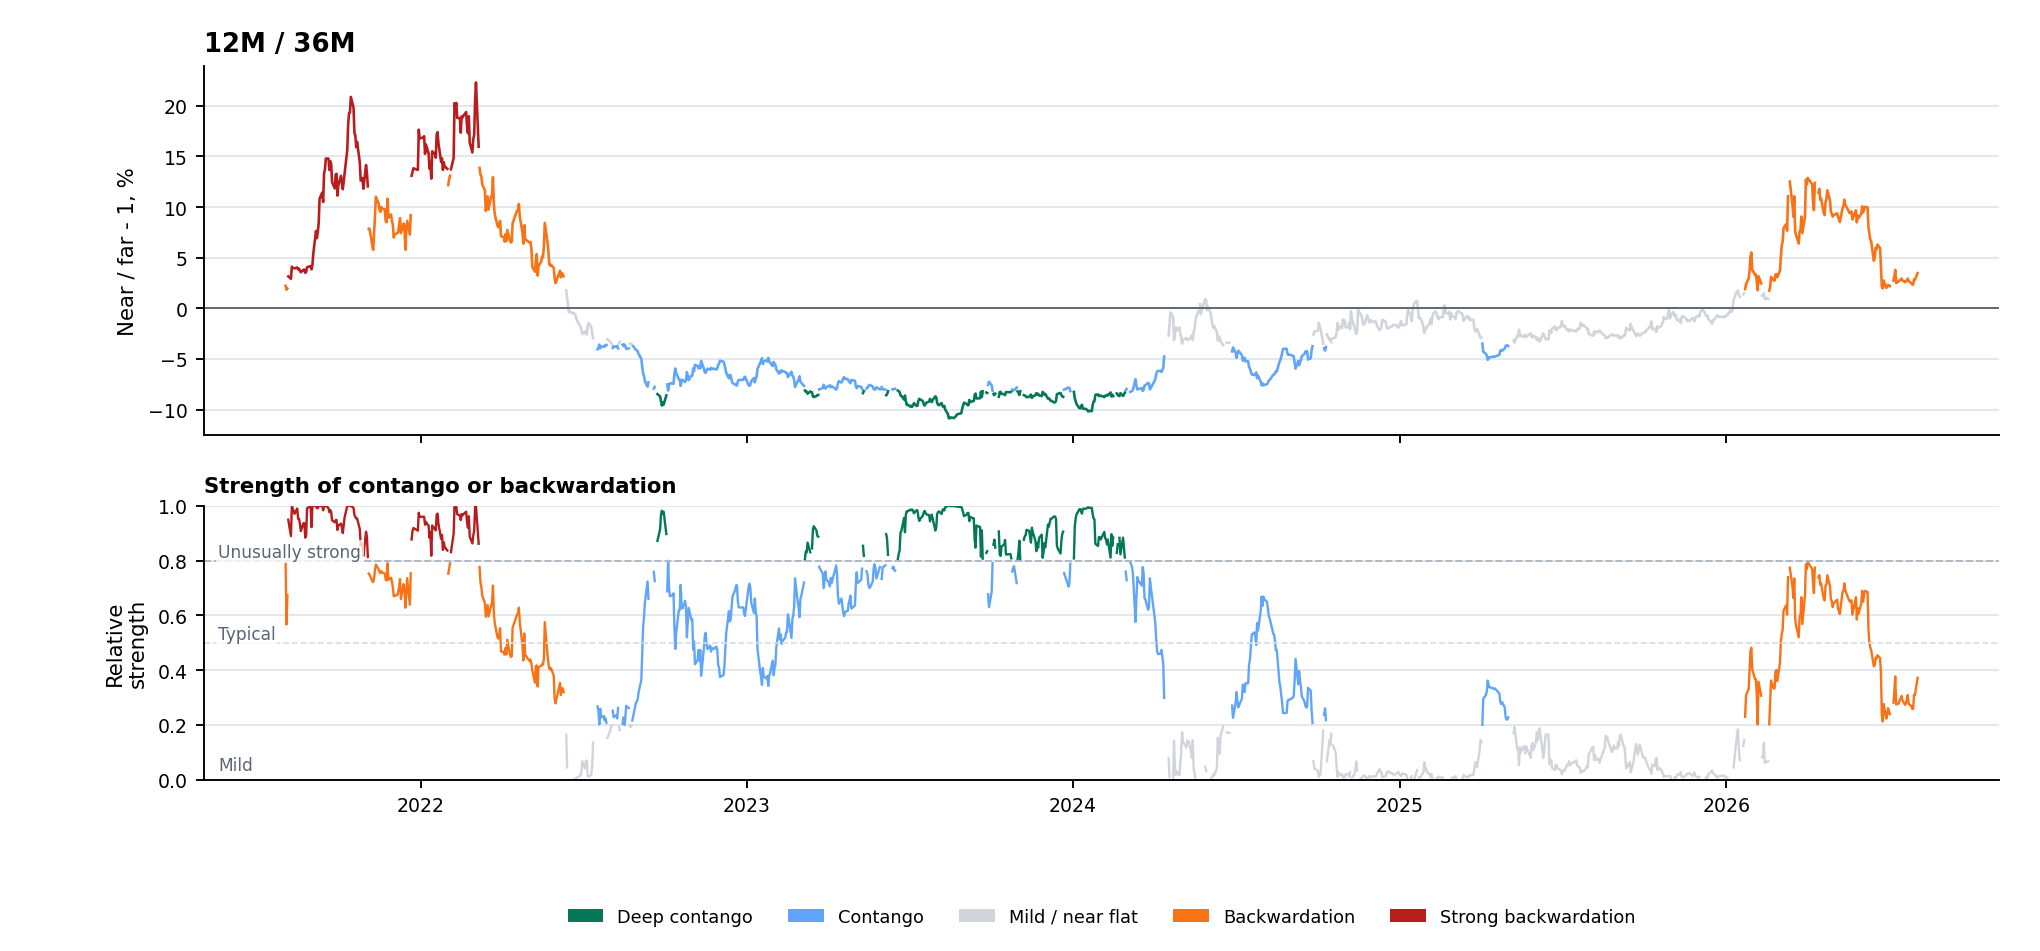
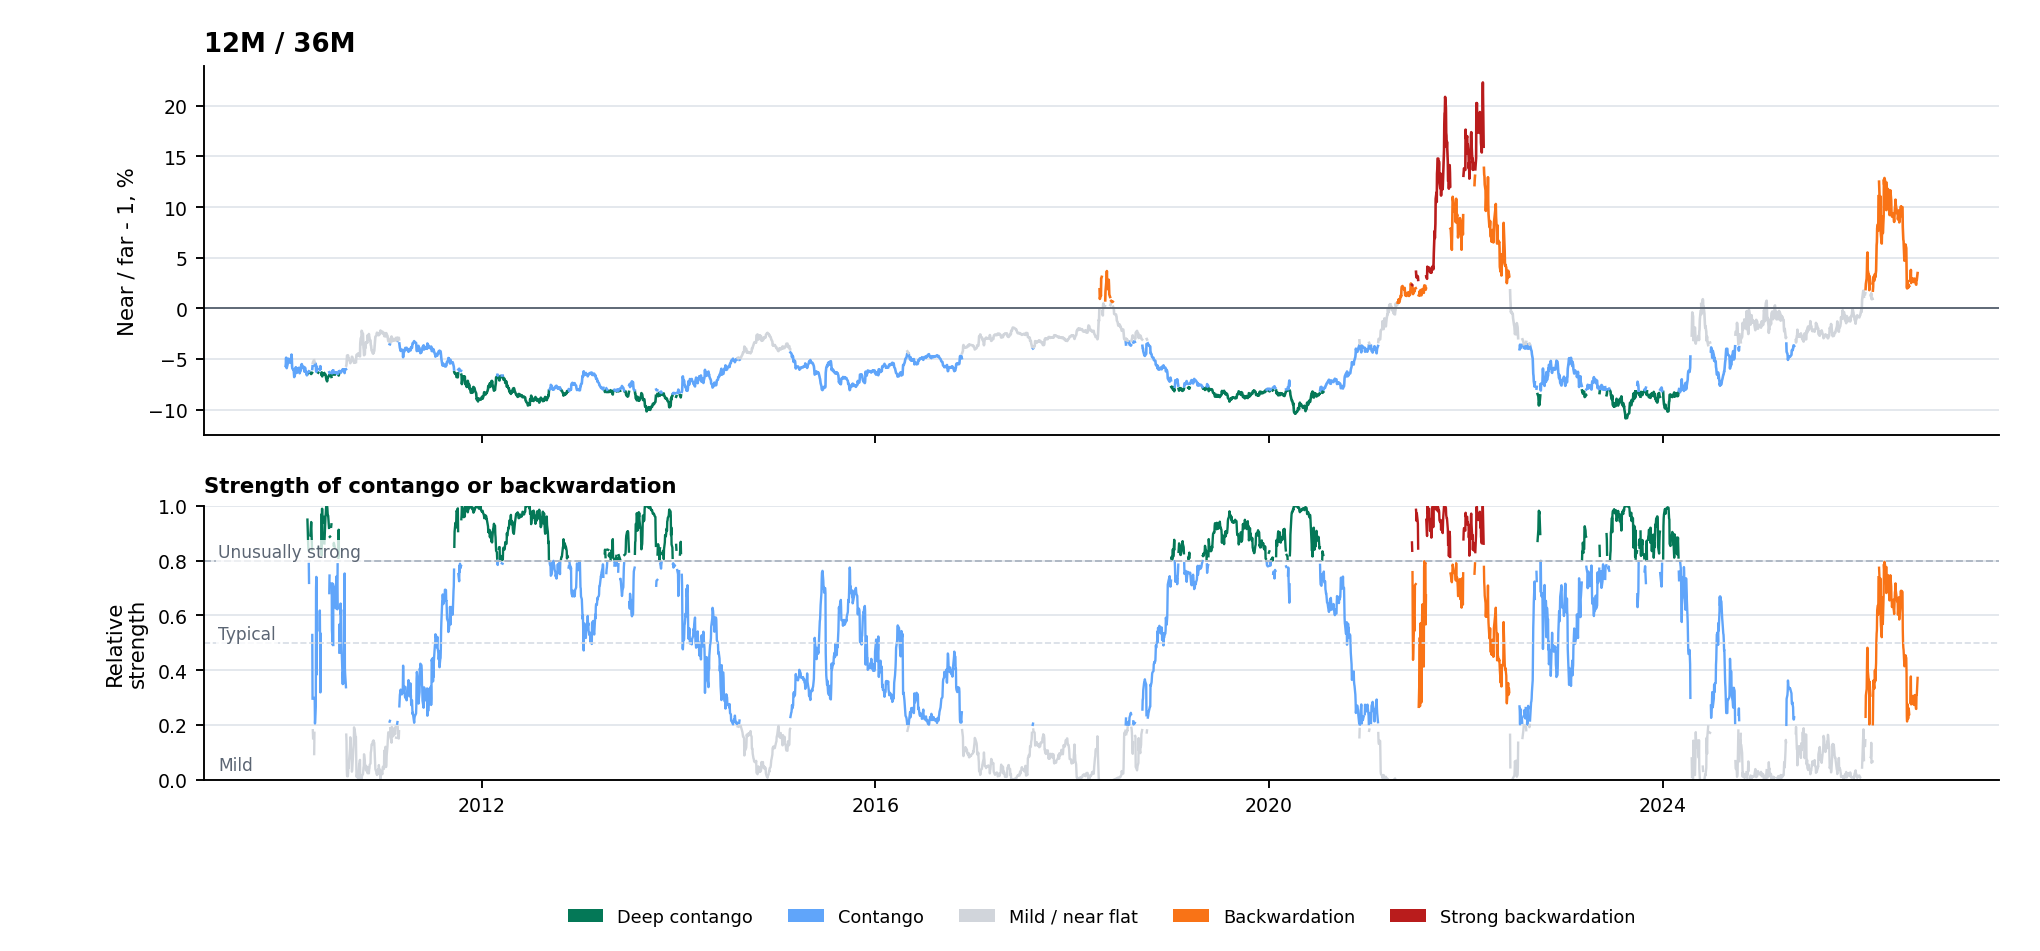
12M / 36M

12M / 36M - Full history
The lower chart compares each curve reading with earlier periods in the same state. A score near 0 is mild, 0.5 is typical, and 0.8 or above is unusually strong.

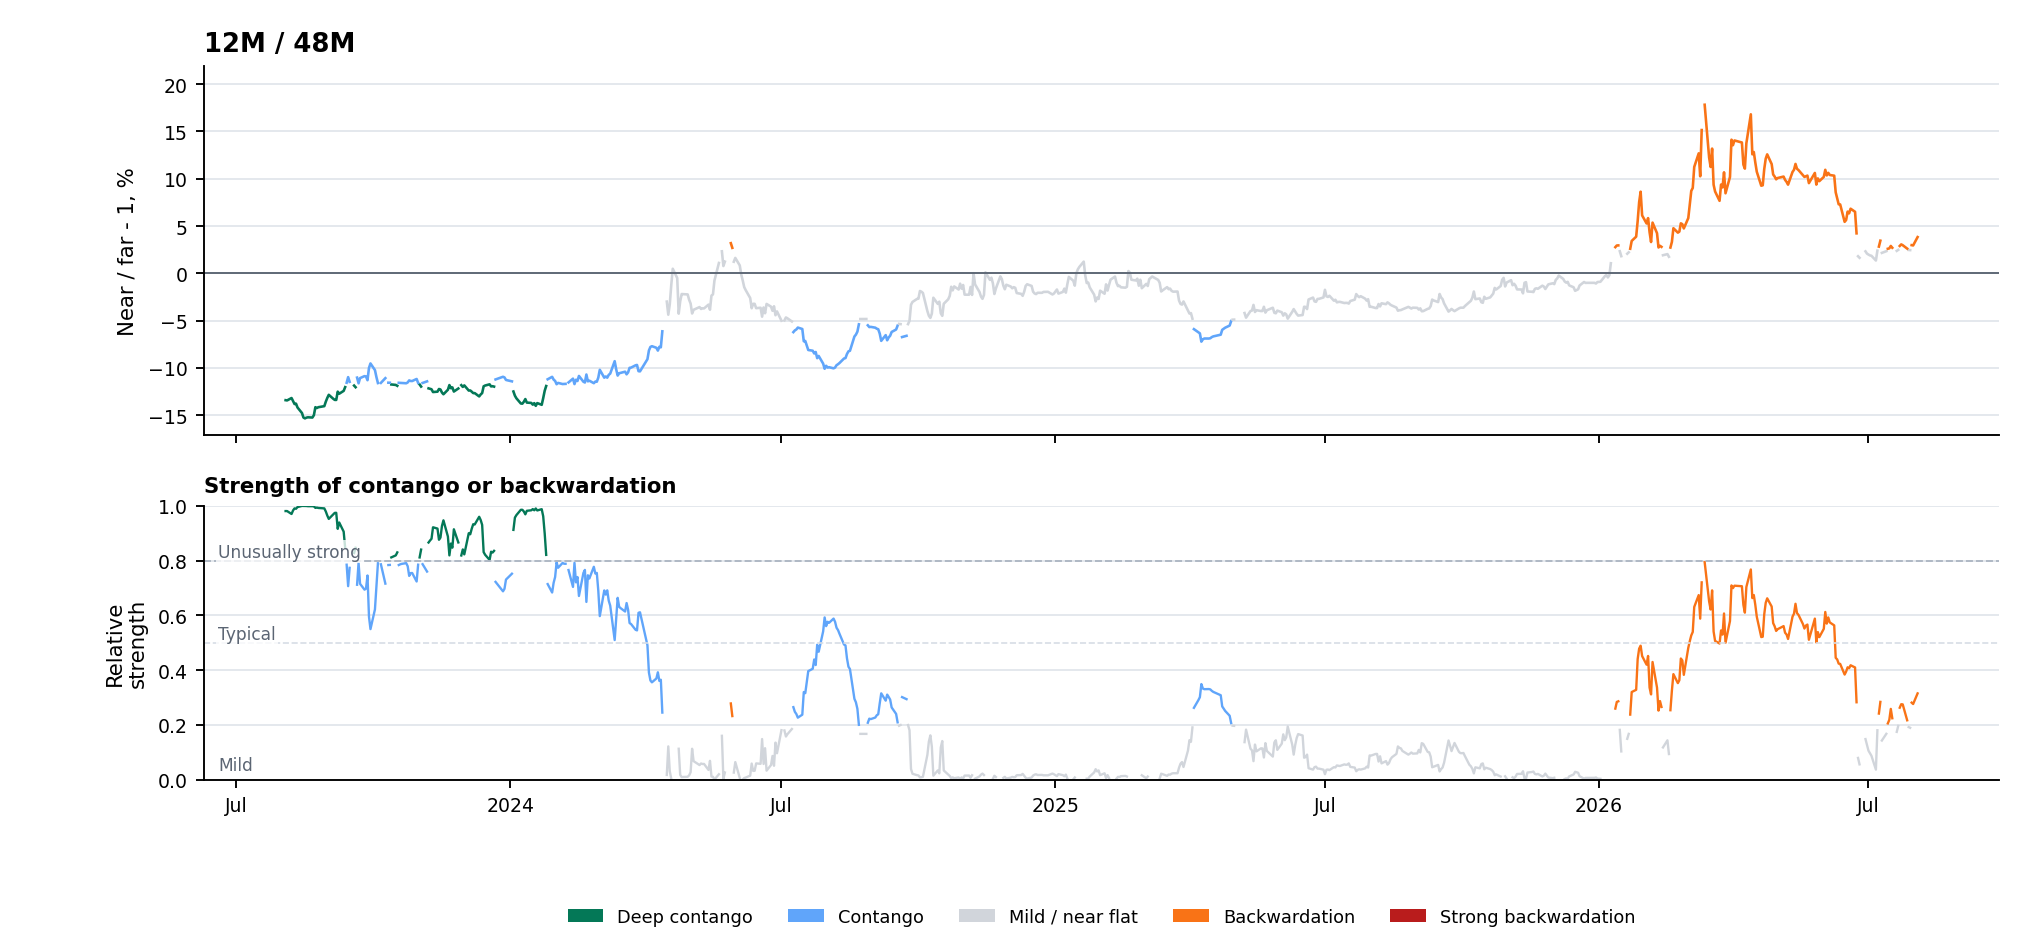
12M / 48M

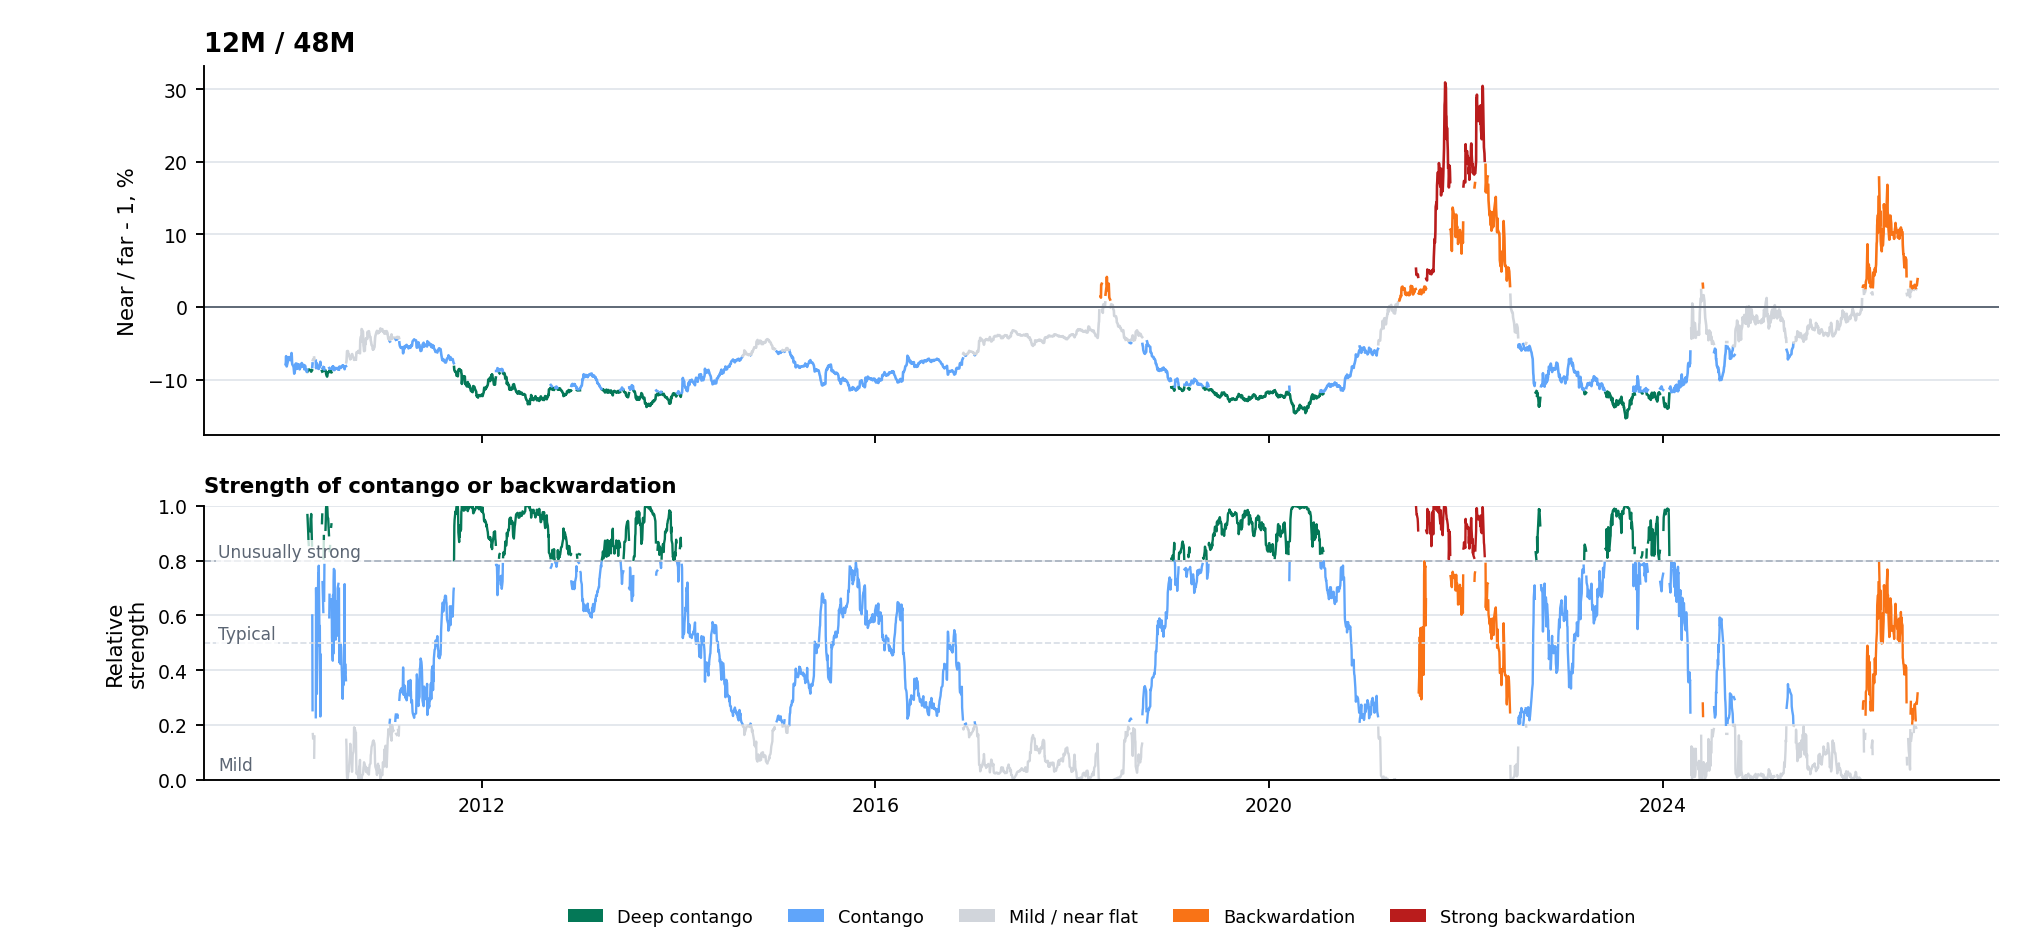
12M / 48M - Full history
The lower chart compares each curve reading with earlier periods in the same state. A score near 0 is mild, 0.5 is typical, and 0.8 or above is unusually strong.

Back to top

Methodology and Series Selection

Primary decision: Strict CMT12/CMT24 passed the trading-grid and bracket-width gates and is the primary calendar-tenor spread.

Native LME Cash, 3M, 15M, and 27M series use official Bloomberg settlement observations. The 12M, 24M, 36M, and 48M anchors are constructed only from dated LME monthly prompt contracts that bracket each target date.

Strict CMT: linear interpolation between the nearest valid lower and upper prompt dates. No nearest-contract or relaxed fallback is included. Every row retains both contracts, their expiries, effective months forward, bracket width, target distance, and interpolation weights.

Spread formulas: absolute spread = near minus far; percent spread = near divided by far minus one; log spread = log(near divided by far). Positive percent spreads are backwardation and negative spreads are contango.

Curve state: the log spread is annualized by the distance between the near and far tenors so the flat test is comparable across horizons. Annualized slopes below -0.25% are contango, slopes above +0.25% are backwardation, and readings inside that band are flat. Positive spreads mean the near price exceeds the far price.

Conditional severity: contango magnitude is ranked only against earlier contango observations, while backwardation magnitude is ranked only against earlier backwardation observations. Rankings are expanding and walk-forward. The severity line begins after 60 observations in that state.

Contrarian signal: mathematically flat readings and the mildest 20% within either non-flat state map to NEUTRAL. The middle 60% maps contango to BULLISH and backwardation to BEARISH. The strongest 20% maps deep contango to BULLISH+ and strong backwardation to BEARISH+. This is a mean-reversion interpretation, not an outright-price forecast.

Signed spread rank: the expanding percentile of the log spread against all prior observations remains in the processed CSV as a diagnostic, but it no longer determines the regime map because Aluminum spends substantially more time in contango than backwardation.

Back to top
Data Quality

Calendar-row, weekday, and actual LME trading-grid coverage are reported separately. Strict CMT must cover at least 95% of the observed LME 3M trading grid and keep prompt brackets within two months to become the primary series.

series calendar_row_coverage business_day_coverage trading_grid_coverage strict_method_share first_valid_date latest_valid_date latest_age_business_days longest_repeated_price_run large_daily_move_count median_bracket_width_months max_bracket_width_months status
LME Cash 0.692 0.969 1.000 2010-01-04 2026-08-03 1 1 0 ok
LME 3M 0.692 0.969 1.000 2010-01-04 2026-08-03 1 2 0 ok
LME 15M 0.692 0.969 1.000 2010-01-04 2026-08-03 1 2 0 ok
LME 27M 0.692 0.969 1.000 2010-01-04 2026-08-03 1 1 0 ok
CMT12 0.692 0.969 1.000 1.000 2010-01-04 2026-08-03 1 1 0 0.920 1.150 ok
CMT24 0.692 0.969 1.000 1.000 2010-01-04 2026-08-03 1 1 0 0.920 1.150 ok
CMT36 0.692 0.969 1.000 1.000 2010-01-04 2026-08-03 1 1 0 0.920 1.150 ok
CMT48 0.692 0.969 1.000 1.000 2010-01-04 2026-08-03 1 1 0 0.920 1.150 ok

Back to top

Candidate Spread Comparison

The primary 12M/24M spread compares one-year and two-year aluminum prices. The 12M/36M and 12M/48M diagnostics show progressively longer forward-curve horizons. The native 3M/15M spread remains the fallback because both legs are published fixed-tenor LME series.

candidate_spread business_day_coverage trading_grid_coverage first_valid_date latest_date latest_simple_percent_spread latest_recursive_percentile latest_curve_state latest_state_severity_percentile latest_contrarian_signal observation_count status
LME_CASH/LME_3M 0.969 1.000 2010-01-04 2026-08-03 0.955 0.973 backwardation 0.793 BEARISH 4190 ok
LME_3M/LME_15M 0.969 1.000 2010-01-04 2026-08-03 2.112 0.946 backwardation 0.460 BEARISH 4190 ok
LME_3M/LME_27M 0.969 1.000 2010-01-04 2026-08-03 4.310 0.939 backwardation 0.417 BEARISH 4190 ok
CMT12/CMT24_STRICT 0.969 1.000 2010-01-04 2026-08-03 2.594 0.939 backwardation 0.450 BEARISH 4190 ok
CMT12/CMT36_STRICT 0.969 1.000 2010-01-04 2026-08-03 3.478 0.931 backwardation 0.372 BEARISH 4190 ok
CMT12/CMT48_STRICT 0.969 1.000 2010-01-04 2026-08-03 3.829 0.925 backwardation 0.315 BEARISH 4190 ok

The overlap audit quantifies how much the strict 12M/24M calendar-tenor spread differs from the native 3M/15M fallback over shared history.

comparison overlap_observations mean_abs_percent_spread_difference mean_abs_log_spread_difference log_spread_correlation regime_disagreement_rate
CMT12/CMT24_STRICT vs LME_3M/LME_15M 4190 0.756 0.008 0.955 0.237

Back to top

Expanded chart